REVIEW 1 major objections 5 minor 43 references
Impacts of Retina-related Zones on Quality Perception of Omnidirectional Image
T0 review · 1 major / 5 minor · reviewed 2026-08-14 · deepseek-v4-flash
Pith's one-line read Fovea and parafovea dominate perceived 360-degree image quality.
desk verdict This paper has a genuinely useful new database and a plausible qualitative finding, but the fitted zone weights in Table 4 are under-identified and the numerical values should not be used prescriptively. read the letter →
The pith
A machine-rendered reading of the paper's core claim, the machinery that carries it, and where it could break.
The reading
What carries the argument
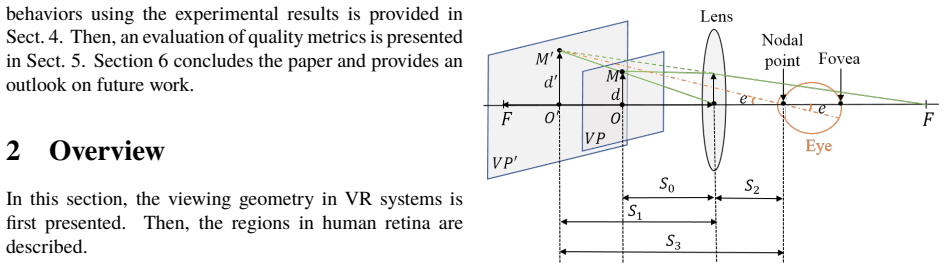
The load-bearing object is the zone-weighted formulation (ZWF), a simple eccentricity-weighted MSE: $\mathrm{ZWF}=10\log_{10}\left(\frac{\mathrm{MAX}^2}{\sum_{k=1}^{5} w_k \mathrm{MSE}_k}\right)$, where $\mathrm{MSE}_k$ is the mean squared error of pixels whose eccentricity falls in zone $Z_k$ and $w_k$ is the fitted importance of that zone. The eccentricity of each pixel is computed from a VR lens model (Eqs. 1–12), so pixels are assigned to the five retinal-zone intervals rather than to arbitrary rings. Fitting the five weights and the five parameters of the logistic mapping together by least squares is what turns subjective ratings into the per-zone importance table; the high per-image correlation (PCC $\ge 0.97$) is the evidence that the weights carry the perceptual signal.
What would settle it
Run the same rating experiment with eye tracking and record where participants actually fixate during each five-second judgment. If fixations frequently leave the central 2.5-degree zone, or if recomputing zone weights from measured gaze shifts substantial weight beyond 4 degrees, then the reported fovea/parafovea dominance is an artifact of the fixation assumption rather than a property of retinal-zone perception.
Extended reading notes
Core claim
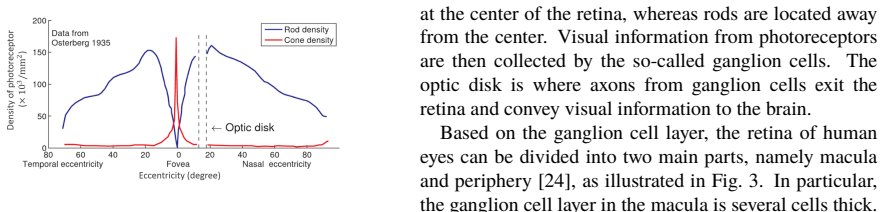
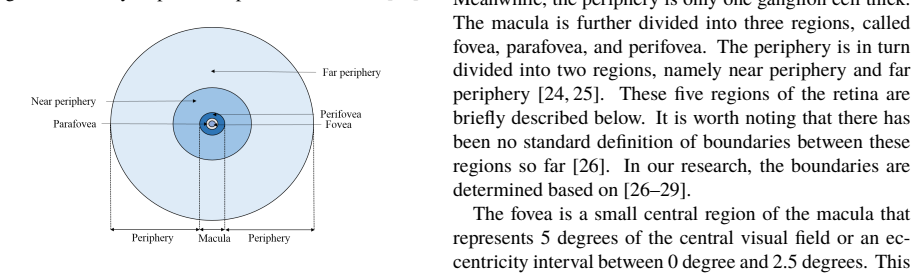
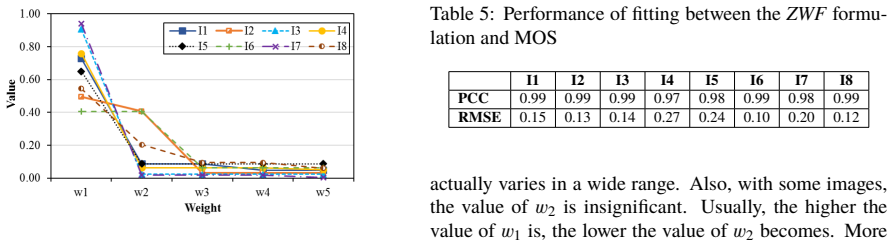
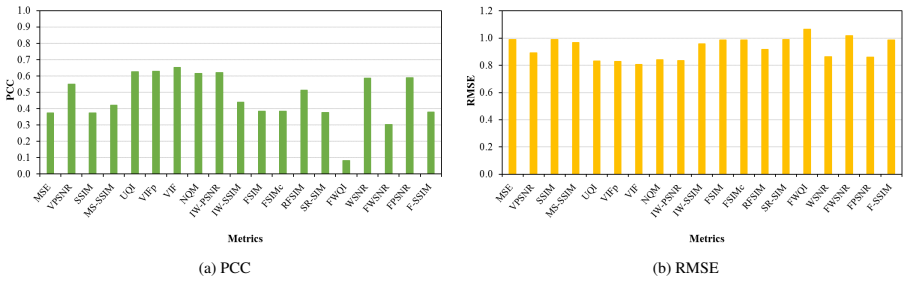
The central discovery is a quantitative map of where quality matters in an omnidirectional viewport. The authors asked 62 participants to rate stimuli whose five concentric zones—$Z_1$ $[0,2.5^\circ)$ fovea, $Z_2$ $[2.5^\circ,4^\circ)$ parafovea, $Z_3$ $[4^\circ,9^\circ)$ perifovea, $Z_4$ $[9^\circ,30^\circ)$ near periphery, and $Z_5$ $[30^\circ,\infty)$ far periphery—were either high or low quality in eight spatial patterns and four blur levels. Fitting weights $w_k$ in the zone-weighted formulation $\mathrm{ZWF}=10\log_{10}\left(\mathrm{MAX}^2/\sum_{k=1}^{5} w_k\,\mathrm{MSE}_k\right)$, with a five-parameter logistic mapping to MOS, gave per-image weights in which $w_1$ is usually the largest (0.404 to 0.941), the fovea-plus-parafovea share $w_1+w_2$ is at least 0.737 in every image, and all weights for zones beyond 4 degrees are at most 0.095. Pearson correlation between the fitted model and MOS is at least 0.97 per image and RMSE at most 0.27. The weights also vary with content: images with a small attractive central face put almost all weight in $Z_1$, while images with a large or poorly contrasting central object distribute weight between $Z_1$ and $Z_2$. On the same database, all nineteen tested objective quality metrics achieved PCC below 0.70 after logistic mapping, so none captured this non-uniform-quality perception.
Load-bearing premise
The load-bearing premise is that participants truly fixated the viewport center during each five-second rating and that the chosen retinal zone boundaries are accurate, so the fitted weights reflect retinal-zone importance rather than where people happened to look.
Editorial extensions
If this is right
- A foveated or viewport-adaptive 360-degree encoder can spend most of its bit budget on the central 4 degrees of the user's viewport and expect little perceived quality loss from blurring the periphery.
- Any objective quality metric for omnidirectional content with spatially varying quality should weight pixel errors by eccentricity, and likely by content-specific attention; unweighted viewport metrics will mispredict mean opinion scores.
- Perceived quality of non-uniform stimuli can be predicted with a simple weighted-MSE model rather than complex structural or foveal metrics, once per-image weights are known.
- Content characteristics—particularly the size and attractiveness of the central object and the presence of nearby objects—must enter the model, since fitted central-zone weights range from 0.404 to 0.941 across scenes.
Reading between the lines
- A testable extension of the paper's weighting machinery to gaze-tracked free viewing: the effective 'central region' should expand or shift toward salient objects, so fitted weights would track attended area rather than strict retinal anatomy.
- The paper's own caveat implies the numeric weight table is evidence for monotone central dominance, not exact anatomical constants, since the zone boundaries at 2.5, 4, 9, and 30 degrees are not standardized.
- Extrapolating to video, a streaming system could adapt per-tile quality to the current viewport center using the same per-image fitting procedure as a per-clip calibration step.
Signed reviews
Editorial analysis
A structured set of objections, weighed in public.
Referee Report
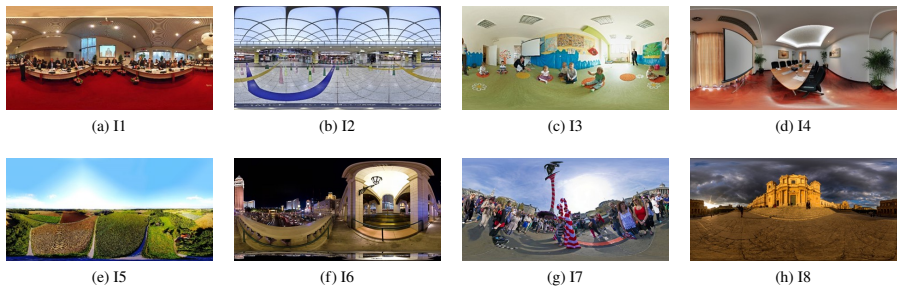
Summary. The paper studies how spatially non-uniform quality in omnidirectional images affects perceived quality, with the viewport divided into five retinal-zone-inspired concentric regions (fovea, parafovea, perifovea, near periphery, far periphery). A subjective experiment with 62 participants produced MOS scores for 256 stimuli (8 source images, 8 quality-variation patterns, 4 blur levels). The authors propose a zone-weighted formulation (ZWF) combined with a five-parameter logistic mapping, fit per image to the MOS data, yielding fitted zone weights w1...w5. They report that the foveal and parafoveal zones dominate perceived quality, that content characteristics modulate these weights, and that nineteen objective quality metrics, including foveal metrics, correlate poorly with the subjective scores. The paper also details the VR viewing geometry and retina region boundaries used to define the zones.
Significance. If the qualitative conclusion is correct, the paper provides useful evidence for foveated rendering and viewport-adaptive streaming of omnidirectional content, and the new subjective database is a resource for the community. The evaluation of nineteen objective metrics on non-uniform-quality omnidirectional content is also a contribution. However, the quantitative zone weights in Table 4 are the output of a fitting procedure with identifiability problems, and the paper's claim that the fitting is 'reliable' is based on in-sample correlation. The qualitative direction of the result is plausible and consistent with prior work, but the specific numerical claims about individual zone weights are not established by the current analysis.
major comments (1)
- [4.1-4.2, Tables 4-5] The interpretation of Table 4 as retinal-zone importance depends on the assumption that each participant maintained stable fixation at the viewport center throughout the rating, as described in Section 3. However, gaze was not tracked. The authors themselves note in Section 4.2 that for images I2 and I6, participants likely looked at a large central area rather than zone Z1 alone, which contradicts the fixed-foveation premise underlying Eqs. (11)-(12) that places the foveation point at the viewport center for all stimuli. If fixation drifted toward nearby attractive objects, the eccentricity assignments and hence the fitted weights in Table 4 are not valid measurements of retinal-zone importance. This is a load-bearing assumption for the paper's central claim and should be addressed, for example by reporting eye-tracking data or by softening the retinal-zone interpretation.
minor comments (5)
- [Eq. (11)] Equation (11) contains a typographical artifact ('vu√') before the square root; the formula should simply read d' = sqrt( ... ).
- [Section 2.2] The description of the fovea as 'represents 5 degrees of the central visual field or an eccentricity interval between 0 degree and 2.5 degrees' is geometrically correct but could be clarified by stating explicitly that 5 degrees is the full angular diameter and the zone is [0, 2.5) degrees of eccentricity.
- [Table 6] The descriptions of MSE and VPSNR are identical ('calculated based on visible pixels of a viewport with equal weights'); the distinction between raw mean squared error and peak-signal-to-noise ratio should be stated explicitly.
- [Section 5.1] For the metrics implemented by the authors (FWQI, FWSNR, FPSNR, F-SSIM), the text says they are based on the corresponding publications but does not provide implementation details or validation against the original authors' code; a brief note on verification would improve reproducibility.
- [Section 4.2] The claims linking the variation of w1 to the attractiveness and size of central objects are post hoc interpretations without quantitative support; consider presenting them as hypotheses rather than conclusions.
Circularity Check
No significant circularity: the zone weights are presented as fitted estimates from the subjective experiment, not as predictions derived from their own definition.
full rationale
The paper's central zone-importance claim is the output of a least-squares fit of the zone-weighted formulation (Eq. 17) and the logistic mapping (Eq. 18) to the collected MOS values. Reporting the fitted weights as quantified impacts is an empirical measurement, not a circular derivation: the conclusion is not an input to the model, and no equation is defined in terms of the claimed result. The high PCC and low RMSE are computed on the same data used for fitting, so the statement that the fit is 'reliable' is an in-sample validation weakness rather than a circular reduction. The retina zone boundaries and eccentricity geometry are taken from cited anatomical and optical sources, and the logistic mapping is supported by an independent standard reference [33] in addition to the authors' own prior work [22], so self-citation is not load-bearing. Concerns about unverified gaze fixation, non-standard zone boundaries, and under-identification of outer-zone weights are validity or identifiability threats, not circularity. No fitted parameter is relabeled as an independent prediction, and no self-citation is used to forbid alternative interpretations. Therefore, no circular step meeting the required standard is present.
Assumptions & free parameters
free parameters (3)
- Per-image zone weights w1..w5 =
Range w1: 0.404 (I6) to 0.941 (I7); w1+w2 >= 0.737; w3-w5 <= 0.095 (Table 4)
- Logistic mapping coefficients beta1..beta5 =
Not reported numerically
- Gaussian blur levels (sigma) =
S#1: 2, 4, 8, 12; S#2: 1, 2, 4, 6
assumptions (5)
- domain assumption Retina zone boundaries: fovea [0,2.5), parafovea [2.5,4), perifovea [4,9), near periphery [9,30), far periphery [30,+infinity) degrees
- domain assumption Participants kept gaze fixed at the viewport center during rating
- domain assumption Five-parameter logistic maps quality scores to MOS
- domain assumption Five-degree linear blending belts hide zone boundaries
- domain assumption Lens-equation geometry with F=62mm, S0=25mm, S2=10mm maps viewport pixels to eccentricity
Cite this review
Pith. "Pith review of Impacts of Retina-related Zones on Quality Perception of Omnidirectional Image." pith.science (2026). https://pith.science/paper/TOMKJUUW
@misc{pith2026190806239,
  author       = {Pith},
  title        = {Pith review of: Impacts of Retina-related Zones on Quality Perception of Omnidirectional Image},
  year         = {2026},
  howpublished = {\url{https://pith.science/paper/TOMKJUUW}},
  note         = {Machine review of arXiv:1908.06239}
}
read the original abstract
Virtual Reality (VR), which brings immersive experiences to viewers, has been gaining popularity in recent years. A key feature in VR systems is the use of omnidirectional content, which provides 360-degree views of scenes. In this work, we study the human quality perception of omnidirectional images, focusing on different zones surrounding the foveation point. For that purpose, an extensive subjective experiment is carried out to assess the perceptual quality of omnidirectional images with non-uniform quality. Through experimental results, the impacts of different zones are analyzed. Moreover, nineteen objective quality metrics, including foveal quality metrics, are evaluated using our database. It is quantitatively shown that the zones corresponding to the fovea and parafovea of human eyes are extremely important for quality perception, while the impacts of the other zones corresponding to the perifovea and periphery are small. Besides, the investigated metrics are found to be not effective enough to reflect the quality perceived by viewers.
Figures
Figures from the paper (6 more)


Reference graph
Works this paper leans on
-
[1]
A new adaptation approach for viewport-adaptive 360-degree video streaming,
D. V. Nguyen, H. T. Tran, A. T. Pham, and T. C. Thang, “A new adaptation approach for viewport-adaptive 360-degree video streaming,” in 2017 IEEE International Symposium on Multimedia (ISM), Taichung, Taiwan, Dec. 2017, pp. 38–44
work page 2017
-
[2]
Viewport-driven rate-distortion optimized 360o video streaming,
J.Chakareski,R.Aksu,X.Corbillon,G.Simon,and V. Swaminathan, “Viewport-driven rate-distortion optimized 360o video streaming,” in2018 IEEE In- ternational Conference on Communications (ICC) , Kansas City MO, USA, May 2018, pp. 1–7
work page 2018
-
[3]
Viewport- aware adaptive 360o video streaming using tiles for virtualreality,
C.Ozcinar,A.D.Abreu,andA.Smolic,“Viewport- aware adaptive 360o video streaming using tiles for virtualreality,”inIEEE International Conference on Image Processing, Beijing, China, Sept. 2017, pp. 2174–2178
work page 2017
-
[4]
An optimal tile-based approach for viewport-adaptive 360-degree video streaming,
D. V. Nguyen, H. T. T. Tran, A. T. Pham, and T. C. Thang, “An optimal tile-based approach for viewport-adaptive 360-degree video streaming,” IEEE Journal on Emerging and Selected Topics in Circuits and Systems, vol. 9, no. 1, pp. 29–42, Mar. 2019
work page 2019
-
[5]
B. Guenter, S. Drucker, D. Tan, and J. Snyder, “Foveated 3D Graphics,”ACM Transactions on Graphics, vol. 31, pp. 164:1–164:10, Nov. 2012. 12
work page 2012
-
[6]
La- tency requirements for foveated rendering in virtual reality,
R. Albert, A. Patney, D. Luebke, and J. Kim, “La- tency requirements for foveated rendering in virtual reality,”ACM Transactions on Applied Perception (TAP), vol. 14, no. 4, pp. 25:1–25:13, 2017
work page 2017
-
[7]
Perceptual Quality Assessment of Immersive Images Considering Peripheral Vision Impact
P. Guo, Q. Shen, Z. Ma, D. J. Brady, and Y. Wang, “Perceptual quality assessment of immersive im- agesconsideringperipheralvisionimpact.”[Online]. Available: http://arxiv.org/abs/1802.09065
-
[8]
Impact of delays on 360-degree video communi- cations,
D. V. Nguyen, H. T. T. Tran, and T. C. Thang, “Impact of delays on 360-degree video communi- cations,” in2017 TRON Symposium (TRONSHOW), Tokyo, Japan, Dec. 2017, pp. 1–6
work page 2017
Show all 43 references
-
[9]
Academic Press, Apr
J.BesharseandD.Bok, The Retina and Its Disorders. Academic Press, Apr. 2011
2011
-
[10]
Efficient im- plementation of foveation filtering,
S. Lee, A. C. Bovik, and B. L. Evans, “Efficient im- plementation of foveation filtering,” inProceedings of Texas Instruments DSP Educator’s Conference , 1999
1999
-
[11]
Subjective quality evaluation of foveated video coding using audio-visual focus of attention,
J. Lee, F. De Simone, and T. Ebrahimi, “Subjective quality evaluation of foveated video coding using audio-visual focus of attention,”IEEE Journal of Selected Topics in Signal Processing , vol. 5, no. 7, pp. 1322–1331, Nov. 2011
2011
-
[12]
Is foveated rendering perceiv- able in virtual reality?: Exploring the efficiency and consistency of quality assessment methods,
C.-F. Hsu, A. Chen, C.-H. Hsu, C.-Y. Huang, C.-L. Lei, and K.-T. Chen, “Is foveated rendering perceiv- able in virtual reality?: Exploring the efficiency and consistency of quality assessment methods,” inPro- ceedings of the 25th ACM International Conference on Multimedia, Mount...
2017
-
[13]
Perceptual quality assessment of omnidi- rectional images,
H. Duan, G. Zhai, X. Min, Y. Zhu, Y. Fang, and X. Yang, “Perceptual quality assessment of omnidi- rectional images,” in2018 IEEE International Sym- posium on Circuits and Systems (ISCAS) , Firenze Fiera Spa, Florence, Italy, May 2018, pp. 1–5
2018
-
[14]
Assessingvisualqualityofomnidirectionalvideos,
M. Xu, C. Li, Z. Chen, Z. Wang, and Z. Guan, “Assessingvisualqualityofomnidirectionalvideos,” IEEE Transactions on Circuits and Systems for Video Technology, vol. -, no. -, pp. 1–1, Dec. 2018
2018
-
[15]
Deepvirtualreal- ityimagequalityassessmentwithhumanperception guider for omnidirectional image,
H.G.Kim,H.Lim,andY.M.Ro,“Deepvirtualreal- ityimagequalityassessmentwithhumanperception guider for omnidirectional image,”IEEE Transac- tions on Circuits and Systems for Video Technology, vol. -, no. -, pp. 1–1, 2019
2019
-
[16]
Modelingtheperceptualqual- ity of immersive images rendered on head mounted displays: Resolutionandcompression,
M. Huang, Q. Shen, Z. Ma, A. C. Bovik, P. Gupta, R.Zhou,andX.Cao,“Modelingtheperceptualqual- ity of immersive images rendered on head mounted displays: Resolutionandcompression,”IEEE Trans- actions on Image Processing , vol. 27, no. 12, pp. 6039–6050, Dec. 2018
2018
-
[17]
Imagequalityassessment: Fromerrorvisibil- ity to structural similarity,
Z.Wang,A.C.Bovik,H.R.Sheikh,andE.P.Simon- celli,“Imagequalityassessment: Fromerrorvisibil- ity to structural similarity,”IEEE Transactions on Image Processing, vol. 13, no. 4, pp. 600–612, Apr. 2004
2004
-
[18]
Mul- tiscale structural similarity for image quality assess- ment,
Z. Wang, E. P. Simoncelli, and A. C. Bovik, “Mul- tiscale structural similarity for image quality assess- ment,” inThe Thrity-Seventh Asilomar Conference on Signals, Systems Computers , vol. 2, Nov. 2003, pp. 1398–1402
2003
-
[19]
Auniversalimagequality index,
Z.WangandA.C.Bovik,“Auniversalimagequality index,”IEEE Signal Processing Letters,vol.9,no.3, pp. 81–84, Mar. 2002
2002
-
[20]
Foveated video quality assessment,
S. Lee, M. S. Pattichis, and A. C. Bovik, “Foveated video quality assessment,”IEEE Transactions on Multimedia, vol. 4, no. 1, pp. 129–132, Mar. 2002
2002
-
[21]
Perceptually unequalpacketlossprotectionbyweightingsaliency and error propagation,
H.Ha,J.Park,S.Lee,andA.C.Bovik,“Perceptually unequalpacketlossprotectionbyweightingsaliency and error propagation,”IEEE Transactions on Cir- cuits and Systems for Video Technology , vol. 20, no. 9, pp. 1187–1199, Sep. 2010
2010
-
[22]
A study on quality metrics for 360videocommunications,
H. T. Tran, C. T. Pham, N. P. Ngoc, A. T. Pham, and T. C. Thang, “A study on quality metrics for 360videocommunications,”IEICE Transactions on Information and Systems, vol.101, no. 1, pp.28–36, 2018
2018
-
[23]
Zhaoping, Understanding Vision: Theory, Mod- els, and Data
L. Zhaoping, Understanding Vision: Theory, Mod- els, and Data. Oxford University Press, July 2014. 13
2014
-
[24]
Yanoff and J
M. Yanoff and J. S. Duker,Ophthalmology. Saun- ders, Nov. 2013
2013
-
[25]
Hendrickson, Organization of the Adult Primate Fovea
A. Hendrickson, Organization of the Adult Primate Fovea. Berlin,Heidelberg: SpringerBerlinHeidel- berg, 2005
2005
-
[26]
Pe- ripheral vision and pattern recognition: A review,
H. Strasburger, I. Rentschler, and M. Juttner, “Pe- ripheral vision and pattern recognition: A review,” Journal of Vision , vol. 11, no. 5, pp. 13–13, Dec. 2011
2011
-
[27]
Roberto,Intelligent Perceptual Systems: New Di- rections in Computational Perception
V. Roberto,Intelligent Perceptual Systems: New Di- rections in Computational Perception . Springer, Nov. 1993
1993
-
[28]
Light-differencethresh- old and subjective brightness in the periphery of thevisualfield,
E.PöppelandL.O.Harvey,“Light-differencethresh- old and subjective brightness in the periphery of thevisualfield,”Psychologische Forschung,vol.36, no. 2, pp. 145–161, 1973
1973
-
[29]
Peripheral stimulation and its effect on perceived spatial scale invirtualenvironments,
J. A. Jones, J. E. Swan II, and M. Bolas, “Peripheral stimulation and its effect on perceived spatial scale invirtualenvironments,”IEEE transactions on visu- alization and computer graphics, vol. 19, no. 4, pp. 701–710, 2013
2013
-
[30]
Recognizing scene viewpoint using panoramic place representation,
J. Xiao, K. A. Ehinger, A. Oliva, and A. Torralba, “Recognizing scene viewpoint using panoramic place representation,” inIEEE Conference on Com- puter Vision and Pattern Recognition (CVPR2012) , Providence, RI, USA, Jun. 2012
2012
-
[31]
SUN360 Panorama Database
P. vision group, “SUN360 Panorama Database.” [Online]. Available: https://vision.princeton.edu/projects/2012/SUN360/data/
2012
-
[32]
Methods for the subjectiveassessmentofvideoquality,audioquality and audiovisual quality of Internet video and distri- bution quality television in any environment,
Recommendation ITU-T P.913, “Methods for the subjectiveassessmentofvideoquality,audioquality and audiovisual quality of Internet video and distri- bution quality television in any environment,”Inter- national Telecommunication Union, 2014
2014
-
[33]
A statistical evaluation of recent full reference image quality assessment algorithms,
H. R. Sheikh, M. F. Sabir, and A. C. Bovik, “A statistical evaluation of recent full reference image quality assessment algorithms,”IEEE Transactions on image processing,vol.15,no.11,pp.3440–3451, 2006
2006
-
[34]
Q-STAR:Aperceptual video quality model considering impact of spatial, temporal, and amplitude resolutions,
Y.Ou,Y.Xue,andY.Wang,“Q-STAR:Aperceptual video quality model considering impact of spatial, temporal, and amplitude resolutions,”IEEE Trans- actions Image Processing, vol. 23, no. 6, pp. 2473– 2486, June 2014
2014
-
[35]
Image informa- tionandvisualquality,
H. R. Sheikh and A. C. Bovik, “Image informa- tionandvisualquality,”IEEE Transactions on Image Processing, vol. 15, no. 2, pp. 430–444, Feb. 2006
2006
-
[36]
Image quality assessment based on a degradation model,
N. Damera-Venkata, T. D. Kite, W. S. Geisler, B. L. Evans, and A. C. Bovik, “Image quality assessment based on a degradation model,”IEEE Transactions on Image Processing,vol.9,no.4,pp.636–650,Apr. 2000
2000
-
[37]
Information content weight- ing for perceptual image quality assessment,
Z. Wang and Q. Li, “Information content weight- ing for perceptual image quality assessment,”IEEE Transactions on Image Processing,vol.20,no.5,pp. 1185–1198, May 2011
2011
-
[38]
Fsim: A feature similarity index for image quality assess- ment,
L. Zhang, L. Zhang, X. Mou, and D. Zhang, “Fsim: A feature similarity index for image quality assess- ment,”IEEE Transactions on Image Processing , vol. 20, no. 8, pp. 2378–2386, Aug. 2011
2011
-
[39]
Rfsim: A feature based image quality assessment metric using riesz transforms,
L. Zhang, L. Zhang, and X. Mou, “Rfsim: A feature based image quality assessment metric using riesz transforms,”in2010 IEEE International Conference on Image Processing, Sep. 2010, pp. 321–324
2010
-
[40]
Sr-sim: A fast and high per- formance iqa index based on spectral residual,
L. Zhang and H. Li, “Sr-sim: A fast and high per- formance iqa index based on spectral residual,” in 2012 19th IEEE International Conference on Image Processing, Sep. 2012, pp. 1473–1476
2012
-
[41]
Foveated wavelet image quality index,
Z. Wang, A. C. Bovik, L. Lu, and J. L. Kouloheris, “Foveated wavelet image quality index,” in46th An- nual Meeting, Proceedings SPIE, Application of Dig- ital Image Processing, Jul. 2001
2001
-
[42]
Foveatedvideoimageanal- ysis and compression gain measurements,
S.LeeandA.C.Bovik,“Foveatedvideoimageanal- ysis and compression gain measurements,” in4th IEEE Southwest Symposium on Image Analysis and Interpretation, Apr. 2000, pp. 63–67
2000
-
[43]
Available: https://jvet.hhi.fraunhofer.de/svn/svn_360Lib/tags/360Lib- 2.0.1/ 14
Joint Video Exploration Team, “360Lib.” [Online]. Available: https://jvet.hhi.fraunhofer.de/svn/svn_360Lib/tags/360Lib- 2.0.1/ 14
Reviewed August 14, 2026 · model on record in the stance chip above.
Discussion (0). Continue with ORCID to comment.