Virginia Tech Transportation Safety Index (VTTSI)
Pith reviewed 2026-06-26 12:55 UTC · model grok-4.3
The pith
VTTSI produces 0-100 safety scores for intersections every 15 minutes by fusing long-term crash data with real-time speed and conflict telemetry.
A machine-rendered reading of the paper's core claim, the machinery that carries it, and where it could break.
Core claim
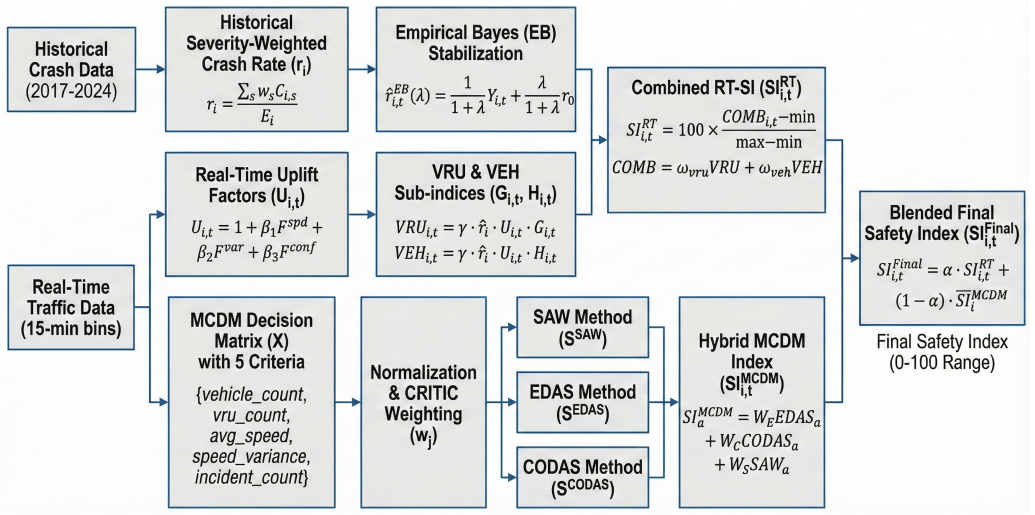
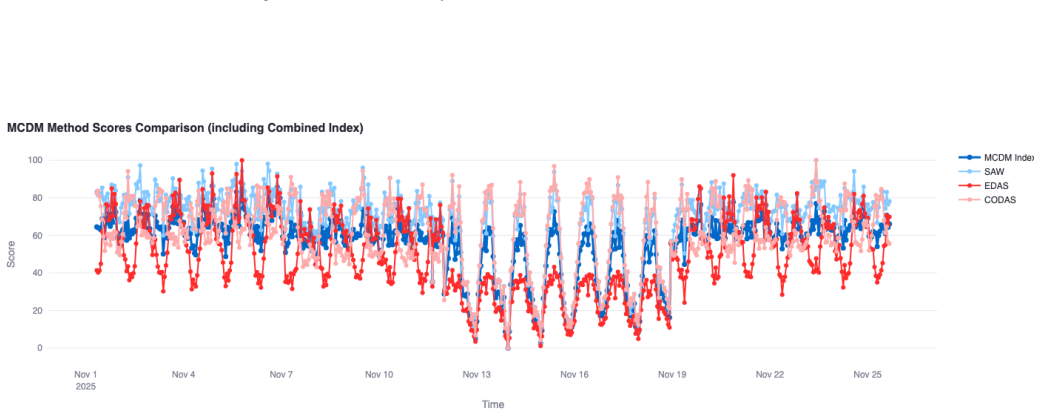
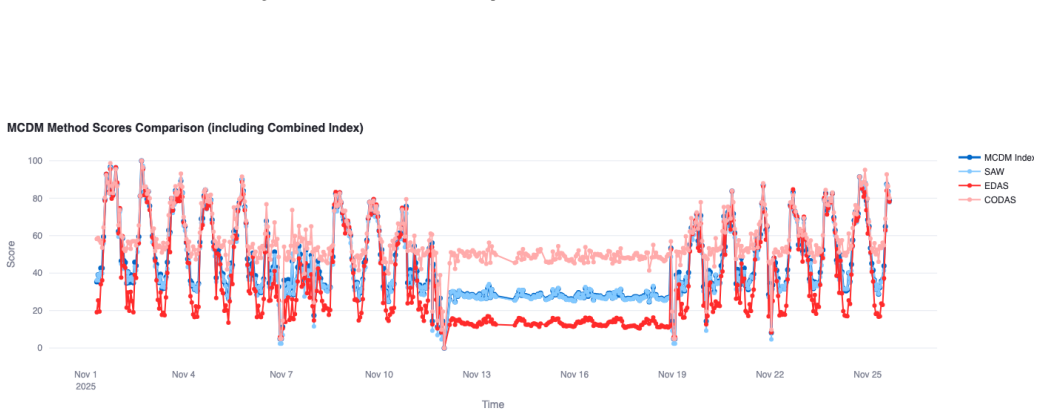
The Virginia Tech Transportation Safety Index integrates Empirical Bayes crash stabilization with uplift factors derived from speed and conflict behavior, processed through a CRITIC-weighted multi-criteria decision-making module that combines SAW, EDAS, and CODAS, to deliver interpretable, exposure-adjusted safety scores on a 0-100 scale every 15 minutes from multimodal connected-vehicle telemetry and multi-year crash history.
What carries the argument
Hybrid modeling approach that fuses Empirical Bayes crash stabilization, uplift factors derived from speed and conflict behavior, and a CRITIC-weighted multi-criteria decision-making module combining SAW, EDAS, and CODAS.
If this is right
- Scores reflect both long-term crash risk and short-term behavioral dynamics at each update interval.
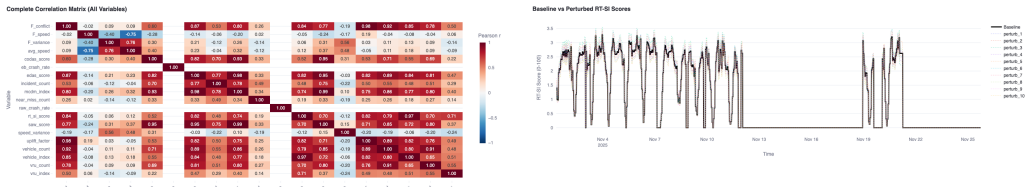
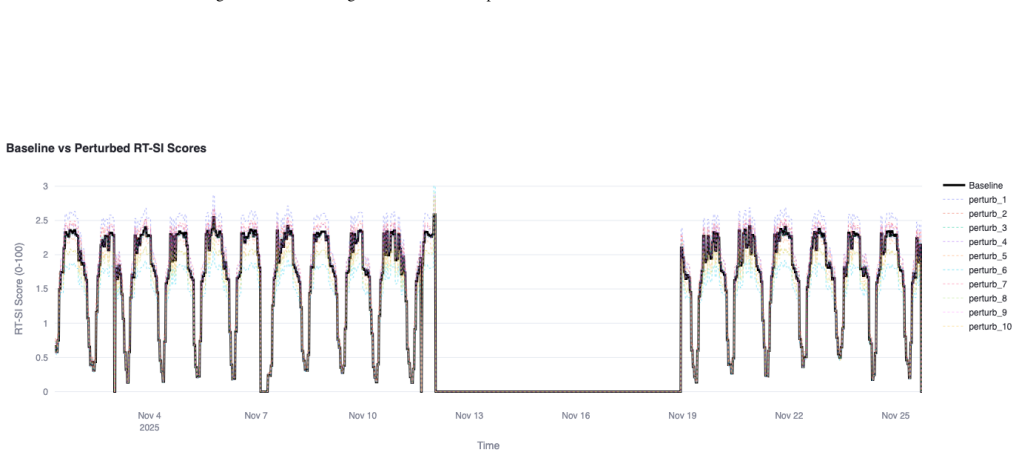
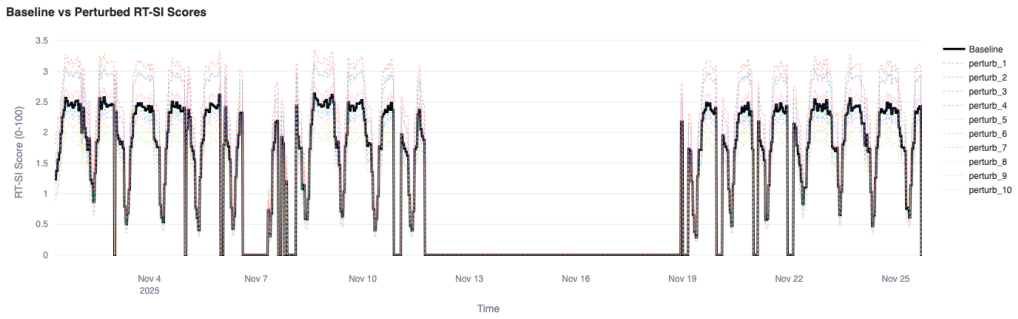
- Validation across sites shows coherent diurnal patterns, consistency among the MCDM methods, and sensitivity to operational turbulence.
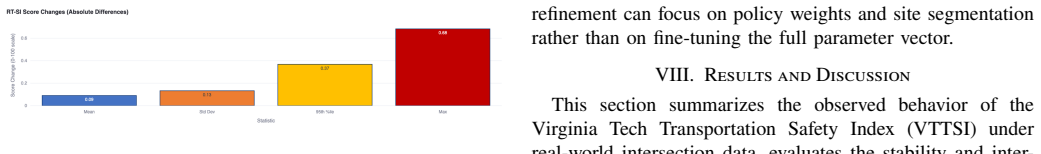
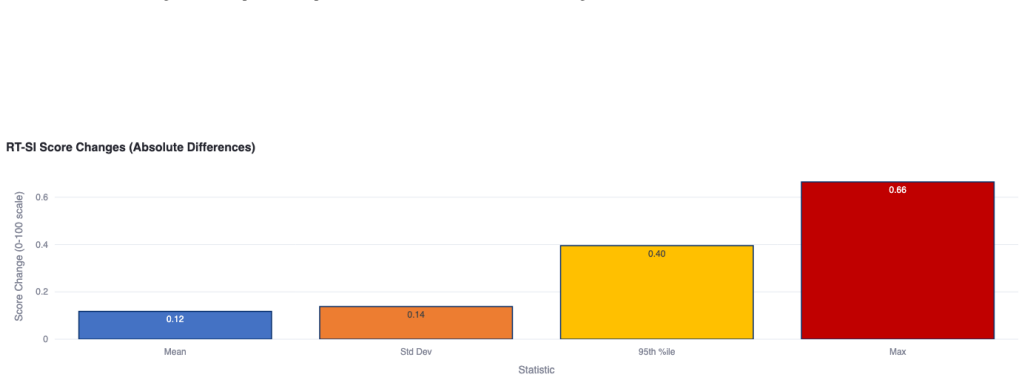
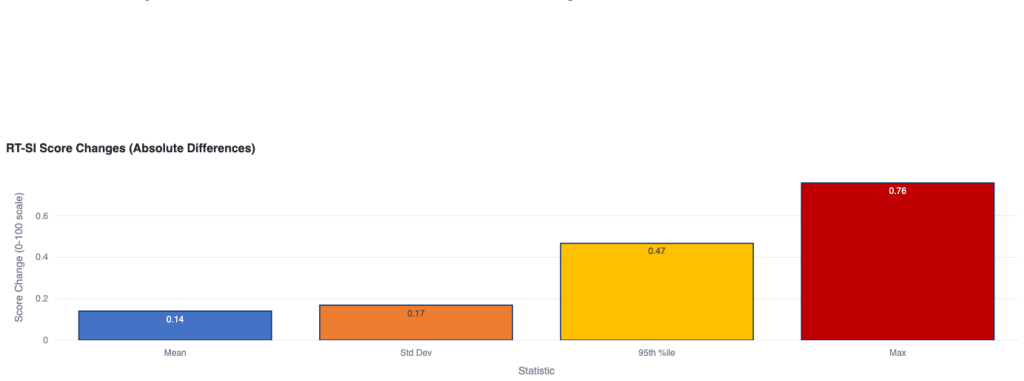
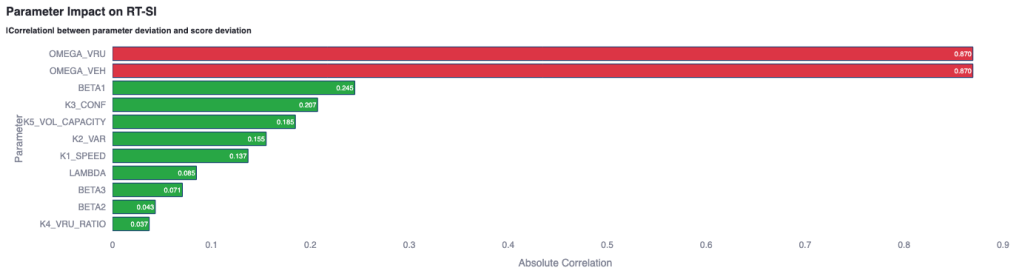
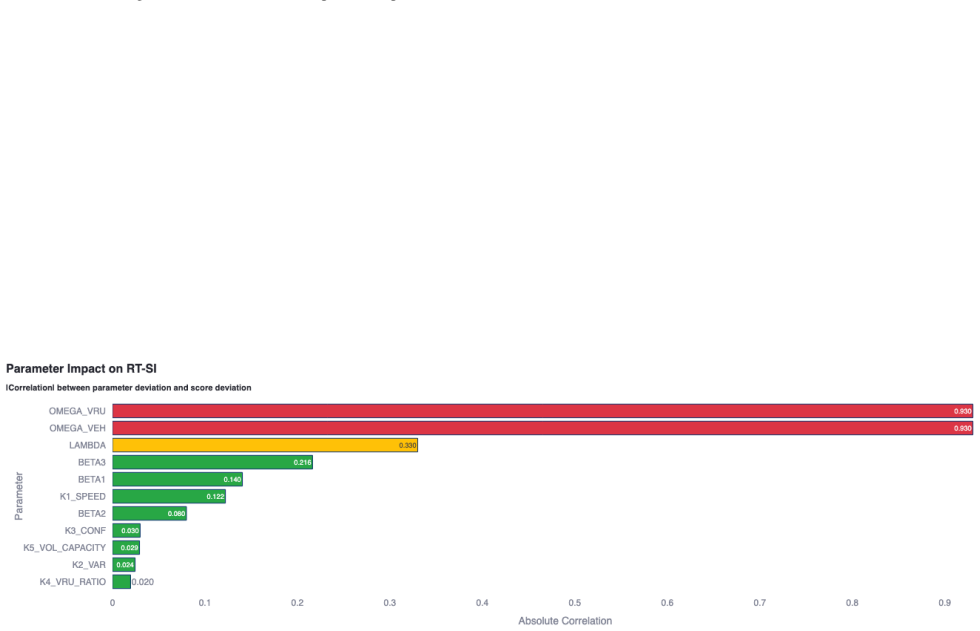
- Sensitivity analysis indicates the index remains stable, with typical deviations below one point on the 0-100 scale under parameter changes.
- The framework supports use by transportation agencies, traffic management centers, fleet operators, and autonomous vehicle systems through cloud visualization.
Where Pith is reading between the lines
- The 15-minute update cycle could allow traffic signals or variable message signs to respond directly to rising risk levels.
- Extension to non-intersection segments would require only modest changes to the exposure and conflict detection layers.
- Comparing VTTSI outputs against purely surrogate-safety indices over the same sites would quantify the contribution of the crash-stabilization component.
- Deployment across additional cities with different crash-reporting practices would test whether the uplift factors transfer without retraining.
Load-bearing premise
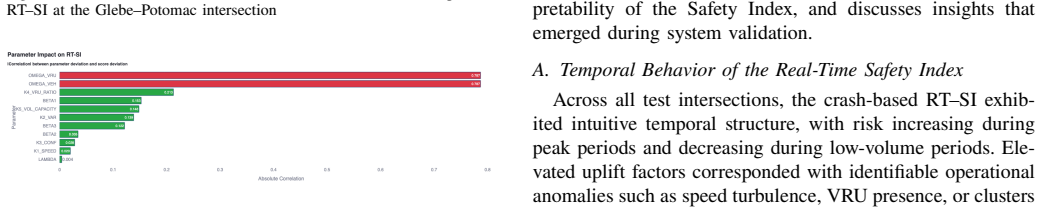
Uplift factors derived from speed and conflict behavior, when combined via CRITIC-weighted MCDM, accurately capture rapidly changing operational conditions beyond what lagged crash data already provide.
What would settle it
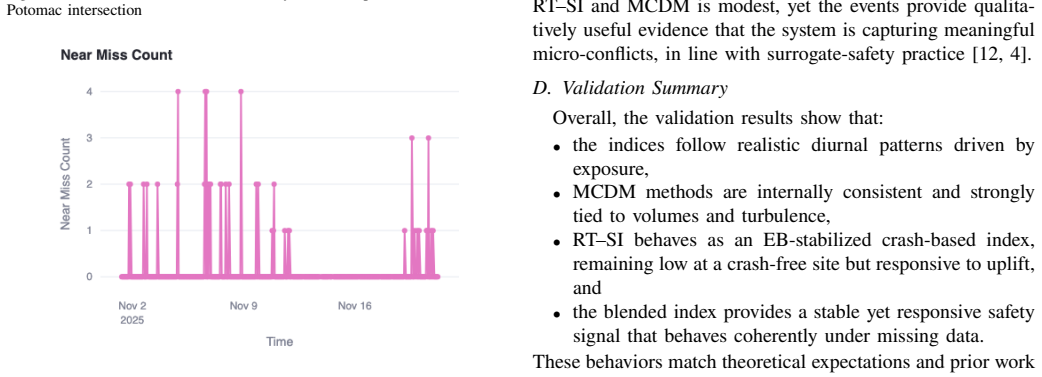
If real-time 0-100 scores show no measurable correlation with observed near-miss rates or incident spikes during periods of elevated speed variance or conflict activity, the hybrid method would fail to demonstrate added value over crash history alone.
Figures
read the original abstract
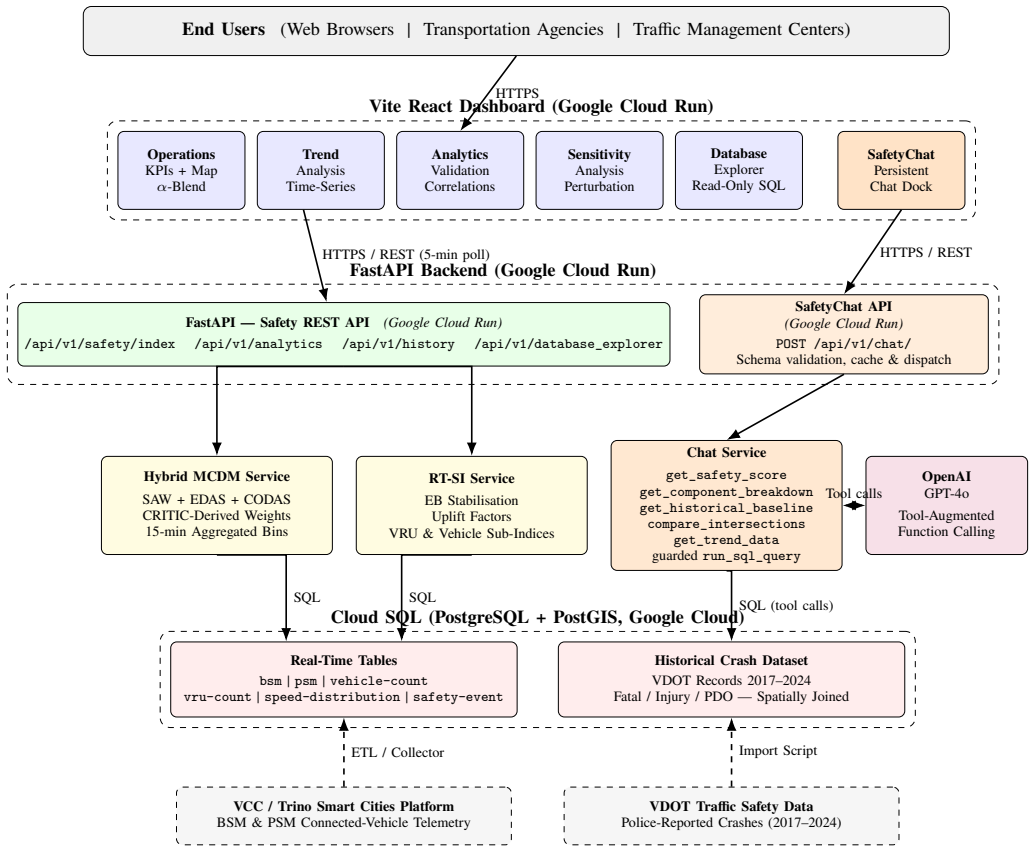
The Virginia Tech Transportation Safety Index (VTTSI) is a real-time, cloud-native framework for quantifying intersection safety using multimodal connected-vehicle telemetry and multi-year VDOT crash history. Traditional crash-based methods rely on lagged, aggregated data and cannot reflect rapidly changing operational conditions. VTTSI addresses this gap through a hybrid modeling approach that fuses Empirical Bayes (EB) crash stabilization, uplift factors derived from speed and conflict behavior, and a CRITIC-weighted multi-criteria decision-making (MCDM) module combining SAW, EDAS, and CODAS. The system produces interpretable, exposure-adjusted safety scores on a 0--100 scale every 15 minutes. A cloud-deployed architecture built on FastAPI, PostgreSQL, PostGIS, and Streamlit supports interactive visualization of traffic volumes, VRU exposure, speed variance, and real-time incident activity. Validation across intersections demonstrates coherent diurnal patterns, consistency among MCDM methods, and sensitivity to observable operational turbulence. Sensitivity analysis further shows that the RT--SI is robust to parameter perturbations, with deviations typically remaining below one point on the 0--100 scale. By integrating long-term crash risk with short-term behavioral dynamics, VTTSI provides a transparent, adaptive, and proactive safety-monitoring framework suitable for transportation agencies, traffic management centers, fleet operators, and autonomous vehicle systems.%~\cite{persaud2007, montella2020systemic, schultz2025_surrogate, Amraji2025CombinedSafetyIndex}.
Editorial analysis
A structured set of objections, weighed in public.
Referee Report
Summary. The manuscript presents the Virginia Tech Transportation Safety Index (VTTSI), a cloud-native framework that generates real-time (every 15 minutes) exposure-adjusted intersection safety scores on a 0-100 scale. It fuses Empirical Bayes (EB) crash stabilization with uplift factors derived from speed and conflict behavior, combined via CRITIC-weighted multi-criteria decision-making (MCDM) methods (SAW, EDAS, CODAS). The system is implemented with FastAPI, PostgreSQL, PostGIS, and Streamlit for visualization, and validation shows coherent diurnal patterns, MCDM consistency, sensitivity to operational turbulence, and robustness to parameter changes (deviations typically <1 point).
Significance. If the hybrid model can be shown to add predictive value beyond EB alone, VTTSI would provide a transparent, proactive tool for real-time safety monitoring that integrates long-term crash risk with short-term behavioral dynamics, with potential utility for agencies, traffic centers, and AV systems.
major comments (1)
- [Validation] Validation description (abstract and results): The reported checks (coherent diurnal patterns, MCDM consistency, sensitivity to turbulence, parameter robustness <1 point) are internal consistency tests only. No quantitative out-of-sample comparison is provided demonstrating that the hybrid model (EB + uplift factors via CRITIC-MCDM) outperforms an EB-only baseline on held-out crash data or other external criterion. This is load-bearing for the central claim that uplift factors capture rapidly changing conditions beyond lagged crash data.
minor comments (1)
- [Abstract] Abstract: The final sentence contains a LaTeX citation remnant ('%~\cite{persaud2007, montella2020systemic, ...}') that should be removed or properly formatted.
Simulated Author's Rebuttal
We thank the referee for the detailed review and constructive feedback on the VTTSI manuscript. We address the single major comment below and outline planned revisions to strengthen the validation section.
read point-by-point responses
-
Referee: Validation description (abstract and results): The reported checks (coherent diurnal patterns, MCDM consistency, sensitivity to turbulence, parameter robustness <1 point) are internal consistency tests only. No quantitative out-of-sample comparison is provided demonstrating that the hybrid model (EB + uplift factors via CRITIC-MCDM) outperforms an EB-only baseline on held-out crash data or other external criterion. This is load-bearing for the central claim that uplift factors capture rapidly changing conditions beyond lagged crash data.
Authors: We agree that the current validation emphasizes internal consistency, sensitivity to operational turbulence, and parameter robustness rather than a direct quantitative out-of-sample comparison of predictive performance against an EB-only baseline on held-out crash data. The hybrid design is motivated by the need to integrate short-term behavioral signals (speed variance and conflicts) that historical crash data alone cannot reflect in real time; however, we acknowledge that demonstrating incremental predictive value on an external criterion would provide stronger support for this claim. In the revised manuscript we will add a dedicated subsection performing such a comparison where data permits (e.g., using temporal or spatial hold-outs of recent crash records) or, if data constraints limit direct comparison, will explicitly discuss this limitation and its implications for the framework's claims. revision: yes
Circularity Check
No significant circularity detected in derivation chain
full rationale
The paper's hybrid approach fuses established Empirical Bayes crash stabilization with uplift factors computed from speed and conflict telemetry plus standard CRITIC-weighted MCDM (SAW/EDAS/CODAS) to produce 15-minute safety scores. No equations, parameter-fitting steps, or self-citation chains are shown that reduce the final index to its own inputs by construction (e.g., no case of fitting uplift factors to crash data then claiming the same factors as an independent prediction). Validation consists of internal consistency checks rather than external benchmarks, but the central modeling claim retains independent content from the fusion of lagged crash data with real-time behavioral signals. No load-bearing self-citations or ansatzes smuggled via prior work appear in the provided text.
Axiom & Free-Parameter Ledger
Reference graph
Works this paper leans on
-
[1]
Sidey-Gibbons, Charlotte Sun, Alina Schneider, et al
Ahmed Almutairi et al. “Deep Learning Based Pre- dictive Models for Real-Time Accident Prevention in Autonomous Vehicle Networks”. In:Scientific Reports 15.1 (2025), p. 20844.doi: 10.1038/s41598- 025- 04867-8.url: https://doi.org/10.1038/s41598-025- 04867-8
-
[2]
Combined Safety Index Using CRITIC Weighting
A. Amraji. “Combined Safety Index Using CRITIC Weighting”. In:Journal of Transportation Research 15.2 (2025), pp. 200–210
2025
-
[3]
Jason Cusati.Agentic Knowledge Graphs for Traffic Safety. Tech. rep. Unpublished manuscript. Virginia Tech, 2025
2025
-
[4]
FHWA, 2003
Douglas Gettman and Larry Head.Surrogate Safety As- sessmentModelandValidation:FinalReport.Tech.rep. FHWA, 2003
2003
-
[5]
High- way Crash Detection and Risk Estimation Using Deep Learning
Tingting Huang, Shuo Wang, and Anuj Sharma. “High- way Crash Detection and Risk Estimation Using Deep Learning”. In:Accident Analysis & Prevention135 (2020), p. 105392.doi: 10.1016/j.aap.2019.105392
-
[6]
A New Combina- tive Distance-Based Assessment (CODAS) Method for Multi-Criteria Decision-Making
Mehdi Keshavarz-Ghorabaee et al. “A New Combina- tive Distance-Based Assessment (CODAS) Method for Multi-Criteria Decision-Making”. In:Economic Com- putation and Economic Cybernetics Studies and Re- search50 (2016), pp. 25–44
2016
-
[7]
Mehdi Keshavarz-Ghorabaee et al. “Multi-Criteria In- ventory Classification Using a New Method of Eval- uation Based on Distance from Average Solution (EDAS)”. In:Informatica26 (2015), pp. 435–451.doi: 10.15388/Informatica.2015.57
-
[8]
Alfonso Montella et al. “Systemic Approach to Improve Safety of Urban Unsignalized Intersections: Develop- ment and Validation of a Safety Index”. In:Accident Analysis & Prevention141 (2020), p. 105523.doi: 10. 1016/j.aap.2020.105523
arXiv 2020
-
[9]
IoT-Enabled Adaptive Traffic Management: A Multiagent Framework for Urban Mo- bility Optimisation
Iqbal Mutambik et al. “IoT-Enabled Adaptive Traffic Management: A Multiagent Framework for Urban Mo- bility Optimisation”. In:Sensors25.13 (2025), p. 4126. doi: 10.3390/s25134126
-
[10]
Bhagwant Persaud and Craig Lyon. “Empirical Bayes Before–After Safety Studies: Lessons Learned from Two Decades of Experience and Future Directions”. In: Accident Analysis & Prevention39.3 (2007), pp. 546– 555.doi: 10.1016/j.aap.2006.09.009
-
[11]
Assessing the Safety Effect Through Google Maps Usage: FMEA Approach (Case Study: Indonesia)
A. F. D. Pribadi, A. D. Oktaviani, and A. S. Utomo. “Assessing the Safety Effect Through Google Maps Usage: FMEA Approach (Case Study: Indonesia)”. In: Case Studies on Transport Policy10.1 (2022), pp. 42– 53
2022
-
[12]
A Study on Surrogate Safety Indicators
John Schultz. “A Study on Surrogate Safety Indicators”. In:Journal of Transportation Safety. Vol. 12. 3. 2025, pp. 123–134
2025
-
[13]
A High-Resolution Trajectory Data Driven Method for Real-Time Evaluation of Traffic Safety
Y. Wang et al. “A High-Resolution Trajectory Data Driven Method for Real-Time Evaluation of Traffic Safety”. In:Accident Analysis & Prevention160 (2021), p. 106323
2021
-
[14]
Evaluating the Use of Google Maps as Navigation Application by Identifying Hazards and Assessing Risks Using HIRA Matrix
S. H. Wicaksono, A. Nugroho, and R. R. R. Putra. “Evaluating the Use of Google Maps as Navigation Application by Identifying Hazards and Assessing Risks Using HIRA Matrix”. In: 1064.1 (2022), p. 012020
2022
-
[15]
Dynamic Spatiotemporal Graph Network for Traffic Accident Risk Predic- tion
Pengcheng Zhang et al. “Dynamic Spatiotemporal Graph Network for Traffic Accident Risk Predic- tion”. In:GIScience & Remote Sensing62.1 (2025), p. 2514330.doi: 10.1080/15481603.2025.2514330. url: https://doi.org/10.1080/15481603.2025.2514330. Appendix A Backend Service Descriptions TABLE II Core Backend Services Service Description MCDM Safety In- dex Ser...
-
[16]
We adopt fixed policy- driven weights: wfatal = 10, w injury = 3, w PDO = 1, which match the implementation used to build severity- weighted crash counts
Severity Weightsws:Severity weighting is applied only in the historical crash-rate computation. We adopt fixed policy- driven weights: wfatal = 10, w injury = 3, w PDO = 1, which match the implementation used to build severity- weighted crash counts
-
[17]
A grid search overλ∈{0.1,...,100000} minimizes Poisson negative log-likelihood when predicting 2025 outcomes
Empirical Bayes Shrinkage Parameterλ:The historical crash rate for a 15-minute bin is stabilized using a no-exposure Empirical Bayes (EB) estimator: ˆri = Yi +λr0 1 +λ, whereYi is the severity-weighted crash count in bini,r0 is the pooled mean over 2017–2024, andλis selected using temporal cross-validation. A grid search overλ∈{0.1,...,100000} minimizes P...
2017
-
[18]
a) Speed deficit uplift.:LetFFSdenote the free-flow speed andvthe observed mean speed: Fspeed = min ( 1,1.5 FFS−v FFS )
Real-Time Uplift Factors(Fspeed,Fvar,Fconf):The real- time Safety Index multiplies the EB baseline by three bounded uplift factors derived from speed, turbulence, and VRU– vehicle conflict exposure. a) Speed deficit uplift.:LetFFSdenote the free-flow speed andvthe observed mean speed: Fspeed = min ( 1,1.5 FFS−v FFS ) . b) Speedvarianceuplift.:Letσ 2 bethe...
-
[19]
These values are policy parameters, not learned
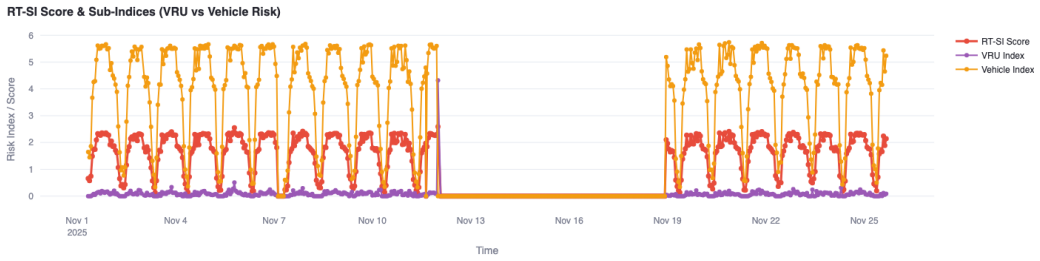
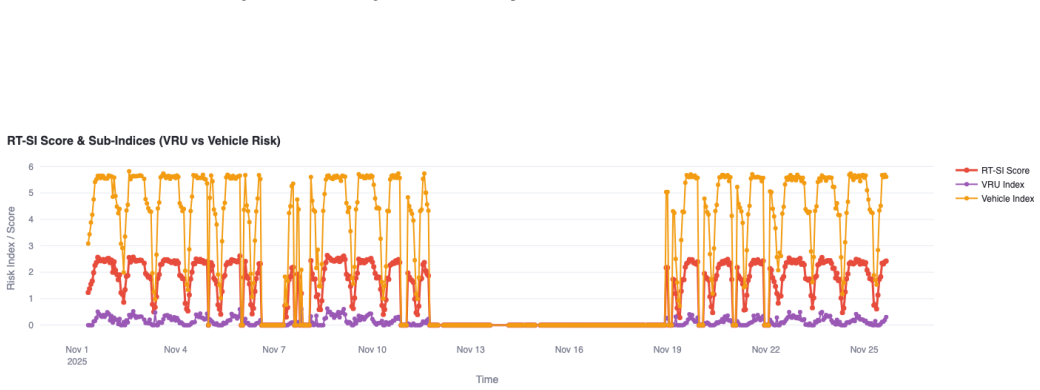
VRU–Vehicle Index Blendω:The real-time index blends VRU-specific and vehicle-specific sub-indices using fixed weights: SIRT = 0.6 SIVRU + 0.4 SIVEH. These values are policy parameters, not learned
-
[20]
MCDM Criterion Weightswj (CRITIC Only):For the MCDM component, each 15-minute intersection–time pair is treated as an alternative, and the following five real-time criteria form the decision matrix: C={vehicle_count,vru_count,avg_speed, speed_variance,incident_count}. (43) After min–max normalization, CRITIC weighting is ap- plied: Cj =σj ∑ k (1−ρjk), w j...
-
[21]
Method weights are recalculated dynamically for each evalu- ation window
Hybrid Method WeightsWE,WC,WS (CRITIC Again): After computing SAW, EDAS, and CODAS scores (all nor- malized to[0,100]), these three method outputs form a matrix M= [EDAS a,CODAS a,SAW a], from which CRITIC weights are again derived: Wj = σj ∑ k(1−ρjk)∑ jσj ∑ k(1−ρjk), j∈{EDAS,CODAS,SAW}. Method weights are recalculated dynamically for each evalu- ation wi...
-
[22]
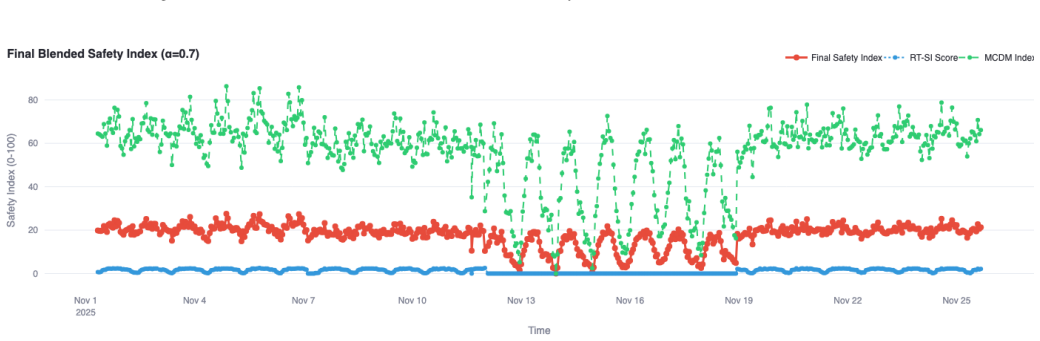
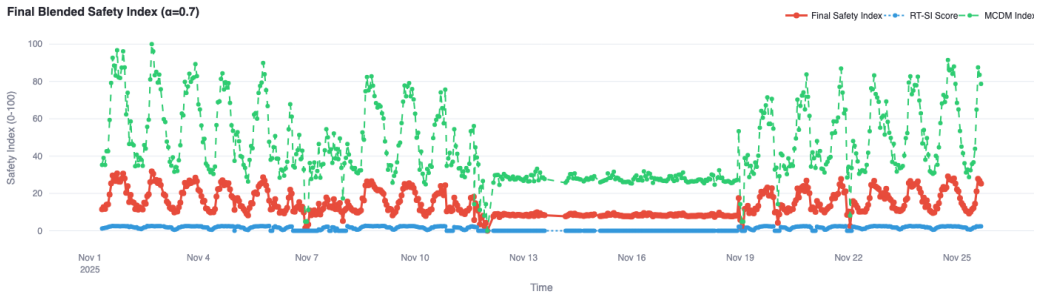
(42),SIFinal i,t =αSIRT i,t + (1−α)SI MCDM i
Final Blend:The released backend computes both the real-time (RT–SI) and MCDM indices and combines them into the blended Final Safety Index of Eq. (42),SIFinal i,t =αSIRT i,t + (1−α)SI MCDM i . The blend coefficient defaults toα= 0.7and is exposed both as a request parameter on the safety-index API endpoint and as an interactive slider in the Streamlit fr...
-
[23]
Cross-Validation:Only the Empirical Bayes shrinkage parameterλuses temporal cross-validation:
-
[24]
Use 2017–2024 severity-weighted crash counts as train- ing data
2017
-
[25]
Compute pooled meanr 0
-
[26]
b) Predict 2025 counts
For eachλin a predefined grid: a) Compute EB-stabilized rates for training years. b) Predict 2025 counts. c) Compute Poisson log-loss
2025
-
[27]
Weights for uplift factors, VRU–vehicle blending, and MCDM are not tuned via cross-validation
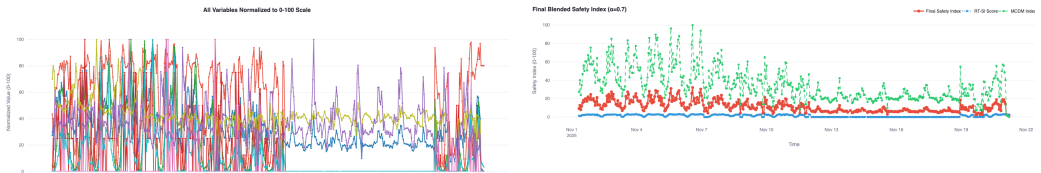
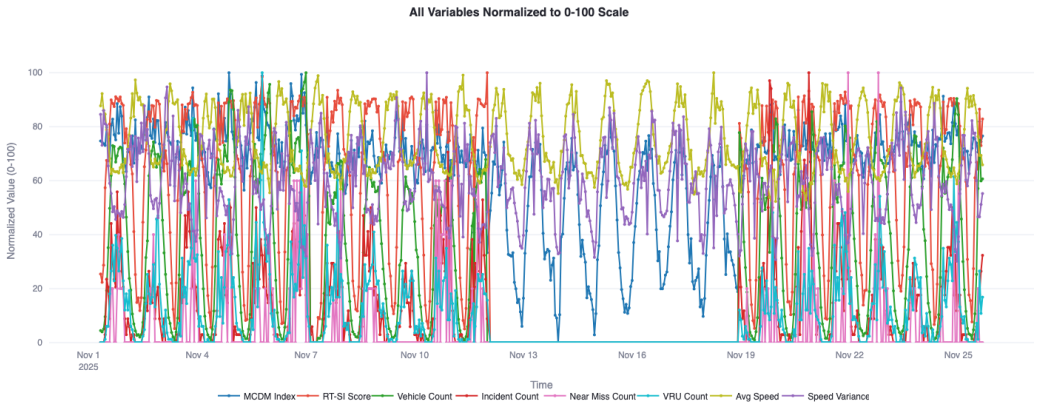
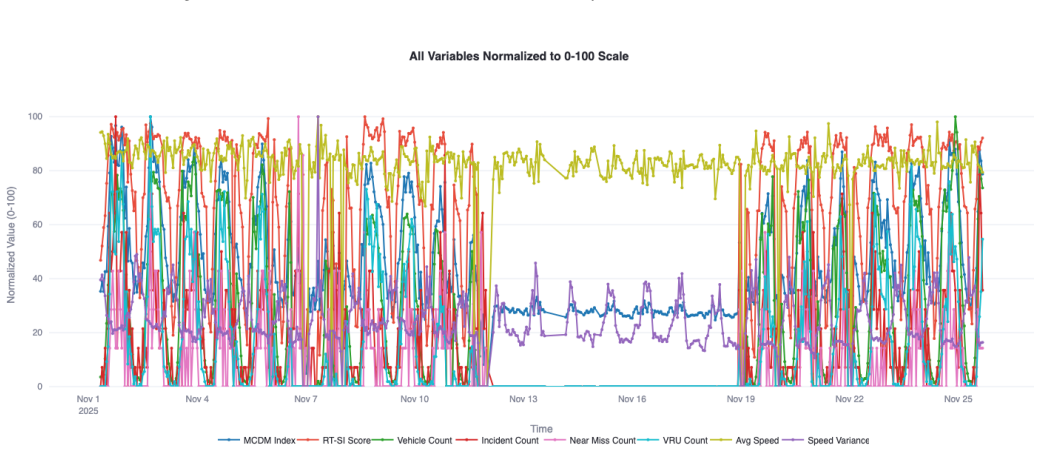
Selectλ⋆minimizing log-loss; hardcode into real-time service. Weights for uplift factors, VRU–vehicle blending, and MCDM are not tuned via cross-validation. Validation additional images from other intersection Results for Birch and Broad intersections exhibit the same behavior and are included in Appendix figures. Figure 12 and figure 13 are all variables...
discussion (0)
Sign in with ORCID, Apple, or X to comment. Anyone can read and Pith papers without signing in.