REVIEW 3 major objections 5 minor 39 references
Quantifying Injection-Driven Interphase Mass Transfer within Porous Media via Time-Elapsed X-ray micro-Computed Tomography
T0 review · 3 major / 5 minor · reviewed 2026-08-02 · deepseek-v4-flash
Pith's one-line read Three frameworks that estimate gas-dissolution mass transfer from time-lapsed X-ray micro-CT scans agree within one order of magnitude on mass-transfer coefficients at every injection rate, but diverge sharply on pore-scale concentration.
desk verdict The three-way SAC/NPC/CPC comparison is genuinely new and useful, but the SAC values appear to come from the original study rather than the same filtered, three-phase processing, so the 'same data' claim needs fixing before the central comparison can be trusted as stated. read the letter →
The pith
A machine-rendered reading of the paper's core claim, the machinery that carries it, and where it could break.
The reading
What carries the argument
The load-bearing machinery is the thin-film relation dm_g/dt = -kA(C_sol - C_g), which all three frameworks solve for k from imaged cluster volume changes, differing in how they supply C_g and A and which clusters they count. SAC reduces the system to a 1-D advection equation and iteratively computes slice-averaged concentration, diluting dissolved mass over each cross-section. NPC applies k = -(ΔV_g/Δt)ρ_gas/(A·C_sol) to every cluster volume change under a maximum-gradient assumption; CPC applies the same formula only to clusters classified as completely or partially dissolved, presumed to sit at the dissolution front. The paper's new device is a mobilization filter excluding time-intervals
What would settle it
Measure the true dissolution flux directly during identical injection runs — via effluent solute concentration, gravimetric gas loss, or a mass balance over the imaged volume — and check whether the three frameworks' filtered coefficients bracket it; and, on the same datasets, recompute the sequence averages at mobilization thresholds of 0.1, 0.3, 0.5, and 1.0 to see whether the cross-approach agreement survives the choice of cutoff.
Extended reading notes
Core claim
At a given solvent injection rate, the SAC, NPC, and CPC frameworks estimate average mass-transfer coefficients within one order of magnitude of each other, and all three rise with injection rate. The same datasets yield divergent pore-scale solute concentrations: SAC dilutes them by assuming radial uniformity; NPC, applying the maximum-gradient equation to every cluster change, produces values outside physical bounds (0 ≤ C_i/C_sol ≤ 1); and CPC returns negative concentrations at the leading edge of the dissolution front, which the authors read as evidence that the sequence-average coefficient underestimates front mass transfer. System-scale agreement reflects large sample pools; pore-scale
Load-bearing premise
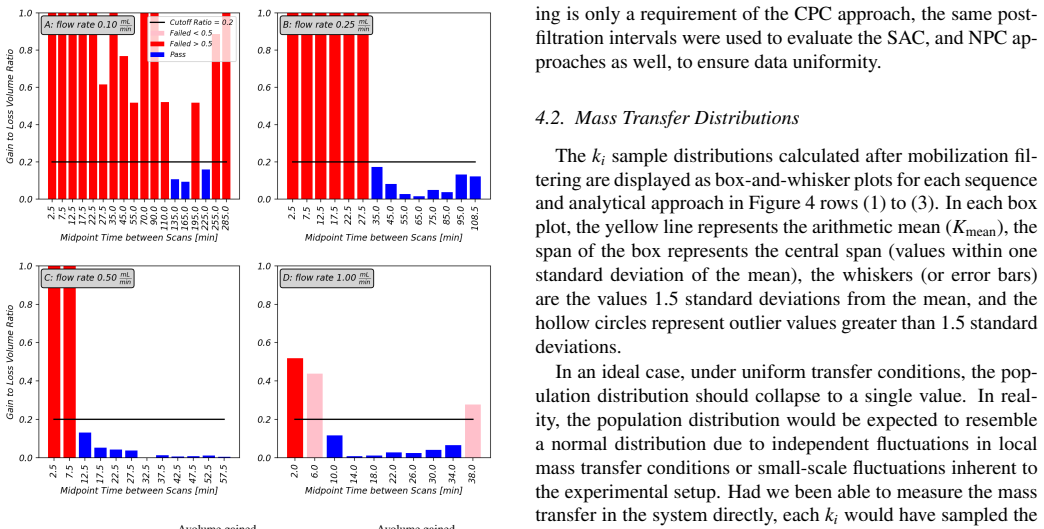
The load-bearing premise is that the volume-ratio filter (ΔV_gained/|ΔV_lost| ≤ 0.2) cleanly separates dissolution-dominated from remobilization-dominated time-intervals; the paper admits there is no established method for setting this threshold, it is chosen post hoc to 'ensure sufficient data remained' (Section 4.1), and Table 6 shows it changes final average mass-transfer coefficients by up to 54% (Seq 0.10 CPC -38%, Seq 0.25 NPC +54%).
Editorial extensions
If this is right
- For system-scale mass-transfer coefficients, the least expensive approach (SAC) is sufficient: at each injection rate its estimate falls within an order of magnitude of both per-cluster approaches.
- Pore-scale aqueous solute concentration cannot be treated as method-independent: SAC systematically dilutes, NPC exceeds physical bounds, and CPC alone localizes a moving, non-uniform dissolution front.
- The front's leading edge is underpredicted by the sequence-average mass-transfer coefficient, as shown by CPC's negative concentrations clustering at that edge in the point-cloud visualization.
- The mobilization filter is portable to all three approaches: excluding time-intervals with volume-gained-to-volume-lost ratio above 0.2 removes remobilization-biased early intervals and shifts final coefficients by -38% to +54% depending on sequence and method.
- All three approaches agree that mass-transfer coefficients increase with injection rate, and in dimensionless Sherwood-Reynolds form the proportional gap between approaches narrows as injection rate rises.
Reading between the lines
- The order-of-magnitude agreement is demonstrated for one gas (hydrogen), one packing, and four low-Reynolds-number rates; nothing in the data says it generalizes to other gases, pressures, or rock types — the cross-study comparison in the paper is too confounded by medium differences to test this.
- Because the 0.2 mobilization threshold shifts coefficients by up to 54% (Table 6), the reported agreement may be partly a consequence of that particular cutoff; sweeping the threshold or weighting intervals continuously would test whether the agreement is a property of the physics or of the filter.
- The CPC negative-concentration region could be repurposed as a quantitative diagnostic: fitting a spatially resolved (per-region) coefficient at the leading edge would measure how much front dissolution exceeds the bulk average, and could be validated against independent effluent-concentration measurements.
- SAC's dilution error is itself informative: the gap between SAC and per-cluster concentration estimates measures how non-uniform the real dissolution field is, and mapping that gap across injection rates would quantify flow-rate effects on radial mixing.
Signed reviews
Editorial analysis
A structured set of objections, weighed in public.
Referee Report
Summary. The paper applies three published micro-CT-based analytical frameworks — Slice-Averaged Concentration (SAC), Non-Classified per-Cluster (NPC), and Classified per-Cluster (CPC) — to the same time-lapsed H2 dissolution datasets from Patmonoaji et al. (2023) at four solvent injection rates. It introduces a volume-ratio mobilization filter to remove time intervals suspected of dissolution-driven cluster remobilization, then compares the resulting mass-transfer coefficients, concentration estimates, and Sherwood-Reynolds behavior. The central claims are that the three approaches estimate average mass-transfer coefficients within one order of magnitude of one another at each injection rate, that pore-scale concentration estimates diverge strongly (SAC dilutes, NPC violates 0–1 bounds, CPC yields negative values at the front), and that the practical choice among approaches should depend on the desired spatial detail versus computational cost.
Significance. If the claims hold, the paper provides a useful practical benchmark: it applies three published analytical frameworks side-by-side on common datasets, transparently reports data-retention statistics, and candidly acknowledges the absence of ground-truth measurements. The introduction of a mobilization filter and the systematic quantification of its effect (Table 6) is a useful contribution, as is the dimensionless Sherwood-Reynolds comparison. The paper is also appropriately hedged in several places, noting that previous studies are not directly comparable. However, the central comparison is currently undermined by an inconsistency in whether the SAC values are recomputed on the filtered, three-phase segmented data or taken from the original study, and the back-calculated concentration fields are algebraic functions of the very average they are used to interpret. These issues need to be resolved before the comparative claims can be taken as established.
major comments (3)
- [§4.1 and §4.4, Fig. 6] The basis of the SAC comparison is internally inconsistent. Section 4.1 states that 'the same post-filtration intervals were used to evaluate the SAC, and NPC approaches as well, to ensure data uniformity,' but the Figure 6 caption says 'The K_seq mean SAC values obtained from Patmonoaji et al. (2023) are in purple.' The original study used two-phase segmentation and did not apply the mobilization filter. Table 6 shows that this filter changes the per-cluster K_seq estimates by up to +54% (NPC, Seq. 0.25) and -38% (CPC, Seq. 0.10). If the SAC values are indeed taken from Patmonoaji et al. (2023), then the one-order-of-magnitude agreement is not a same-data comparison and the central claim is not supported as presented. If the SAC values were recomputed, the figure and methods must be corrected to state so explicitly and to report the recomputed values.
- [§3.4, Eq. (13) and §4.3] The normalized aqueous concentrations for the per-cluster approaches are not independent estimates: Eq. (13) back-calculates C_i/C_sol using the same K_seq_ave that the paper estimates from the cluster volume changes. For a shrinking cluster with S_tot = S_aff, Eq. (13) reduces, algebraically, to C_i/C_sol = 1 - k_i/K_seq_ave. Thus C_i/C_sol < 0 is equivalent to k_i > K_seq_ave, and C_i/C_sol > 1 is equivalent to a positive volume change. The statement in §4.3 that the CPC approach 'yields unexpected negative aqueous concentrations' and the interpretation of the negative front as a region where the dissolution front is 'increasingly underestimated' are therefore interpretations of residuals from the sequence average, not independent concentration measurements. This needs to be reframed as a diagnostic of mismatch between local and averaged k, or validated against an independent concentra
- [§4.1, Table 6] The mobilization filter threshold is selected post hoc: ΔV_gained/|ΔV_lost| ≤ 0.2 was chosen to 'ensure sufficient data remained.' Table 6 shows that the filter changes final K_seq estimates by tens of percent for some sequences. Because the central comparison is conducted on post-filter intervals, the sensitivity of the cross-approach agreement to this threshold should be quantified. If the one-order-of-magnitude agreement persists over a range of thresholds, the claim is robust; if not, the reported agreement may inherit a selection bias from the filter.
minor comments (5)
- [§3.3] Typo: 'The time fo each scan' should be 'The time of each scan.'
- [§3.4, Eq. (11)] Eq. (11) uses S_atot,i in the denominator, while Eq. (13) uses S_aff,i. The relationship between these areas for partially dissolved versus completely dissolved clusters should be stated explicitly, especially since the NPC implementation is described as using the 'average fluid-fluid interfacial area.'
- [§4.2 and Fig. 4] The notation for the SAC interval average alternates between K_int_mean and 'saturation average.' Also, Figure 4's caption says 'Seq. 1.00' while the text sometimes uses 'Seq. 1.0'; please standardize.
- [Table 6] The 'Difference [%]' column should specify whether the percentage is relative to the unfiltered value and how the confidence intervals propagate through the filtering step.
- [§2, Table 2] The H2 density and solubility are given without uncertainty or the pressure/temperature provenance beyond a single line; if available from Patmonoaji et al. (2023), a citation would be helpful.
Circularity Check
Per-cluster concentration estimates are back-calculated from the very K_seq_ave they are compared against; central mass-transfer comparison is independent.
-
self definitional
[Section 4.3, Eq. (13), Fig. 5 (and Eq. (11), Section 3.4)]
"For both the NPC and the CPC approaches, the concentration is back-calculated using the previously estimated K_seq_ave value and Eq. (13). ... Ci/Csol<0 represent underestimated clusters (where k_i > K_seq_ave, for ΔV_i), and Ci/Csol>1 represent overestimated clusters (where k_i < K_seq_ave, for ΔV_i)."
Eq. (13) is Eq. (11) algebraically rearranged with the sequence average K_seq_ave replacing the local k_i. From Eq. (11), k_i = -(ΔV_i/Δt)ρ_gas/(S_atot,i Csol), so Eq. (13) gives C_i/Csol = 1 - (S_atot,i/S_aff,i)(k_i/K_seq_ave). Thus C_i/Csol<0 holds exactly when k_i exceeds the weighted mean K_seq_ave (and C_i/Csol>1 when ΔV_i>0). The 'negative concentrations at the dissolution front' are therefore a restatement of the scatter of per-cluster k_i around its own weighted average, not an independent physical concentration measurement. The paper discloses the back-calculation but presents the out-of-bounds values as evidence that the per-cluster approaches diverge from SAC; that portion of the comparison is fixed by the defining equations.
full rationale
The central claim—that SAC, NPC, and CPC estimate average mass-transfer coefficients within one order of magnitude—is not circular: the K_seq_ave values are computed from imaged cluster volume changes and surface areas via Eq. (11) (CPC/NPC) and from saturation changes via Eq. (6) (SAC), not fitted to force agreement. The per-cluster concentration analysis, however, is self-referential: Eq. (13) defines C_i using K_seq_ave, so the finding that CPC/NPC produce out-of-bounds concentrations, and that CPC gives negative values at the leading edge, is algebraically equivalent to reporting that some k_i deviate from their own weighted average. This is a genuine but bounded circularity; it does not undermine the mass-transfer-coefficient comparison. A separate consistency concern (not scored as circularity) is that Section 4.1 says the same filtered intervals were used for SAC, while the Fig. 6 caption says SAC K_seq values were obtained from Patmonoaji et al. (2023); if those are unfiltered values from the original 2-phase processing, that is a comparability flaw rather than a definitional circularity. No load-bearing uniqueness theorems or self-citation chains are invoked; the methods from Huang et al. (2023) and Lv et al. (2024) are applied as published formulas. Score 6 reflects one self-definitional 'prediction' (the concentration divergence) while the primary mass-transfer result remains independently computed.
Assumptions & free parameters
free parameters (5)
- Mobilization filter volume-ratio threshold =
0.2 (ΔV_gained/|ΔV_lost| ≤ 0.2)
- Minimum cluster size cutoff =
50.40 µm (15 voxels, ~3 voxels equivalent spherical diameter)
- Cluster matching tolerances =
center-of-geometry shift ≤ 4 voxels; volume change ≤ 99%
- Cluster classification volume-change thresholds =
±10% volume change
- Surface-area–volume linear best-fit relation =
slope and intercept fit to cluster data
assumptions (9)
- domain assumption Thin-film/boundary-layer mass-transfer model
- domain assumption Constant gas density
- domain assumption SAC 1-D pseudo-steady advection-dominant flow
- domain assumption NPC: all cluster volume changes are mass transfer and C_g = 0
- domain assumption CPC: completely dissolved clusters define the dissolution front
- domain assumption Linear volume change over time interval
- domain assumption Three-phase segmentation accuracy despite overlapping water/grain attenuation
- domain assumption Law of large numbers validity for NPC
- domain assumption Pore-network reconstruction of dry scan for pore-size distribution
Cite this review
Pith. "Pith review of Quantifying Injection-Driven Interphase Mass Transfer within Porous Media via Time-Elapsed X-ray micro-Computed Tomography." pith.science (2026). https://pith.science/paper/TS23VLVV
@misc{pith2026260407743,
  author       = {Pith},
  title        = {Pith review of: Quantifying Injection-Driven Interphase Mass Transfer within Porous Media via Time-Elapsed X-ray micro-Computed Tomography},
  year         = {2026},
  howpublished = {\url{https://pith.science/paper/TS23VLVV}},
  note         = {Machine review of arXiv:2604.07743}
}
abstract
Understanding interphase mass transfer is essential for a variety of applications in porous media, ranging from groundwater remediation to geologic energy storage. While X-ray micro-Computed Tomography ($\mu$CT) provides critical \textit{in situ} observations, its application in quantifying mass transfer phenomena requires models and workflows compatible with spatial and temporal constraints. Current literature presents three analytical frameworks for evaluating interphase mass transfer using time-lapsed sequences of $\mu$CT scans: the Slice-Averaged Concentration (SAC) approach, the Non-Classified per-Cluster (NPC) approach, and the Classified per-Cluster (CPC) approach. Comparing results with previous studies, we identify that further research is needed to understand how these approaches will vary with experimental conditions and how the physical implications of their calculation frameworks should affect the interpretation of the results, as there are often no ground-truth measurements to compare the estimates to. The current study systematically evaluates the frameworks and results of the three approaches as applied to several sequences of time-lapsed $\mu$CT scans, each observing hydrogen dissolution experiments at varying injection rates. For each observed advective injection rate, results indicate that system-scale properties, like mass transfer, appear robust to the selected approach. However, approach estimates diverged when approximating more complex, pore-scale phenomena, such as aqueous solute concentration. Ultimately, the utility of one approach over another is determined by the desired level of system detail, at the cost of the computational resources required to achieve it. Our results provide a framework for researchers to select analytical approaches based on available computational resources and the desired level of physical detail.
Figures


Figures from the paper (5 more)


Reference graph
Works this paper leans on
-
[1]
Blunt, Multiphase Flow in Permeable Media: A Pore Scale Perspective
M. Blunt, Multiphase Flow in Permeable Media: A Pore Scale Perspective. (Cambridge University Press,(2017)). https://doi.org/10.1017/9781316145098
-
[2]
T. Bultreys, W. De Boever, and V. Cnudde, Imaging and image-based fluid transport modeling at the pore scale in geological materials: A practical introduction to the current state-of-the-art. Earth-Science Reviews . 155 pp. 93-128 (2016) http://dx.doi.org/10.1016/j.earscirev.2016.02.001
-
[3]
Y. Chow, G. Maitland, and J. Trusler, Erratum to “Interfacial tensions of (H2O & H2) and (H2O & CO2 & H2) systems at temperatures of (298 to 448) K and pressures up to 45 MPa” [Fluid Phase Equil. 475 (2018) 37-44] em\ Fluid Phase Equilibrium 503 (2020) https://doi.org/10.1016/j.fluid.2019.112315
arXiv 2018
-
[4]
Clark, Transport and Modeling of Environmental Engineers and Scientists
M. Clark, Transport and Modeling of Environmental Engineers and Scientists. (Wiley Publications,(2011)), ISBN: 978-0-470-26072-2
2011
-
[5]
F. Crotogino, G. Schneider,and D. Evans, Renewable energy storage in geological formations Proceedings of the Institution of Mechanical Engineers, Part A: Journal of Power and Energy 232: pp. 100-114 (2017) doi:10.1177/0957650917731181
-
[6]
Cussler, Diffusion: Mass Transfer in Fluid Systems (Cambridge University Press,(2009)), ISBN: 9780521871211
E. Cussler, Diffusion: Mass Transfer in Fluid Systems (Cambridge University Press,(2009)), ISBN: 9780521871211
2009
-
[7]
J. Donaldson, J. Istok, M. Humphrey, K. O'Reilly, C. Hawelka, and D. Mohr, Development and testing of a Kinetic Model for Oxygen and Transport in Porous media in the presence of Trapped Gas. Groundwater . 35 pp. 270-279 (1997). https://doi.org/10.1111/j.1745-6584.1997.tb00084.x
arXiv 1997
-
[8]
H. Geistlinger, A. Beckmann, and D. Lazik, Mass transfer between a multicomponent trapped gas phase and a mobile water phase: experiment and theory, Water Resources Research , 41 (2005), pp. 1-15, https://doi.org/10.1029/2004WR003885
Show all 39 references
-
[9]
P. I. Guntorp, Y. Ghorbani, P. Koch, and J. Rosenkranz, X-ray Microcomputed Tomography ( CT) for Mineral Characterization: A Review of Data Analysis Methods. Minerals . 9 183 (2019) https://doi.org/10.3390/min9030183
2019 doi
-
[10]
Herring, E
A. Herring, E. Harper, L. Andersson, A. Sheppard, B. Bay, and D. Wildenschild, Effect of fluid topology on residual nonwetting phase trapping: Implications for geologic CO _2 sequestration. Advances in Water Resources . 62, pp. 47-58 (2013) https://doi.org/10.1016/j.advwatres....
2013 doi
-
[11]
Herring, A
A. Herring, A. Sheppard, L. Andersson, and D. Wildenschild, Impact of wettability alteration on 3-D nonwetting phase trapping and transport. International Journal of Greenhouse Gas Control . 46 pp. 175-186 (2016,3) https://www.sciencedirect.com/science/article/pii/S1750583615301754
2016
-
[12]
Herring, V
A. Herring, V. Robins, and A. Sheppard, Topological Persistence for Relating Microstructure and Capillary Fluid Trapping in Sandstones. Water Resources Research . 55, 555-573 (2019,1) https://agupubs.onlinelibrary.wiley.com/doi/full/10.1029/2018WR022780
2019 doi
-
[13]
Higgs, Y
S. Higgs, Y. Wang, C. Sun, J. Ennis-King, S. Jackson, R. Armstrong, and P. Mostaghimi, Comparative analysis of hydrogen, methane, and nitrogen relative permeability: Implications for Underground Hydrogen Storage. Journal of Energy Storage 73 108827 (2023) https://doi.org/10.10...
2023
-
[14]
Y. Hu, A. Patmonoaji, H. Xu, K. Kaito, S. Matsushita, and T. Suekane, Pore-scale investigation on non-aqueous phase liquid dissolution and mass transfer in 2D and 3D porous media. International Journal of Heat and Mass Transfer . 169. 120901 (2021) https://doi.org/10.1016/j.ij...
2021
-
[15]
Y. Hu, C. Zhang, A. Patmonoaji, Y. She, S. Matsushita, and T. Suekane, Pore-scale investigation of wettability on residual non-aqueous phase liquid dissolution in natural porous media. Science of the Total Environment . 787 147406 (2021) https://doi.org/10.1016/j.scitotenv.2021.147406
2021
-
[16]
Huang, A
R. Huang, A. Herring, and A. Sheppard, Effect of Saturation and Image Resolution on Representative Elementary Volume and Topological Quantification: An Experimental Study on Bentheimer Sandstone Using Micro-CT. Transp. Porous Media 137 pp. 489-518, (2021), https://doi.org/10.1...
2021 doi
-
[17]
Huang, A
R. Huang, A. Herring, and A. Sheppard, Investigation of supercritical CO _2 mass transfer in porous media using X-ray micro-computed tomography. Advances In Water Resources . 171 pp. 104338 (2023), https://www.sciencedirect.com/science/article/pii/S0309170822002019
2023
-
[18]
(Cambridge University Press, 2022), https://www.ipcc.ch/report/ar6/wg2/
IPCC Climate Change 2022: Impacts, Adaptation and Vulnerability. (Cambridge University Press, 2022), https://www.ipcc.ch/report/ar6/wg2/
2022
-
[19]
Jiang, B
L. Jiang, B. Wu, Y. Song, M. Yang, D. Wang, Y. Liu, and Z. Xue, Mass transfer coefficient measurement during flush in CO _2 -filled packed bed by X-ray CT Scanning International Journal of Heat and Mass Transfer . 115 pp. 615-624, (2017). https://doi.org/10.1016/j.ijheatmasstr...
2017 doi
-
[20]
King, (1980) textit Separation Processes , 2nd ed
C. King, (1980) textit Separation Processes , 2nd ed. McGraw-Hill Chemical Engineering Series. ISBN: 0-07-034612-7
1980
-
[21]
Krevor, R
S. Krevor, R. Pini, L. Zuo, and S. Benson, Relative permeability and trapping of CO _2 and water in sandstone rocks at reservoir conditions. Water Resources Research . 48 (2012) https://agupubs.onlinelibrary.wiley.com/doi/full/10.1029/2011WR010859
2012 doi
-
[22]
S. Li, X. Wang, L. Jiang, L. Wang, Y. Zhang, B. Wu, Dynamic Characterization of interface and mass transfer of CO _2 -brine during CO _2 Storage in saline aquifer Gas Science and Engineering . 143 205717 (2025) https://doi.org/10.1016/j.jgsce.2025.205717
2025
-
[23]
Lin, S.J
Q. Lin, S.J. Neethling, K.J. Dobson, L. Courtois, and P.D. Lee, Quantifying and minimising systematic and random errors in X-ray micro-tomography based volume measurements, Computers & Geosciences 77, pp. 1-7 (2015) https://doi.org/10.1016/j.cageo.2014.12.008
2015 doi
-
[24]
Liyanage, J
R. Liyanage, J. Cen, S. C. M. Krevor, J. P. Crawshaw, and R. Pini, Multidimensional Observations of Dissolution-Driven Convection in Simple Porous Media Using X-Ray CT Scanning, Transp. Porous Media 126, 355 (2019) https://doi.org/10.1007/s11242-018-1158-3
2019 doi
-
[25]
P. Lv, Y. Chang, F. Liu, Y. Liu, B. Wang, X. Guo, and Y. Song, CO _2 -brine mass transfer patterns and interface dynamics under geological storage conditions, International Journal of Heat and Mass Transfer . 222, 125184 (2024), https://doi.org/10.1016/j.ijheatmasstransfer.2024.125184
2024
-
[26]
Miller, M
C. Miller, M. Poirier-McNeil, and A. Mayer, Dissolution of Trapped Nonaqueous Phase Liquids: Mass Transfer Characteristics. Water Resources Research . 26, 2783-2796 (1990) https://agupubs.onlinelibrary.wiley.com/doi/abs/10.1029/wr026i011p02783
1990 doi
-
[27]
Muhammed, B
N. Muhammed, B. Haq, D. Al Shehri, A. Al-Ahmed, M. Rahman, and E. Zaman, A review on underground hydrogen storage: Insight into geological sites, influencing factors and future outlook. Energy Reports . 8 pp. 461-499 (2022), https://www.sciencedirect.com/science/article/pii/S2...
2022
-
[28]
Gaseous Carbon Waste Streams Utilization: Status and Research Needs
National Academies of Sciences, Engineering, and Medicine 2019. Gaseous Carbon Waste Streams Utilization: Status and Research Needs. Washington, DC: The National Academies Press. https://doi.org/10.17226/25232
2019 doi
-
[29]
Patmonoaji and T
A. Patmonoaji and T. Suekane, Investigation of CO _2 dissolution via mass transfer inside a porous medium. Advances in Water Resources . 110 pp. 97-106 (2017), https://doi.org/10.1016/j.advwatres.2017.10.008
2017 doi
-
[30]
Patmonoaji, Y
A. Patmonoaji, Y. Hu, M. Nasir, C. Zhang, and T. Suekane, Effects of Dissolution Fingering on Mass Transfer Rate in Three-Dimensional Porous Media. Water Resources Research 57 (2021), https://doi.org/10.1029/2020WR029353
2021 doi
-
[31]
Patmonoaji, M
A. Patmonoaji, M. Tahta, J. Tuasikal, Y. She, Y. Hu, and T. Suekane, Dissolution mass transfer of trapped gases in porous media: A correlation of Sherwood, Reynolds, and Schmidt numbers. International Journal Of Heat And Mass Transfer . 205 pp. 123860 (2023), https://www.scien...
2023
-
[32]
Powers, L
S. Powers, L. Abriola, and W. Weber, Jr., An Experimental Investigation of Nonaquesous Liquid Dissolution in Saturated Subsurface Systems: Steady State Mass Transfer Rates. Water Resources Research 28 pp.2691-2705 (1992) https://doi.org/10.1029/92WR00984
1992 doi
-
[33]
Schlüter, A
S. Schlüter, A. Sheppard, K. Brown, and D. Wildenschild, Image processing of multiphase images obtained via X-ray microtomography: A review. Water Resources Research . 50, 3615-3639 (2014) https://agupubs.onlinelibrary.wiley.com/doi/10.1002/2014WR015256
2014 doi
-
[34]
Seagren, B
E. Seagren, B. Rittmann, and A. Valocchi, An experimental investigation of NAPL pool dissolution enhancement by flushing Journal of Contaminant Hydrology . 37, 111-137 (1999) https://doi.org/10.1016/S0169-7722(98)00157-0
1999 doi
-
[35]
Sheppard, R
A. Sheppard, R. Sok, and H. Averdunk, Techniques for image enhancement and segmentation of tomographic images of porous materials. Physica A: Statistical Mechanics And Its Applications . 339, 145-151 (2004), https://www.sciencedirect.com/science/article/pii/S037843710400370X, ...
2004
-
[36]
Wildenschild, C
D. Wildenschild, C. Vaz, M. Rivers, D. Rikard, and B. Christensen, Using X-ray computed tomography in hydrology: systems, resolutions, and limitations. Journal Of Hydrology . 267, 285-297 (2002), https://www.sciencedirect.com/science/article/pii/S0022169402001579
2002
-
[37]
Wildenschild and A
D. Wildenschild and A. Sheppard, X-ray imaging and analysis techniques for quantifying pore-scale structure and processes in subsurface porous medium systems. Advances In Water Resources . 51 pp. 217-246 (2013,1),https://www.sciencedirect.com/science/article/pii/S0309170812002...
2013
-
[38]
Zahasky and S
C. Zahasky and S. Krevor, Global geologic carbon storage requirements of climate change mitigation scenarios. Energy Environ. Sci. . 13, 1561-1567 (2020,6), https://www.pubs.rsc.org/en/content/articlelanding/2020/ee/d0ee00674b
2020
-
[39]
Sheppard, R
A. Sheppard, R. Sok, and H. Averdunk, Techniques for image enhancement and segmentation of tomographic images of porous materials. Physica A: Statistical Mechanics And Its Applications . 339, 145-151 (2004), Proceedings of the International Conference New Materials and Complexity
2004
Reviewed August 2, 2026 · model on record in the stance chip above.
Discussion (0). Continue with ORCID to comment.