REVIEW 3 major objections 6 minor 25 references
Robustness of Reinforcement Learning-Based Congestion Management in Low-Voltage Grids
T0 review · 3 major / 6 minor · reviewed 2026-08-01 · deepseek-v4-flash
Pith's one-line read Decoupled detection and control makes reinforcement-learning curtailment robust: 98.9% of violation magnitude removed with accurate models, 79.6% under tested grid-model mismatch.
desk verdict The two-step RL-plus-random-forest architecture is worth a look, but the central results table has arithmetic that does not reconcile, so treat the headline numbers as unverified. read the letter →
The pith
A machine-rendered reading of the paper's core claim, the machinery that carries it, and where it could break.
The reading
What carries the argument
The central object is a two-step pipeline. A random-forest classifier consumes the partial, noisy observation vector and predicts whether a voltage or loading violation is present; only cases predicted as violations are passed to the controller. The controller is a deep deterministic policy-gradient actor-critic: the actor maps observable measurements to curtailment factors for controllable buses, and the critic learns to evaluate state–action pairs from a reward that penalizes the maximum voltage and branch-loading violation and rewards minimal curtailment. After each action, new observations are taken and the loop repeats for a fixed number of control steps, allowing iterative correction.
What would settle it
Take the same trained controller and apply it to a second low-voltage grid whose true line parameters are known to differ from the documentation in a correlated way—for instance, every underground cable's resistance is 8% higher than recorded, as is common in aged networks—and measure the remaining violation magnitude; if the reduction drops below 50%, the paper's claim that the controller still mitigates most violations would be falsified.
Extended reading notes
Core claim
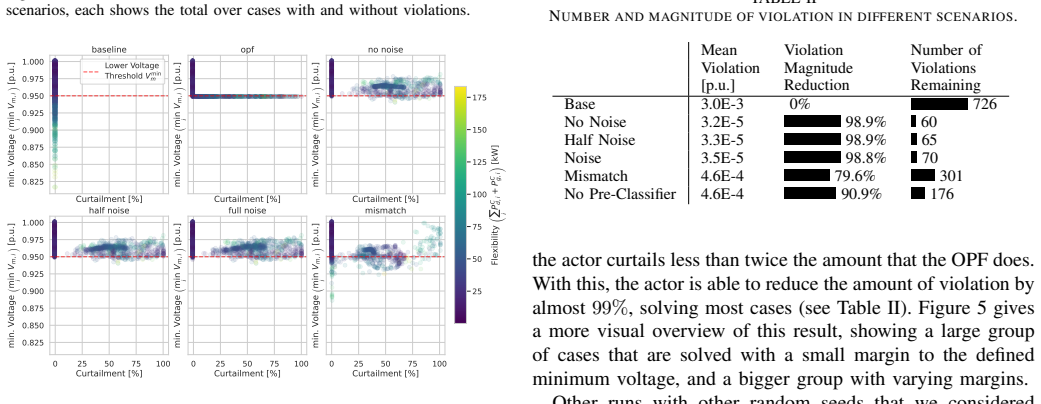
The central claim is that decoupling congestion detection from control makes RL-based curative curtailment practical under realistic operating conditions. With only 10% of buses observable and controllable, the combined random-forest pre-classifier and actor-critic controller reduces total violation magnitude by 98.9% on a real low-voltage grid, and the reduction stays at 98.9% and 98.8% when sensor noise at half and full manufacturer-rated levels is added. When each line parameter is corrupted by independent Gaussian noise with 5% standard deviation, the reduction falls to 79.6% and the number of remaining violation cases rises from 60 to 301, but the residual violations are far smaller tha
Load-bearing premise
The robustness results rest on the assumption that real grid-model errors are small, independent, symmetric Gaussian perturbations of each line parameter in a single grid; if actual errors are larger, correlated, or biased, the measured 79.6% violation reduction could degrade substantially.
Editorial extensions
If this is right
- If the results hold, measurement noise at realistic sensor levels is not the limiting factor for deploying RL-based curtailment at the grid edge; controllers can be trained on clean simulations and still work with noisy field data.
- Grid-model mismatch is the bigger challenge, but a 5% per-line parameter error still leaves 79.6% of violation magnitude removed, so imperfect documentation does not make learning-based curtailment useless, only less aggressive.
- Decoupling violation detection from control reduces training cost and improves sample efficiency compared with end-to-end RL, which matters because such controllers must be retrained periodically across many substations.
- The policy can be trained purely on power-flow simulations, without needing optimal-power-flow solutions as labels, yet produces curtailment within about a factor of two of the OPF optimum under partial observability.
Reading between the lines
- The tested mismatch is optimistic about how real grid models go wrong: field errors are often correlated across lines and biased (for example, ageing underground cables all have higher resistance than documented), and such systematic bias could push the pre-classifier's false-negative rate well above the 9.2% seen here, so the 79.6% figure should not be read as a worst-case guarantee.
- A cheap extension the paper does not test is to train the actor on an ensemble of randomly mismatched grids (domain randomization); this typically hardens policies against model error and could recover a meaningful share of the 19.3 percentage points lost under mismatch.
- Because the pre-classifier is a simple random forest, its sensitivity under mismatch could be calibrated without retraining the RL agent—for example by lowering its decision threshold only in mismatch-prone conditions—making the two-step design's robustness engineering easier than for a monolithic policy.
- The single-grid case study leaves open transferability: the same pipeline on a different low-voltage topology (dense urban vs. rural) could show different robustness profiles, and the paper's own future-work list points to multi-topology evaluation and field trials.
Editorial analysis
A structured set of objections, weighed in public.
Referee Report
Summary. The paper proposes a two-step framework for curative curtailment in low-voltage distribution grids under partial observability: a random-forest pre-classifier decides whether a congestion violation is present, and an actor-critic controller determines curtailment setpoints. The authors evaluate the framework on a real low-voltage grid topology with synthetic future operating scenarios, comparing against AC-OPF and an end-to-end RL baseline. The central empirical claims are that, with accurate grid parameters, the controller reduces total violation magnitude by 98.9%, that performance is essentially unchanged under the tested measurement-noise levels, and that under the tested Gaussian grid-parameter mismatch the reduction is still 79.6%.
Significance. If the reported results are reliable, the work provides a useful contribution: decoupling violation detection from control is a plausible scalability improvement over end-to-end RL, and the explicit evaluation under measurement noise and parameter mismatch addresses a practically important gap in the RL-for-grid-control literature. Credible strengths are the held-out test set with stratification by violation type, the comparison to a classical OPF reference, and the use of a real grid topology with synthetic operating points. However, the quantitative consistency problem in Table II and the narrowness of the mismatch study currently prevent full confidence in the headline numbers.
major comments (3)
- [Section IV-B, Table II; Section III-E] The headline reductions in Table II are arithmetically inconsistent with the reported mean violation magnitudes. For the Mismatch row, (3.0E-3 - 4.6E-4)/3.0E-3 = 84.7%, not 79.6%; for the No Pre-Classifier row the same final mean gives 84.7%, not 90.9%. The two rows cannot have the same mean magnitude and different reductions under a common baseline. Either the printed percentages or the printed magnitudes are wrong (for 79.6% the final mean should be about 6.1E-4; for 90.9%, about 2.7E-4). The paper also does not define whether 'Mean Violation Magnitude' is averaged over all test cases or only violating cases, nor how 'Reduction' is computed. Because these numbers are the basis of the abstract and conclusion, this must be reconciled and stated precisely.
- [Section III-B, Eq. (4)] The robustness-to-mismatch claim rests on a single synthetic mismatch model: independent zero-mean Gaussian perturbations with η_mis=0.05 applied per line and per parameter, on one grid topology. Correlated parameter errors, biased errors, or larger perturbation magnitudes are not tested. The conclusion that 'the controller still mitigates most violations under the tested mismatch assumptions' is thus much narrower than the general robustness framing in the introduction. Please either add a sensitivity analysis over η_mis and error structure (e.g., correlated or biased mismatches), or explicitly restrict the claims to this specific perturbation model.
- [Section III-D] The dataset consists of 35,040 consecutive 15-minute operating points from a one-year quasi-static time-series simulation. The paper describes a stratified split but does not state that it is temporally blocked. If the split into training/validation/test sets is random, temporally adjacent operating points will appear in different partitions, and the strong autocorrelation of load and generation profiles could leak information into the test set, inflating the reported test-set performance. Please clarify the split procedure; if it is random, repeat the evaluation with a chronological or block-wise split and report whether the conclusions change.
minor comments (6)
- [Eq. (5)] The rendering of the reward function is unclear: the term 'p Verr/0.2' appears to be a missing square-root symbol. Please use unambiguous notation such as sqrt(Verr/0.2).
- [Table II] Please add an explicit definition of 'Mean Violation Magnitude' and 'Reduction', and report the number of test cases and per-seed or per-run variance. Reporting a single selected run without confidence intervals makes it difficult to assess the stability of the 98.9% and 79.6% figures.
- [Figure 4] The figure reports increases in curtailment relative to OPF but does not show variability across runs or the number of runs used to compute the bars. Please clarify whether the values are totals across all test cases and consider adding error bars or a range over random seeds.
- [Section IV-A] The hyperparameter search selects the best of 20 runs based on validation performance. This selection can overfit the validation set; reporting the performance of the selected run is standard, but the paper should at least mention the spread of validation scores across runs or use a final model selection procedure that accounts for this.
- [Section IV-A] The end-to-end baseline is described only as 'slightly-modified' from [17]. Please specify the modifications (architecture, training steps, reward, observation space) to make the comparison reproducible.
- [References] Reference [25] is formatted incompletely ('R. e. a. Lincoln' should list author names). Please correct.
Circularity Check
No circular derivation: the robustness figures are held-out empirical measurements, and the [17] self-citation is a baseline comparison, not a load-bearing premise.
full rationale
The paper's central claims are empirical evaluations, not derivations from inputs. The 98.9% violation-magnitude reduction is computed from test-set measurements (Table II: baseline 3.0E-3 p.u. vs. 3.2E-5 p.u. after control), and the noise/mismatch results are obtained by applying trained policies to a held-out test set. The reward function (Eq. 5) and the evaluation metric both penalize voltage/loading violations, but this is standard train/evaluation alignment and does not make the test-set outcome an identity: the agent could fail to reduce violations, and in fact the mismatch scenario degrades performance. The random-forest pre-classifier is trained on a training split and evaluated on a stratified test split; its false-positive/false-negative counts are reported and are not used as fitted predictions of the final metric. The only self-citation to prior work [17] supplies the end-to-end baseline architecture and the actor-critic starting point; the paper's contribution and headline numbers do not reduce to any claim imported from [17]. There is no invoked uniqueness theorem and no ansatz smuggled in via citation. One notable non-circularity concern is an internal arithmetic inconsistency in Table II: with a 3.0E-3 baseline, a final mean violation magnitude of 4.6E-4 corresponds to about 84.7% reduction, not the reported 79.6% (mismatch) and 90.9% (no pre-classifier), and identical magnitudes are paired with different reductions. This is a reporting/consistency problem to be resolved before accepting the quantitative robustness claims, but it is not a circular-derivation issue. Accordingly, the circularity score is 0.
Assumptions & free parameters
free parameters (5)
- Reward weight λ =
1.07 (no pre-classifier), 1.14 (normal), 1.18 (mismatch)
- Reward weight ν =
0.98 (no pre-classifier), 0.77 (normal), 0.33 (mismatch)
- Mismatch perturbation std η_mis =
0.05
- Reward scaling constants (0.2 p.u. voltage, +100% branch loading) =
0.2 p.u., 1.0 (relative)
- Neural network architecture (layers/width/training steps) =
5x64/200k, 8x32/500k, 5x128/500k
assumptions (6)
- standard math AC power flow equations (Eq. 1b) accurately model the physical grid.
- domain assumption Grid parameter mismatch follows γ_mis = max(γ_nom(1+ε),0) with ε~N(0,0.05²) independently per parameter.
- domain assumption Measurement noise is zero-mean Gaussian with σ equal to half the manufacturer uncertainty range.
- domain assumption Only 10% of buses are observable/controllable, following the German regulatory framework.
- domain assumption Operating points with voltages outside [0.8, 1.2] p.u. are excluded because protection systems would act.
- ad hoc to paper The reward function (Eq. 5) with scaling constants 0.2 p.u. and +100% overload represents realistic violation magnitudes.
Cite this review
Pith. "Pith review of Robustness of Reinforcement Learning-Based Congestion Management in Low-Voltage Grids." pith.science (2026). https://pith.science/paper/TTIUHRQ7
@misc{pith2026260716004,
  author       = {Pith},
  title        = {Pith review of: Robustness of Reinforcement Learning-Based Congestion Management in Low-Voltage Grids},
  year         = {2026},
  howpublished = {\url{https://pith.science/paper/TTIUHRQ7}},
  note         = {Machine review of arXiv:2607.16004}
}
read the original abstract
Increases in photovoltaic generation, charging of electric vehicles and heat-pump demand challenge operating limits in low-voltage distribution grids. This requires curative curtailment methods that can operate under sparse observability, noisy measurements, and imperfect grid models. Unlike prior end-to-end reinforcement-learning approaches for partially observable curtailment, this work decouples congestion detection and control by combining a random-forest violation pre-classifier with an actor-critic controller, and evaluates its robustness to measurement noise and grid-parameter mismatch. The framework is tested on a real low-voltage grid using synthetic future operating scenarios with low observability and controllability. With accurate grid parameters, the controller reduces total violation magnitude by 98.9%, and this performance remains nearly unchanged under the tested measurement-noise settings. Grid-model mismatch proves to be more challenging, but the controller still mitigates most violations under the tested mismatch assumptions.
Figures


Figures from the paper (1 more)
Reference graph
Works this paper leans on
-
[17]
End-to-end reinforcement learning of curative cur- tailment with partial measurement availability,
H. Wolfet al., “End-to-end reinforcement learning of curative cur- tailment with partial measurement availability,” in2024 IEEE PES Innovative Smart Grid Technologies Europe (ISGT EUROPE), 2024, pp. 1–6
2024
-
[1]
A review of congestion management methods for power distribution networks: Current practices and future challenges,
K. K. Mehmoodet al., “A review of congestion management methods for power distribution networks: Current practices and future challenges,” Applied Energy, vol. 407, p. 127342, 2026
2026
-
[2]
State-of-the-art, challenges, and future trends in security constrained optimal power flow,
F. Capitanescuet al., “State-of-the-art, challenges, and future trends in security constrained optimal power flow,”Electric Power Systems Research, vol. 81, no. 8, pp. 1731–1741, 2011
2011
-
[3]
History of optimal power flow and formulations,
M. B. Cain, R. P. O’neill, A. Castilloet al., “History of optimal power flow and formulations,”Federal Energy Regulatory Commission, vol. 1, pp. 1–36, 2012
2012
-
[4]
Strong NP-hardness of AC power flows feasibility,
D. Bienstock and A. Verma, “Strong NP-hardness of AC power flows feasibility,”Operations Research Letters, vol. 47, no. 6, pp. 494–501, 2019
2019
-
[5]
Robustness assessment of primal–dual gradient projection-based online feedback optimization for real-time distribution grid management,
S. Zhan, J. Morren, W. van den Akker, A. van der Molen, N. G. Paterakis, and J. Slootweg, “Robustness assessment of primal–dual gradient projection-based online feedback optimization for real-time distribution grid management,”Electric Power Systems Research, vol. 242, p. 111468, 2025
2025
-
[6]
Optimal power flow in a highly renewable power system based on attention neural networks,
C. Liet al., “Optimal power flow in a highly renewable power system based on attention neural networks,”Applied Energy, vol. 359, p. 122779, 2024
2024
-
[7]
Rl2grid: Benchmarking reinforcement learning in power grid operations,
E. Marchesiniet al., “Rl2grid: Benchmarking reinforcement learning in power grid operations,” 2025. [Online]. Available: https://arxiv.org/abs/2503.23101
arXiv 2025
Show all 25 references
-
[8]
Constrained policy optimization,
J. Achiam, D. Held, A. Tamar, and P. Abbeel, “Constrained policy optimization,” inInternational Conference on Machine Learning. Pmlr, 2017, pp. 22–31
2017
-
[9]
Deep reinforcement learning based approach for optimal power flow of distribution networks embedded with renewable energy and storage devices,
D. Caoet al., “Deep reinforcement learning based approach for optimal power flow of distribution networks embedded with renewable energy and storage devices,”Journal of Modern Power Systems and Clean Energy, vol. 9, no. 5, pp. 1101–1110, 2021
2021
-
[10]
Real-time optimal power flow: A lagrangian based deep reinforcement learning approach,
Z. Yan and Y . Xu, “Real-time optimal power flow: A lagrangian based deep reinforcement learning approach,”IEEE Trans. Power Syst., vol. PP, pp. 1–1, 04 2020
2020
-
[11]
Constrained reinforcement learn- ing for stochastic dynamic optimal power flow control,
T. Wu, A. Scaglione, and D. Arnold, “Constrained reinforcement learn- ing for stochastic dynamic optimal power flow control,” in2023 IEEE Power & Energy Society General Meeting (PESGM). IEEE, 2023, pp. 1–5
2023
-
[12]
Feasibility constrained online calculation for real-time optimal power flow: A convex con- strained deep reinforcement learning approach,
A. R. Sayed, C. Wang, H. I. Anis, and T. Bi, “Feasibility constrained online calculation for real-time optimal power flow: A convex con- strained deep reinforcement learning approach,”IEEE Trans. Power Syst., vol. 38, no. 6, 2023
2023
-
[13]
Optimal operable power flow: Sample-efficient holomorphic embedding-based reinforcement learning,
A. R. Sayed, X. Zhang, G. Wang, C. Wang, and J. Qiu, “Optimal operable power flow: Sample-efficient holomorphic embedding-based reinforcement learning,”IEEE Trans. Power Syst., vol. 39, no. 1, pp. 1739–1751, 2024
2024
-
[14]
Physics-informed reinforcement learning for real-time optimal power flow with renewable energy resources,
Z. Wu, M. Zhang, S. Gao, Z.-G. Wu, and X. Guan, “Physics-informed reinforcement learning for real-time optimal power flow with renewable energy resources,”IEEE Trans. Sustain. Energy, vol. 16, no. 1, pp. 216– 226, 2025
2025
-
[15]
A data-driven method for fast ac optimal power flow solutions via deep reinforcement learning,
Y . Zhouet al., “A data-driven method for fast ac optimal power flow solutions via deep reinforcement learning,”Journal of Modern Power Systems and Clean Energy, vol. 8, no. 6, pp. 1128–1139, 2020
2020
-
[16]
Real- time sequential security-constrained optimal power flow: A hybrid knowledge-data-driven reinforcement learning approach,
Z. Yi, X. Wang, C. Yang, C. Yang, M. Niu, and W. Yin, “Real- time sequential security-constrained optimal power flow: A hybrid knowledge-data-driven reinforcement learning approach,”IEEE Trans. Power Syst., pp. 1–16, 04 2023
2023
-
[18]
Simbench—a benchmark dataset of electric power systems to compare innovative solutions based on power flow analysis,
S. Meineckeet al., “Simbench—a benchmark dataset of electric power systems to compare innovative solutions based on power flow analysis,” Energies, vol. 13, no. 12, p. 3290, 2020
2020
-
[19]
Distributed learning for optimal allocation of synchronous and converter-based generation,
T. Jouini and Z. Sun, “Distributed learning for optimal allocation of synchronous and converter-based generation,” 06 2021, pp. 386–391
2021
-
[20]
Heterogeneous graph neural network with local and global message passing for ac-optimal power flow solutions,
A. Wen, B. Wen, J. Li, and J. Xu, “Heterogeneous graph neural network with local and global message passing for ac-optimal power flow solutions,”Applied System Innovation, vol. 9, no. 1, p. 18, 2026
2026
-
[21]
State estimation in partially observable power systems via graph signal processing tools,
L. Dabush, A. Kroizer, and T. Routtenberg, “State estimation in partially observable power systems via graph signal processing tools,”Sensors, vol. 23, no. 3, p. 1387, 2023
2023
-
[22]
Reinforcement Learning with Deep Deterministic Policy Gra- dient,
H. Tan, “Reinforcement Learning with Deep Deterministic Policy Gra- dient,” in2021 International conference on artificial intelligence, big data and algorithms (CAIBDA). IEEE, 2021, pp. 82–85
2021
-
[23]
Deep deterministic policy gradient algorithm: A systematic review,
E. H. Sumieaet al., “Deep deterministic policy gradient algorithm: A systematic review,”Heliyon, vol. 10, no. 9, 2024
2024
-
[24]
TorchRL: A data-driven decision-making library for PyTorch,
A. Bouet al., “TorchRL: A data-driven decision-making library for PyTorch,” inThe Twelfth International Conference on Learning Rep- resentations, 2024
2024
-
[25]
PYPOWER: Power flow and optimal power flow (OPF) solver
R. e. a. Lincoln, “PYPOWER: Power flow and optimal power flow (OPF) solver.” [Online]. Available: https://pypi.org/project/PYPOWER/
Reviewed August 1, 2026 · model on record in the stance chip above.
Discussion (0). Sign in to comment.