Predictability of a solar flare in May 2024 using observational data-driven MHD simulations
Pith reviewed 2026-06-27 15:17 UTC · model grok-4.3
The pith
Incorporating observed photospheric velocities in MHD simulations extends solar flare prediction lead time beyond one hour.
A machine-rendered reading of the paper's core claim, the machinery that carries it, and where it could break.
Core claim
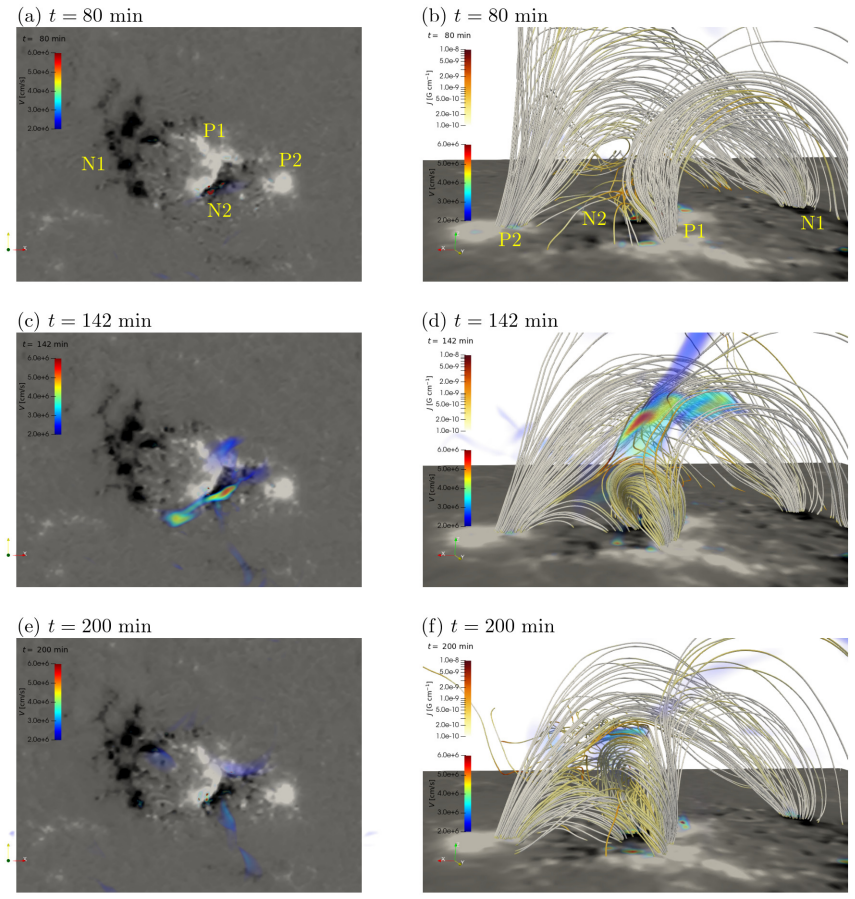
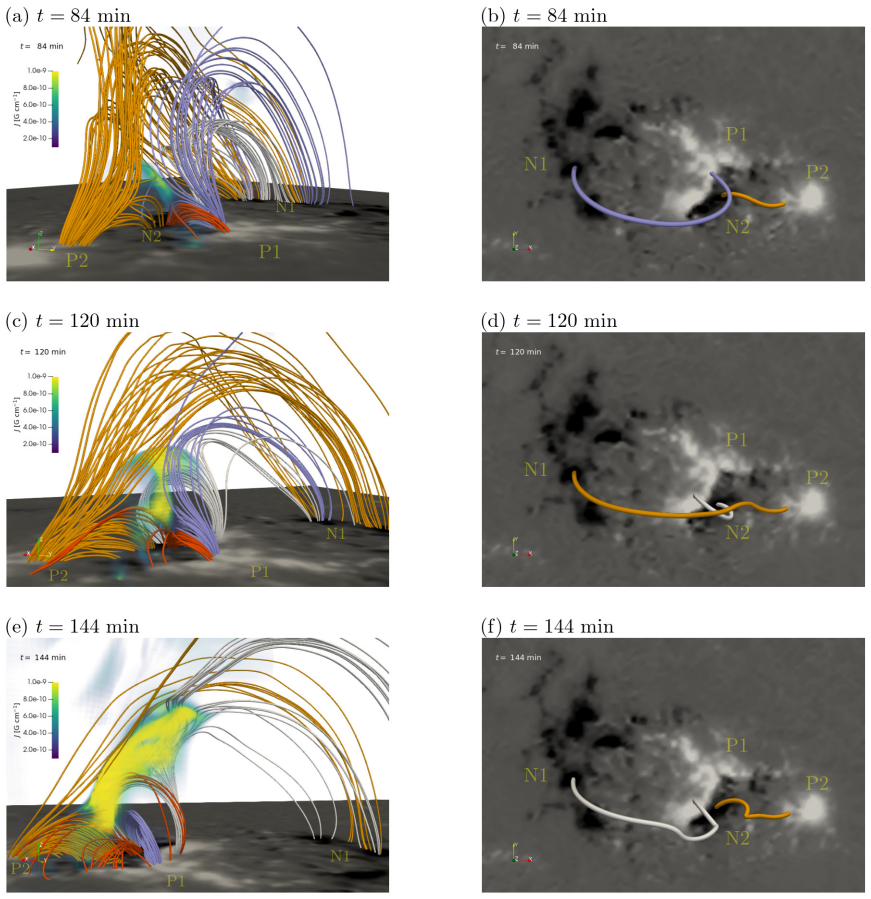
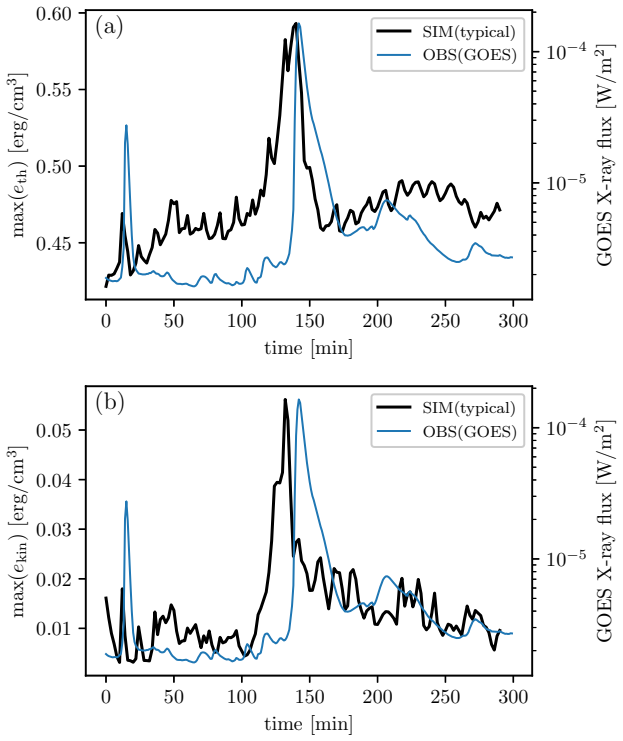
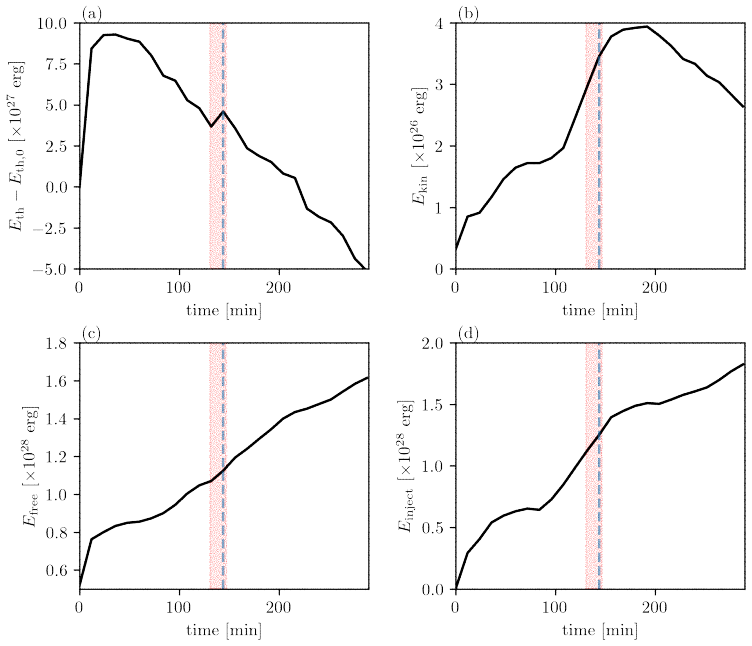
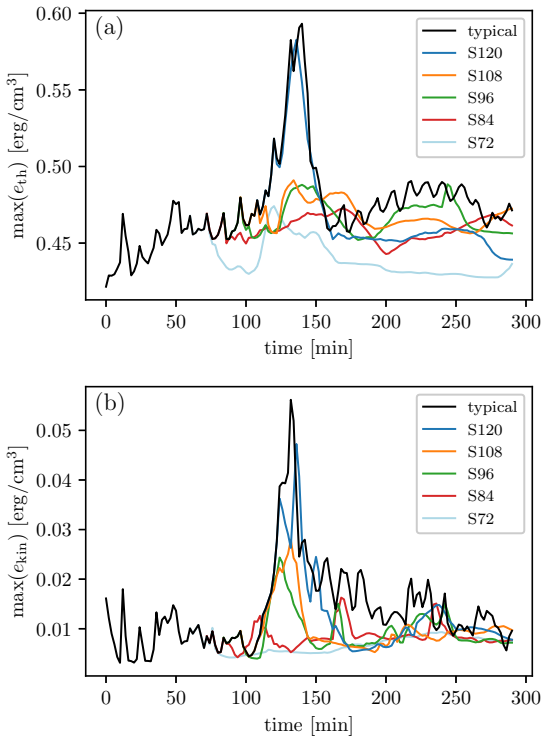
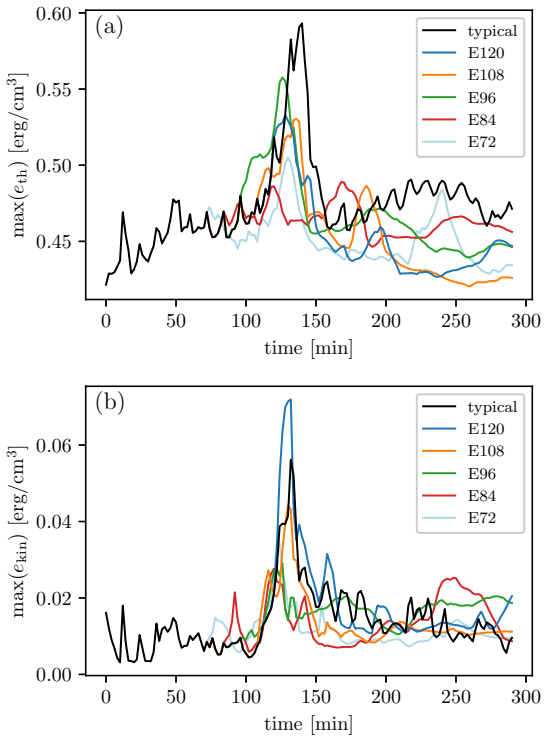
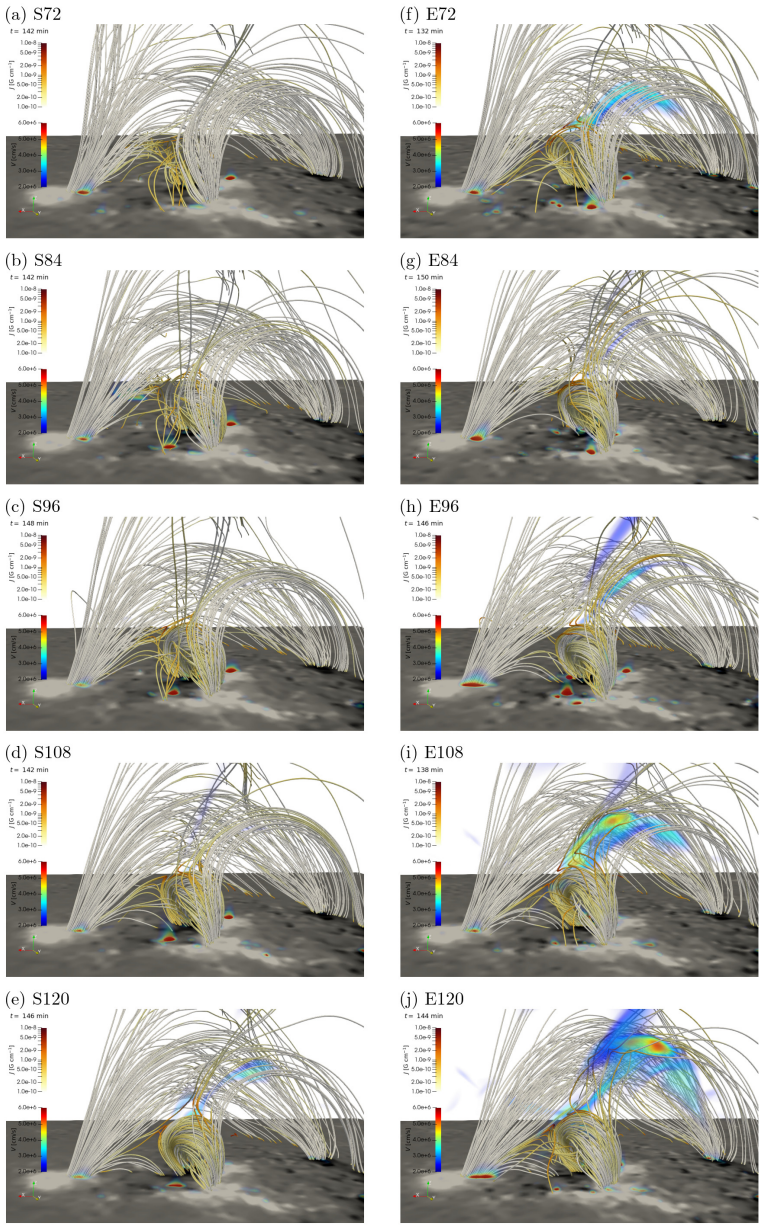
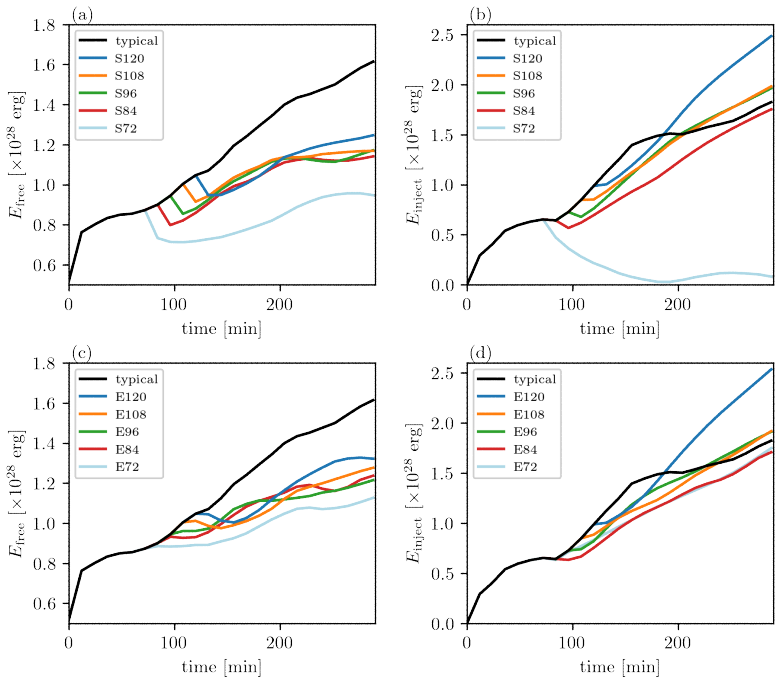
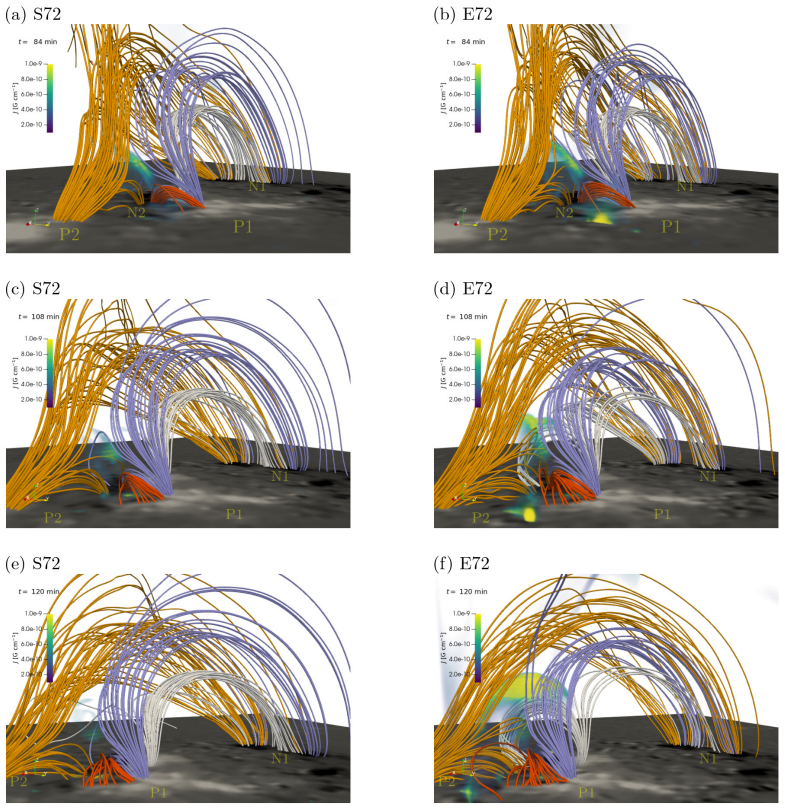
The X1.6 flare was triggered by two-step reconnection in which initial tether-cutting reconnection enabled subsequent breakout reconnection; the velocity-driven MHD simulation reproduced the rapid rise in thermal and kinetic energy at the observed time and place when the photospheric velocity field at the last observation time was used, thereby achieving a prediction lead time exceeding one hour.
What carries the argument
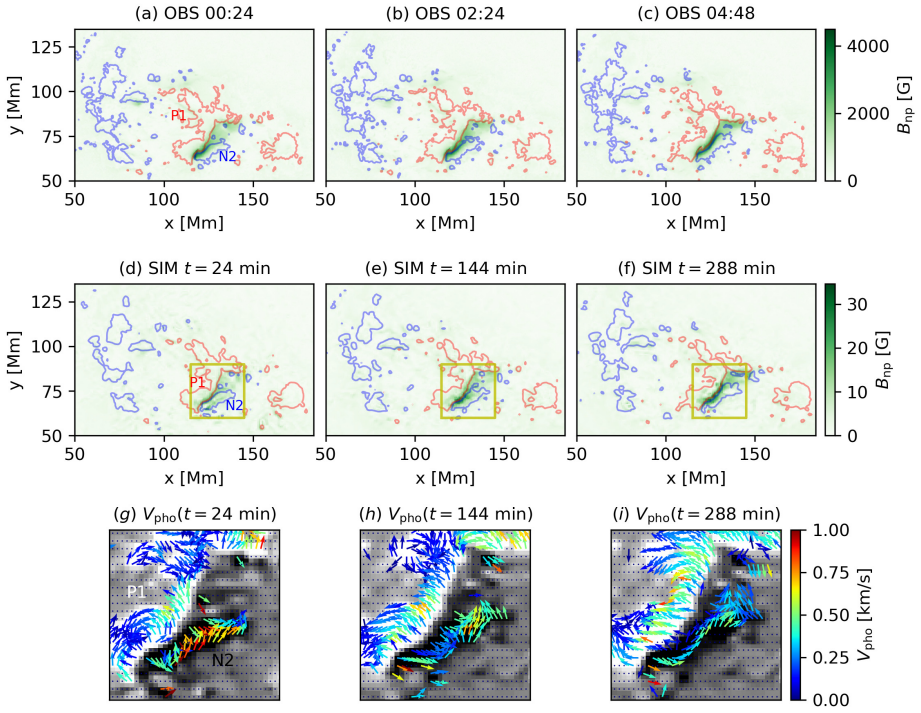
Velocity-driven MHD model that derives the photospheric velocity field from time-series magnetograms and applies it as the time-dependent boundary condition to evolve the coronal magnetic field.
If this is right
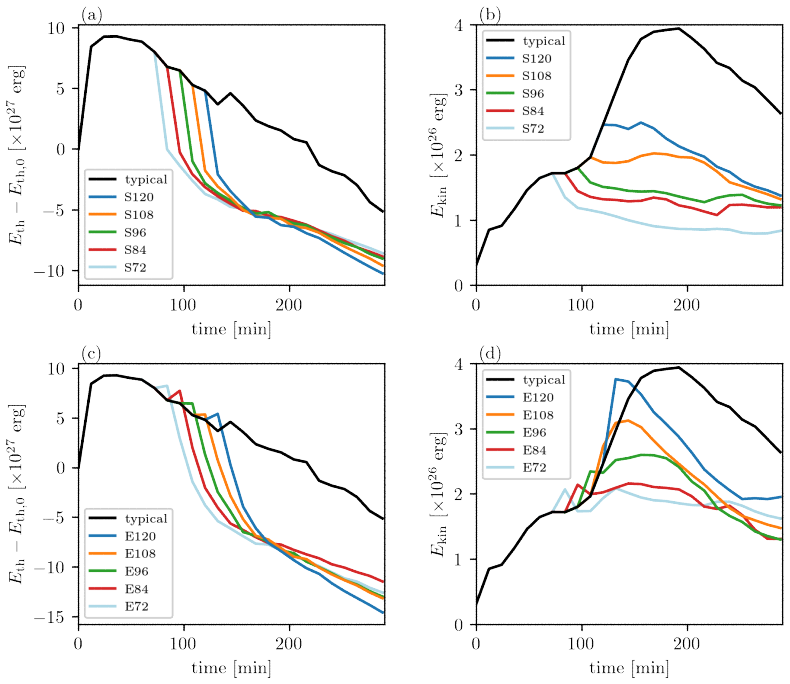
- Fixing the photospheric magnetic field more than one hour before onset prevents reproduction of the flare in the simulation.
- The flare trigger consists of tether-cutting reconnection followed by breakout reconnection.
- Using the velocity field measured at the final pre-flare observation extends the usable prediction window beyond one hour.
- Quantitative forecasting of flare magnitude is not yet achieved with this approach.
Where Pith is reading between the lines
- Continuous high-cadence velocity measurements from the photosphere could support operational flare forecasting systems.
- The same velocity-driven setup might be tested on other active regions to check whether the one-hour lead-time result generalizes.
- Higher spatial resolution magnetograms would likely reduce uncertainty in the derived velocity fields and tighten the timing of predicted energy release.
Load-bearing premise
The photospheric velocity field measured from magnetograms before the flare accurately drives the subsequent coronal evolution that produces the flare.
What would settle it
A simulation that receives velocity boundary input only up to more than one hour before the actual flare onset and shows no rapid increase in thermal and kinetic energy density at the observed flare site and time would falsify the central claim.
Figures
read the original abstract
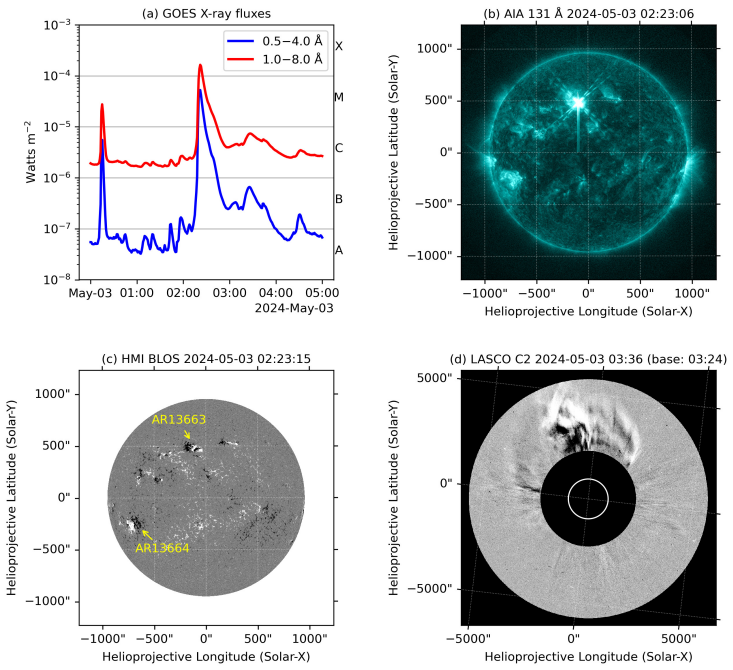
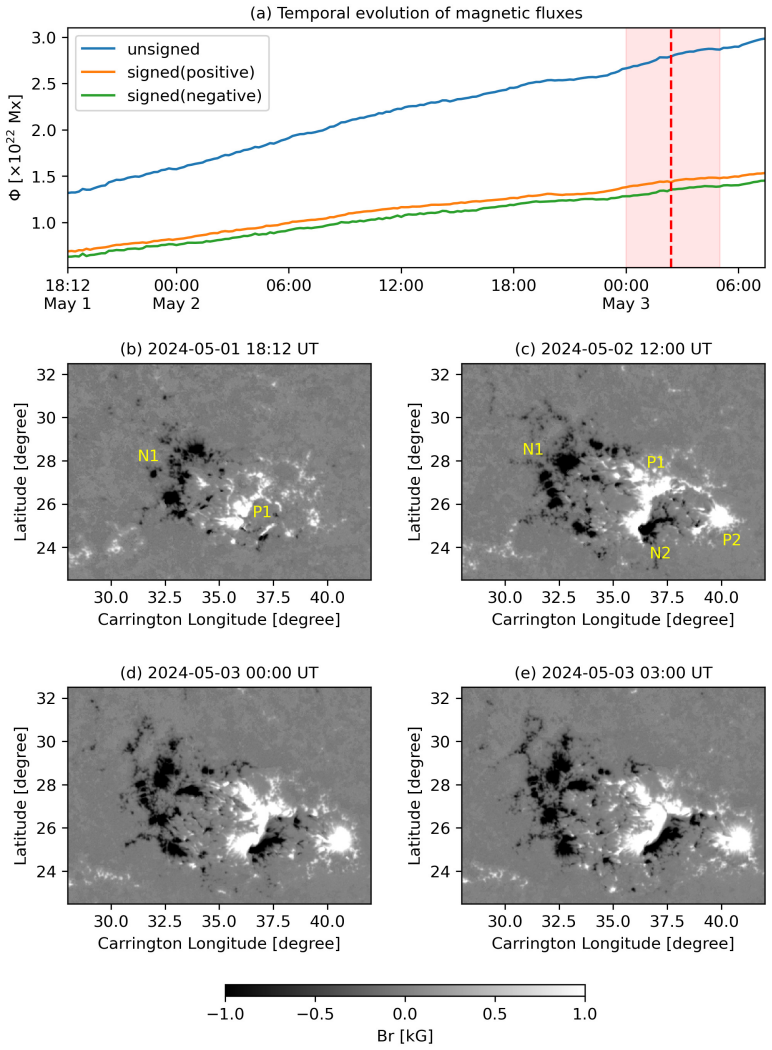
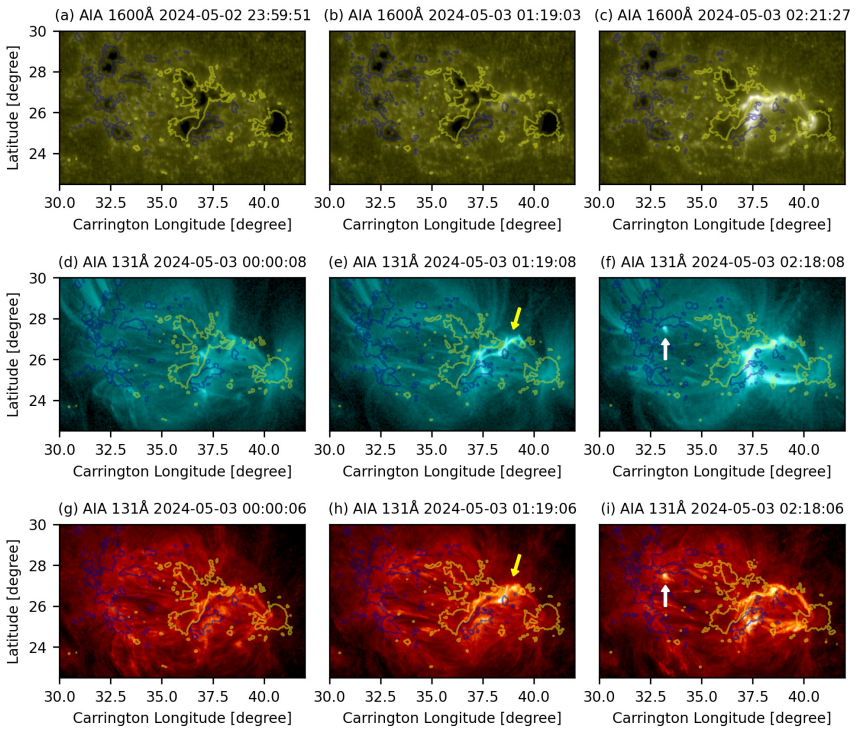
We examined the applicability of observational data-driven magnetohydrodynamic (MHD) simulations to flare prediction. The target event was the X1.6 flare that occurred in NOAA AR 13663 at 02:22 UT on 3 May 2024. We employed a velocity-driven model, in which the photospheric velocity field was derived from the time-series magnetograms to use as the boundary input. The simulation showed a rapid increase in both thermal and kinetic energy density around the actual onset time and location of the X1.6 flare. We revealed that the flare was triggered by two-step reconnection, in which the initial tether-cutting reconnection facilitated the subsequent breakout reconnection. We further examined whether the flare could be reproduced when the boundary input was stopped prior to the actual flare onset time, assuming the situation in which the flare must be predicted using the data before it actually occurs. When the photospheric magnetic field was fixed more than 1 hour before the actual flare onset time, the flare was not reproduced in the simulations. In contrast, when the photospheric velocity field at the final observation time was incorporated to infer the subsequent magnetic evolution, the prediction lead time could be extended beyond 1 hour. On the other hand, quantitative prediction of the magnitude of flares remains a subject for future study.
Editorial analysis
A structured set of objections, weighed in public.
Referee Report
Summary. The paper examines data-driven MHD simulations of the X1.6 flare in NOAA AR 13663 on 3 May 2024. Using photospheric velocity fields derived from time-series magnetograms as boundary driving, the simulation reproduces a rapid increase in thermal and kinetic energy density at the observed flare time and location. The authors attribute the flare to two-step reconnection (tether-cutting followed by breakout). They further test predictability by stopping boundary input prior to onset: fixed-B conditions more than 1 h before onset fail to produce the flare, while incorporating the final pre-onset velocity field extends the lead time beyond 1 h. Quantitative flare magnitude prediction is noted as future work.
Significance. If the central result holds under quantitative scrutiny, the work demonstrates that velocity-driven observational MHD models can extend flare prediction lead times beyond 1 hour for at least this event by evolving the magnetic field from pre-onset flows. The explicit contrast between fixed-B and velocity-driven cases provides a clear test of the role of photospheric driving. Strengths include the use of real magnetogram time series without free parameters fitted to the flare itself and the mechanistic insight into reconnection sequence.
major comments (2)
- [Abstract] Abstract and main text: the central claim that the velocity-driven run reproduces the flare at the observed time/location and enables >1 h lead time rests on an unquantified 'rapid increase in energy density.' No numerical values, error bars, spatial overlap metrics, or direct comparison to observed GOES light curve or energy release are provided, so the degree of agreement cannot be evaluated.
- [Abstract] The velocity derivation and boundary implementation: the abstract states that the photospheric velocity field at the final observation time is used to infer subsequent evolution, but without details on how velocities are computed from magnetogram pairs (e.g., DAVE4VM or similar), the assumed error level, or the precise time of the 'final observation,' it is impossible to confirm that only pre-onset data were used or to assess sensitivity of the >1 h lead time.
minor comments (2)
- The description of 'two-step reconnection' would benefit from explicit figures or time slices showing the sequence of tether-cutting and breakout in the simulation volume.
- Notation for energy densities (thermal vs. kinetic) and the precise definition of 'onset time' in the simulation should be clarified for reproducibility.
Simulated Author's Rebuttal
We thank the referee for the constructive and detailed comments. We address the two major comments point by point below. We agree that both quantification of the energy increase and additional methodological details on velocity derivation are needed to strengthen the manuscript.
read point-by-point responses
-
Referee: [Abstract] Abstract and main text: the central claim that the velocity-driven run reproduces the flare at the observed time/location and enables >1 h lead time rests on an unquantified 'rapid increase in energy density.' No numerical values, error bars, spatial overlap metrics, or direct comparison to observed GOES light curve or energy release are provided, so the degree of agreement cannot be evaluated.
Authors: We agree that the current presentation is qualitative and that quantitative metrics are required for proper evaluation. In the revised manuscript we will report specific numerical values for the factor of increase in thermal and kinetic energy densities at the flare time and location, include spatial overlap metrics (such as the fraction of simulated high-energy voxels overlapping the observed flare ribbons from AIA or HMI data), and add any available temporal alignment with the GOES X-ray flux rise. While we explicitly state that quantitative magnitude prediction remains future work, these metrics will allow assessment of the reproduction claim. revision: yes
-
Referee: [Abstract] The velocity derivation and boundary implementation: the abstract states that the photospheric velocity field at the final observation time is used to infer subsequent evolution, but without details on how velocities are computed from magnetogram pairs (e.g., DAVE4VM or similar), the assumed error level, or the precise time of the 'final observation,' it is impossible to confirm that only pre-onset data were used or to assess sensitivity of the >1 h lead time.
Authors: We acknowledge the need for explicit methodological transparency. The revised paper will add a methods subsection detailing the velocity computation technique applied to the magnetogram time series (including the specific algorithm and any assumptions), the estimated velocity uncertainties or error levels, the exact timestamps of the input magnetograms, and the precise time of the final observation used for the boundary driving. This will confirm that only pre-onset data were employed and enable readers to evaluate the sensitivity of the reported lead time. revision: yes
Circularity Check
No significant circularity
full rationale
The paper's derivation chain uses observed time-series magnetograms to derive photospheric velocities as explicit external boundary inputs to an MHD simulation. The central test (fixed-B case fails to reproduce the flare when input stops >1 h prior, while velocity-driven case succeeds) is an emergent simulation outcome, not a quantity defined by construction, fitted to the target flare, or reduced via self-citation. No load-bearing step matches any enumerated circularity pattern; the reported lead-time extension is a direct consequence of evolving the independent observational data forward.
Axiom & Free-Parameter Ledger
axioms (1)
- domain assumption Photospheric velocity field derived from time-series magnetograms can be used as the boundary input for a velocity-driven MHD model that reproduces flare onset.
Reference graph
Works this paper leans on
-
[1]
A Model for Solar Coronal Mass Ejections
Antiochos SK, DeVore CR, Klimchuk JA (1999) A Model for Solar Coronal Mass Ejections . 510(1):485--493, doi:10.1086/306563, astro-ph/9807220
work page internal anchor Pith review Pith/arXiv arXiv doi:10.1086/306563 1999
-
[2]
Bobra MG, Sun X, Hoeksema JT, Turmon M, Liu Y, Hayashi K, Barnes G, Leka KD (2014) The Helioseismic and Magnetic Imager (HMI) Vector Magnetic Field Pipeline: SHARPs - Space-Weather HMI Active Region Patches . 289(9):3549--3578, doi:10.1007/s11207-014-0529-3, 1404.1879
work page internal anchor Pith review Pith/arXiv arXiv doi:10.1007/s11207-014-0529-3 2014
-
[3]
162(1-2):357--402, doi:10.1007/BF00733434
Brueckner GE, Howard RA, Koomen MJ, Korendyke CM, Michels DJ, Moses JD, Socker DG, Dere KP, Lamy PL, Llebaria A, Bout MV, Schwenn R, Simnett GM, Bedford DK, Eyles CJ (1995) The Large Angle Spectroscopic Coronagraph (LASCO) . 162(1-2):357--402, doi:10.1007/BF00733434
-
[4]
Physics of Plasmas 24(9):090501, doi:10.1063/1.4993929
Chen J (2017) Physics of erupting solar flux ropes: Coronal mass ejections (CMEs) Recent advances in theory and observation . Physics of Plasmas 24(9):090501, doi:10.1063/1.4993929
-
[5]
Chintzoglou G, Zhang J, Cheung MCM, Kazachenko M (2019) The Origin of Major Solar Activity: Collisional Shearing between Nonconjugated Polarities of Multiple Bipoles Emerging within Active Regions . 871(1):67, doi:10.3847/1538-4357/aaef30, 1811.02186
work page internal anchor Pith review Pith/arXiv arXiv doi:10.3847/1538-4357/aaef30 2019
-
[6]
Journal of Computational Physics , year = 2002, month = jan, volume =
Dedner A, Kemm F, Kr \"o ner D, Munz CD, Schnitzer T, Wesenberg M (2002) Hyperbolic Divergence Cleaning for the MHD Equations . Journal of Computational Physics 175(2):645--673, doi:10.1006/jcph.2001.6961
-
[7]
Domingo V, Fleck B, Poland AI (1995) The SOHO Mission: an Overview . 162(1-2):1--37, doi:10.1007/BF00733425
-
[8]
884(1):73, doi:10.3847/1538-4357/ab3e33, 1908.08643
Duan A, Jiang C, He W, Feng X, Zou P, Cui J (2019) A Study of Pre-flare Solar Coronal Magnetic Fields: Magnetic Flux Ropes . 884(1):73, doi:10.3847/1538-4357/ab3e33, 1908.08643
-
[9]
Duan A, Jiang C, Feng X (2025) Did a current sheet form prior to a major flare in solar active region 11158? 541(2):939--945, doi:10.1093/mnras/staf951
-
[10]
975(2):206, doi:10.3847/1538-4357/ad7f53, 2409.17507
Fan Y, Kazachenko MD, Afanasyev AN, Fisher GH (2024) A Data-driven Magnetohydrodynamic Simulation of the 2011 February 15 Coronal Mass Ejection from Active Region NOAA 11158 . 975(2):206, doi:10.3847/1538-4357/ad7f53, 2409.17507
-
[11]
Estimating Electric Fields from Vector Magnetogram Sequences
Fisher GH, Welsch BT, Abbett WP, Bercik DJ (2010) Estimating Electric Fields from Vector Magnetogram Sequences . 715(1):242--259, doi:10.1088/0004-637X/715/1/242, 0912.4916
work page internal anchor Pith review Pith/arXiv arXiv doi:10.1088/0004-637x/715/1/242 2010
-
[12]
979(1):49, doi:10.3847/1538-4357/ad9335, 2407.07665
Hayakawa H, Ebihara Y, Mishev A, Koldobskiy S, Kusano K, Bechet S, Yashiro S, Iwai K, Shinbori A, Mursula K, Miyake F, Shiota D, Silveira MVD, Stuart R, Oliveira DM, Akiyama S, Ohnishi K, Ledvina V, Miyoshi Y (2025) The Solar and Geomagnetic Storms in 2024 May: A Flash Data Report . 979(1):49, doi:10.3847/1538-4357/ad9335, 2407.07665
-
[13]
64(2):303--321, doi:10.1007/BF00151441
Hood AW, Priest ER (1979) Kink Instability of Solar Coronal Loops as the Cause of Solar Flares . 64(2):303--321, doi:10.1007/BF00151441
-
[14]
Nonlinear Force-Free Extrapolation of the Coronal Magnetic Field Based on the MHD Relaxation Method
Inoue S, Magara T, Pandey VS, Shiota D, Kusano K, Choe GS, Kim KS (2014) Nonlinear Force-free Extrapolation of the Coronal Magnetic Field Based on the Magnetohydrodynamic Relaxation Method . 780(1):101, doi:10.1088/0004-637X/780/1/101, 1311.3592
work page internal anchor Pith review Pith/arXiv arXiv doi:10.1088/0004-637x/780/1/101 2014
-
[15]
Double arc instability in the solar corona
Ishiguro N, Kusano K (2017) Double Arc Instability in the Solar Corona . 843(2):101, doi:10.3847/1538-4357/aa799b, 1706.06112
work page internal anchor Pith review Pith/arXiv arXiv doi:10.3847/1538-4357/aa799b 2017
-
[16]
AIAA Journal 55(5):1487--1510, doi:10.2514/1.J055493
Jameson A (2017) Origins and Further Development of the Jameson-Schmidt-Turkel Scheme . AIAA Journal 55(5):1487--1510, doi:10.2514/1.J055493
-
[17]
A New Code for Nonlinear Force-Free Field Extrapolation of the Global Corona
Jiang C, Feng X, Xiang C (2012) A New Code for Nonlinear Force-free Field Extrapolation of the Global Corona . 755(1):62, doi:10.1088/0004-637X/755/1/62, 1206.1989
work page internal anchor Pith review Pith/arXiv arXiv doi:10.1088/0004-637x/755/1/62 2012
-
[18]
MHD Simulation of a Sigmoid Eruption of Active Region 11283
Jiang C, Feng X, Wu ST, Hu Q (2013) Magnetohydrodynamic Simulation of a Sigmoid Eruption of Active Region 11283 . 771(2):L30, doi:10.1088/2041-8205/771/2/L30, 1306.1009
work page internal anchor Pith review Pith/arXiv arXiv doi:10.1088/2041-8205/771/2/l30 2013
-
[19]
Nature Communications 7:11522, doi:10.1038/ncomms11522
Jiang C, Wu ST, Feng X, Hu Q (2016) Data-driven magnetohydrodynamic modelling of a flux-emerging active region leading to solar eruption . Nature Communications 7:11522, doi:10.1038/ncomms11522
-
[20]
The Innovation 3:100236, doi:10.1016/j.xinn.2022.100236
Jiang C, Feng X, Guo Y, Hu Q (2022) Data-driven modeling of solar coronal magnetic field evolution and eruptions . The Innovation 3:100236, doi:10.1016/j.xinn.2022.100236
-
[21]
Joshi NC, Liu C, Sun X, Wang H, Magara T, Moon YJ (2015) The Role of Erupting Sigmoid in Triggering a Flare with Parallel and Large-scale Quasi-circular Ribbons . 812(1):50, doi:10.1088/0004-637X/812/1/50, 1509.01792
work page internal anchor Pith review Pith/arXiv arXiv doi:10.1088/0004-637x/812/1/50 2015
-
[22]
909(2):155, doi:10.3847/1538-4357/abe414, 2101.12395
Kaneko T, Park SH, Kusano K (2021) Data-driven MHD Simulation of Successive Solar Plasma Eruptions . 909(2):155, doi:10.3847/1538-4357/abe414, 2101.12395
-
[23]
974(2):168, doi:10.3847/1538-4357/ad6a54, 2408.06430
Kang Y, Kaneko T, Leka KD, Kusano K (2024) Data-driven MHD Simulation of the Formation of a Magnetic Flux Rope and an Inclined Solar Eruption . 974(2):168, doi:10.3847/1538-4357/ad6a54, 2408.06430
-
[24]
Kliem B, T \"o r \"o k T (2006) Torus Instability . 96(25):255002, doi:10.1103/PhysRevLett.96.255002, physics/0605217
work page internal anchor Pith review Pith/arXiv arXiv doi:10.1103/physrevlett.96.255002 2006
-
[25]
Lemen JR, Title AM, Akin DJ, Boerner PF, Chou C, Drake JF, Duncan DW, Edwards CG, Friedlaender FM, Heyman GF, Hurlburt NE, Katz NL, Kushner GD, Levay M, Lindgren RW, Mathur DP, McFeaters EL, Mitchell S, Rehse RA, Schrijver CJ, Springer LA, Stern RA, Tarbell TD, Wuelser JP, Wolfson CJ, Yanari C, Bookbinder JA, Cheimets PN, Caldwell D, Deluca EE, Gates R, G...
-
[26]
683(2):1192--1206, doi:10.1086/589738
Lynch BJ, Antiochos SK, DeVore CR, Luhmann JG, Zurbuchen TH (2008) Topological Evolution of a Fast Magnetic Breakout CME in Three Dimensions . 683(2):1192--1206, doi:10.1086/589738
-
[27]
Connecting the Sun and the Solar Wind: The Self-consistent Transition of Heating Mechanisms
Matsumoto T, Suzuki TK (2014) Connecting the Sun and the solar wind: the self-consistent transition of heating mechanisms . 440(2):971--986, doi:10.1093/mnras/stu310, 1402.0316
work page internal anchor Pith review Pith/arXiv arXiv doi:10.1093/mnras/stu310 2014
-
[28]
552(2):833--848, doi:10.1086/320559
Moore RL, Sterling AC, Hudson HS, Lemen JR (2001) Onset of the Magnetic Explosion in Solar Flares and Coronal Mass Ejections . 552(2):833--848, doi:10.1086/320559
-
[29]
Pesnell WD, Thompson BJ, Chamberlin PC (2012) The Solar Dynamics Observatory (SDO) . 275(1-2):3--15, doi:10.1007/s11207-011-9841-3
-
[30]
294(4):41, doi:10.1007/s11207-019-1430-x
Pomoell J, Lumme E, Kilpua E (2019) Time-dependent Data-driven Modeling of Active Region Evolution Using Energy-optimized Photospheric Electric Fields . 294(4):41, doi:10.1007/s11207-019-1430-x
-
[31]
Numerical simulations of quiet Sun magnetism: On the contribution from a small-scale dynamo
Rempel M (2014) Numerical Simulations of Quiet Sun Magnetism: On the Contribution from a Small-scale Dynamo . 789(2):132, doi:10.1088/0004-637X/789/2/132, 1405.6814
work page internal anchor Pith review Pith/arXiv arXiv doi:10.1088/0004-637x/789/2/132 2014
-
[32]
290(12):3457--3486, doi:10.1007/s11207-015-0712-1
Schmieder B, Aulanier G, Vr s nak B (2015) Flare-CME Models: An Observational Perspective (Invited Review) . 290(12):3457--3486, doi:10.1007/s11207-015-0712-1
-
[33]
Schou J, Scherrer PH, Bush RI, Wachter R, Couvidat S, Rabello-Soares MC, Bogart RS, Hoeksema JT, Liu Y, Duvall TL, Akin DJ, Allard BA, Miles JW, Rairden R, Shine RA, Tarbell TD, Title AM, Wolfson CJ, Elmore DF, Norton AA, Tomczyk S (2012) Design and Ground Calibration of the Helioseismic and Magnetic Imager (HMI) Instrument on the Solar Dynamics Observato...
-
[34]
235(1-2):161--190, doi:10.1007/s11207-006-0068-7
Schrijver CJ, De Rosa ML, Metcalf TR, Liu Y, McTiernan J, R \'e gnier S, Valori G, Wheatland MS, Wiegelmann T (2006) Nonlinear Force-Free Modeling of Coronal Magnetic Fields Part I: A Quantitative Comparison of Methods . 235(1-2):161--190, doi:10.1007/s11207-006-0068-7
-
[35]
Living Reviews in Solar Physics , keywords =
Shibata K, Magara T (2011) Solar Flares: Magnetohydrodynamic Processes . Living Reviews in Solar Physics 8(1):6, doi:10.12942/lrsp-2011-6
-
[36]
Shoda M, Suzuki TK, Asgari-Targhi M, Yokoyama T (2019) Three-dimensional Simulation of the Fast Solar Wind Driven by Compressible Magnetohydrodynamic Turbulence . 880(1):L2, doi:10.3847/2041-8213/ab2b45, 1905.11685
work page internal anchor Pith review Pith/arXiv arXiv doi:10.3847/2041-8213/ab2b45 2019
-
[37]
A Non-radial Eruption in a Quadrupolar Magnetic Configuration with a Coronal Null
Sun X, Hoeksema JT, Liu Y, Chen Q, Hayashi K (2012) A Non-radial Eruption in a Quadrupolar Magnetic Configuration with a Coronal Null . 757(2):149, doi:10.1088/0004-637X/757/2/149, 1208.1097
work page internal anchor Pith review Pith/arXiv arXiv doi:10.1088/0004-637x/757/2/149 2012
-
[38]
Hot Spine Loops and the Nature of a Late-Phase Solar Flare
Sun X, Hoeksema JT, Liu Y, Aulanier G, Su Y, Hannah IG, Hock RA (2013) Hot Spine Loops and the Nature of a Late-phase Solar Flare . 778(2):139, doi:10.1088/0004-637X/778/2/139, 1310.1438
work page internal anchor Pith review Pith/arXiv arXiv doi:10.1088/0004-637x/778/2/139 2013
-
[39]
890(2):103, doi:10.3847/1538-4357/ab6b1f, 2001.03721
Toriumi S, Takasao S, Cheung MCM, Jiang C, Guo Y, Hayashi K, Inoue S (2020) Comparative Study of Data-driven Solar Coronal Field Models Using a Flux Emergence Simulation as a Ground-truth Data Set . 890(2):103, doi:10.3847/1538-4357/ab6b1f, 2001.03721
-
[40]
V \"o gler A, Shelyag S, Sch \"u ssler M, Cattaneo F, Emonet T, Linde T (2005) Simulations of magneto-convection in the solar photosphere. Equations, methods, and results of the MURaM code . 429:335--351, doi:10.1051/0004-6361:20041507
-
[41]
970(2):168, doi:10.3847/1538-4357/ad41e3
Wang R, Fouhey DF, Higgins REL, Antiochos SK, Barnes G, Hoeksema JT, Leka KD, Liu Y, Schuck PW, Gombosi TI (2024) SuperSynthIA: Physics-ready Full-disk Vector Magnetograms from HMI, Hinode, and Machine Learning . 970(2):168, doi:10.3847/1538-4357/ad41e3
discussion (0)
Sign in with ORCID, Apple, or X to comment. Anyone can read and Pith papers without signing in.