REVIEW 2 major objections 4 minor 15 cited by
Reionization optical depth determination from Planck HFI data with ten percent accuracy
T0 review · 2 major / 4 minor · reviewed 2026-08-14 · deepseek-v4-flash
Pith's one-line read Re-analyzing Planck HFI data with an upgraded mapmaker, this paper measures the reionization optical depth as $\tau = 0.059 \pm 0.006$ (68% C.L.), a 10% measurement it argues is the strongest constraint to date.
desk verdict A careful, credible reanalysis that likely gives the tightest CMB tau so far, but the quoted error bar is set by the same systematics model the mapmaker fits, so treat 0.006 as an optimistic floor. read the letter →
The pith
A machine-rendered reading of the paper's core claim, the machinery that carries it, and where it could break.
The reading
What carries the argument
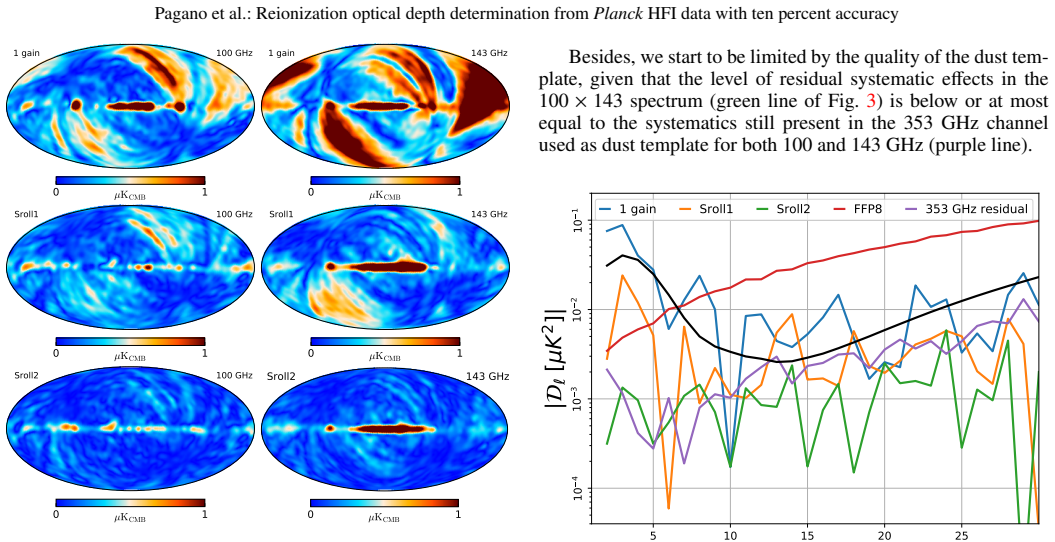
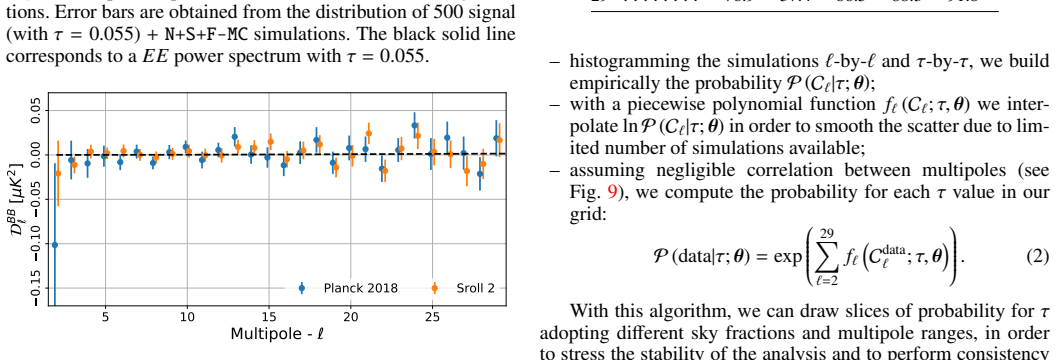
The load-bearing element is SRoll2, an upgraded version of the SRoll map-making code described in the companion paper. It corrects the second-order ADC non-linearity by fitting a two-dimensional spline per bolometer as a function of signal value and time, so that a single gain fits the entire mission and the temperature-to-polarization dipole leakage is removed. The analysis proceeds with the 100$\times$143 GHz EE cross-spectrum estimated with a quadratic maximum-likelihood estimator (QML) on a 50% sky mask, and a simulation-based likelihood, lowE-S2, constructed from 500 noise-plus-systematics-plus-foreground-residual Monte Carlo realizations, interpolated over a grid in $\tau$ with $10^9 A_s e^{-2\tau} = 1.875$ fixed.
What would settle it
Re-run the SRoll2 pipeline on simulated timelines with a known input $\tau = 0.051$ while injecting ADCNL residuals at twice the amplitude used in the published simulation set; if the recovered $\tau$ moves upward by the roughly 0.008 shift seen between Planck 2018 and SRoll2, the systematic estimate is under-correcting. Equivalently, an independent map-making code that does not use the SRoll2 spline model, applied to the same raw data, should reproduce the same EE quadrupole and octupole within the reported noise.
Extended reading notes
Core claim
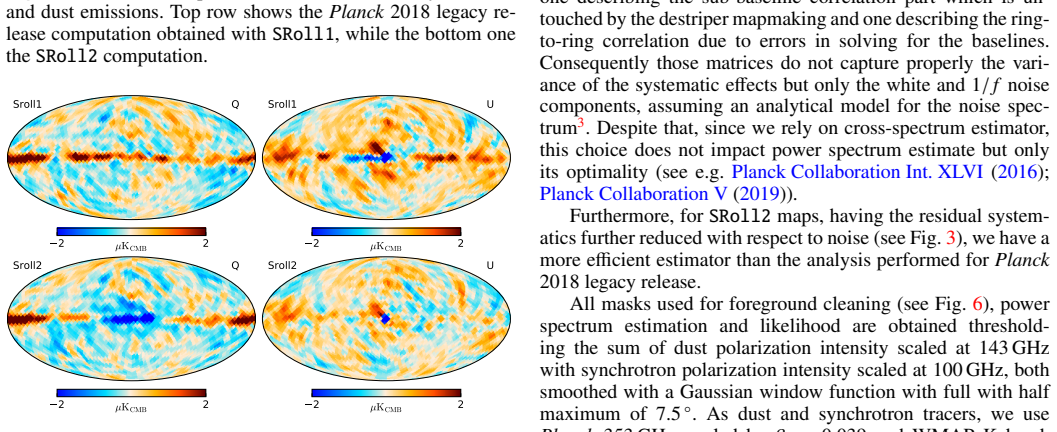
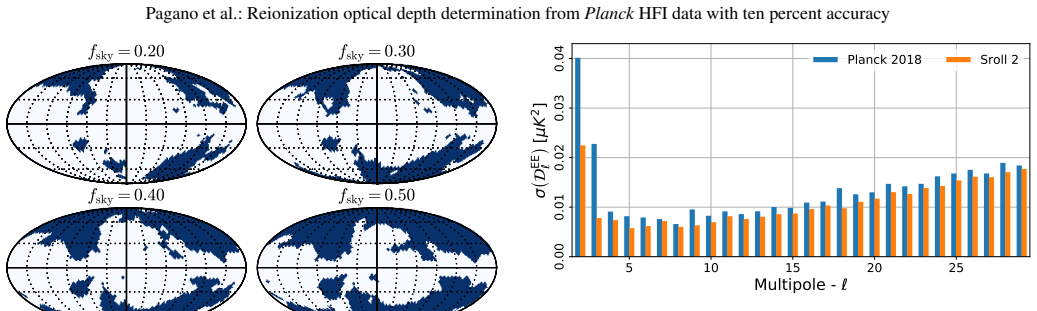
On the paper's own terms, the central discovery is that the second-order analogue-to-digital converter non-linearity in the Planck HFI readout chains, when modelled with a per-bolometer spline fit, removes the dipole-to-polarization leakage that dominated the lowest multipoles of the 2018 legacy maps; the cleaned 100$\times$143 GHz EE spectrum then gives $\tau = 0.0566^{+0.0053}_{-0.0062}$ from polarization alone. Combining the new lowE-S2 likelihood with Planck's low-$\ell$ Commander temperature likelihood and high-$\ell$ temperature and polarization likelihood gives $\tau = 0.059 \pm 0.006$ (68% C.L.), $z_{\rm re} = 8.14 \pm 0.61$, and $\sigma_8 = 0.8128 \pm 0.0053$. The paper states this is the strongest reionization optical depth constraint to date, with the uncertainty reduced by roughly 40% relative to the Planck 2018 legacy value $\tau = 0.051 \pm 0.009$; the central value shifts upward by about one $\sigma$ while the 95% upper limit stays near $\tau \lesssim 0.07$.
Load-bearing premise
The result assumes that the N+S+F-MC simulations, built with the same SRoll2 code and a simulated sky model, reproduce the real instrument's residual systematics faithfully; if the ADCNL model or the input sky is incomplete, the quoted error bars and the upward shift in $\tau$ would be underestimated.
Editorial extensions
If this is right
- The $\tau$ uncertainty drops to about 10%, which propagates to roughly 1% accuracy on the primordial fluctuation amplitude $A_s$ via the $A_s e^{-2\tau}$ degeneracy.
- The mid-point reionization redshift $z_{\rm re} = 8.14 \pm 0.61$ gives a direct CMB-side target for astrophysical models of early galaxy formation and for high-redshift galaxy surveys.
- Replacing the Planck 2018 lowE likelihood with lowE-S2 leaves the other $\Lambda$CDM parameters essentially unchanged, while tightening $\sigma_8$ to $0.8128 \pm 0.0053$ and slightly lowering the lensing amplitude parameter $A_L$ to $1.163 \pm 0.064$.
- Systematics no longer dominate the low-$\ell$ EE error budget: cosmic variance does, so further tightening from the same sky requires either more sky coverage or a different observable.
- The $\tau$ upper limit remains close to $0.07$ at 95% C.L., so the minimal one-parameter extensions of $\Lambda$CDM explored in the paper are not significantly affected.
Reading between the lines
- If the systematics estimates are right, an independent re-analysis of the same raw timelines with a map-making code that does not assume the SRoll2 spline model should reproduce the recovered quadrupole and octupole in EE within the reported errors; agreement would effectively close the map-making chapter of Planck HFI large-scale polarization.
- The same second-order ADC non-linearity correction strategy could be applied to other bolometric CMB instruments with similar readout chains, potentially cleaning their large-scale polarization before launch or in re-processing.
- The paper notes a semi-analytical likelihood is now feasible; because cosmic variance dominates the error budget, that likelihood should give nearly identical $\tau$ posteriors, and disagreement would flag a problem in the simulation-based estimate.
- If the true $\tau$ is near 0.059 rather than the earlier 0.051, reionization models need somewhat more ionizing photons around $z \sim 8$; future high-redshift observations should see a correspondingly earlier or more efficient reionization history.
Signed reviews
Editorial analysis
A structured set of objections, weighed in public.
Referee Report
Summary. This paper presents a new low-multipole polarization analysis of Planck HFI data using the SRoll2 map-making algorithm, which is designed to remove the second-order ADC nonlinearity (ADCNL) systematic that produces temperature-to-polarization dipole leakage. The authors build a 100x143 GHz EE cross-spectrum likelihood from an empirical distribution of signal plus N+S+F Monte Carlo simulations, and measure tau = 0.0566 (+0.0053, -0.0062) at 68% CL from the EE spectrum alone, with the external normalization 10^9 A_s e^{-2 tau} = 1.875. Combined with the Planck 2018 temperature and high-multipole polarization likelihoods, they report tau = 0.059 +/- 0.006, corresponding to z_re = 8.14 +/- 0.61 and sigma_8 = 0.8128 +/- 0.0053, and claim this is the strongest tau constraint to date with ten percent accuracy. The analysis includes extensive stability tests over sky fractions, multipole ranges, foreground templates, and null spectra.
Significance. If the systematics model is realistic, this is an important result: it reduces the Planck 2018 legacy-release uncertainty on tau by about 40% and breaks the A_s-e^{-2 tau} degeneracy more effectively, yielding a tight sigma_8 constraint. The paper is careful in its internal consistency checks: multiple masks, multipole cuts, alternative foreground tracers, and a large Monte Carlo suite are used, and the maps, simulations, and likelihood are made public. The main limitation is that the error budget and the claim that the ADCNL systematic is below noise are validated with simulations generated from the same ADCNL model that SRoll2 fits, so the quoted 10% uncertainty is conditional on the completeness of that model.
major comments (2)
- [§2, Figs. 1–3; §4 (N+S+F-MC)] The central claim that SRoll2 brings the second-order ADCNL dipole-leakage systematic below the noise level is established with simulated timelines that contain exactly the ADCNL model fitted by SRoll2 and are then processed with SRoll2 itself. This is a self-consistency test, not an independent validation of the completeness of the ADCNL model or the realism of the simulated instrument noise. The empirical likelihood and the quoted 68% errors in Eq. (3) are built from N+S+F-MC simulations generated with the same model, so the error budget inherits the same assumption; the data-based PTE tests in Table 2 are also computed against the same simulations. The persistent poor PTEs of the null TE spectra reported in Section 4 are a data-side indication that the systematics model may not be complete. I therefore ask for a quantitative robustness test, for example rerunning the tau likelihood with residual maps from a deliberately different ADCNL model (varied spline flexibility or amplitude, or SRoll1 maps) and reporting the induced shift in tau, or adding an explicit model-error contribution to the error budget. Without such a test, the headline 10% error bar rests on a single assumed systematics model.
- [§4, TE-only result] The TE-only measurement tau = 0.057 (+0.012, -0.013) is presented as confirmation of the EE result, but the same paragraph states that the poor PTEs of the null TE spectra persist in this data version. Because the TE analysis uses the Commander temperature map based on SRoll1, the TE anomaly may not directly affect the EE pipeline, but the claim of an independent confirmation is weakened. Please quantify the sensitivity of the headline tau to the multipoles or angular scales most affected by the TE anomaly, for example by truncating the EE likelihood at l_min = 4 or 6, or by masking the regions where the TE null PTE is lowest, and state explicitly whether the anomaly is attributed to the temperature map or to residual polarization systematics, with a supporting test.
minor comments (4)
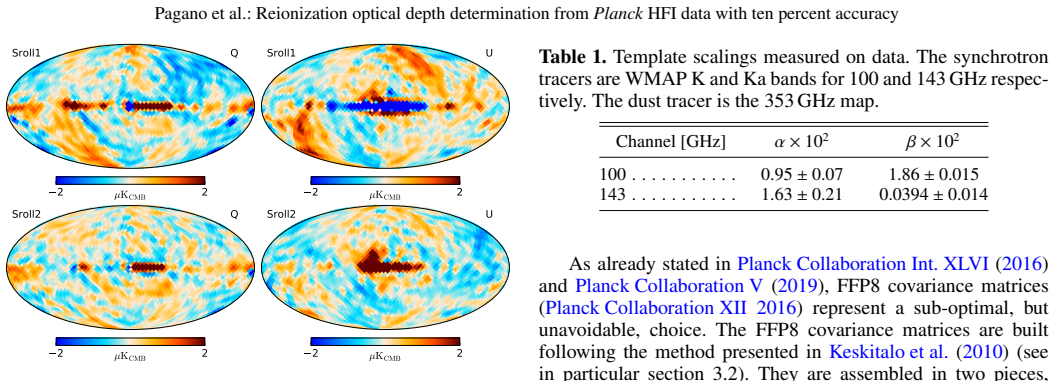
- [Table 1] The beta column header appears inconsistent with the entries: with the label beta x 10^2, the 100 GHz entry 1.86 gives beta = 0.0186, while the 143 GHz entry 0.0394 would give beta = 3.94 x 10^-4, contradicting the text's statement that the dust tracer is scaled by beta = 0.039. Please clarify the units or correct the typo.
- [§4 and Eq. (2)] The empirical likelihood is built from 500 simulations per tau value with piecewise-polynomial interpolation; the paper does not report how sensitive the final tau interval is to the number of simulations or to the interpolation order. A brief convergence statement would strengthen the result.
- [Figure 9] The correlation-matrix values in Figure 9 are very hard to read in the printed version; a color map with labeled axes would be much clearer and would make the claimed near-diagonality more immediately apparent.
- [Abstract and §4] The standalone EE value tau = 0.0566 is conditional on the fixed external normalization 10^9 A_s e^{-2 tau} = 1.875; this is disclosed in Section 4 but should be stated explicitly in the abstract or in the sentence quoting the standalone value, to avoid the impression that it comes from polarization data alone.
Circularity Check
Tau measurement is data-driven, but the systematics validation and error budget are self-referential: the ADCNL model fitted by SRoll2 is also the model used in the simulations that claim residuals are below noise.
-
other
[Section 2, Figs. 1-3; Section 3-4, N+S+F-MC likelihood construction]
"New ADCNL correction is obtained by fitting the residuals with a bi-dimensional spline model per bolometer... Figure 1 shows polarization intensity maps ... obtained simulating realistic sky signal affected by ADCNL and projected with SRoll1 and SRoll2 codes. ... The simulated timelines contain dipole, sky signal, systematic effects and electronic noise only. ... The same cleaning procedure is applied to a set of 500 Monte Carlo simulations containing realistic sky signal, noise and systematic effects."
The spline model used to correct ADCNL is fitted by the same SRoll2 algorithm; the simulations in Figs. 1-3 are generated with that exact fitted model and then processed with the same code, so the 'below the noise level' residuals demonstrate only that SRoll2 removes its own assumed systematic, not that the ADCNL model is complete. The N+S+F-MC simulations that define the empirical likelihood and the quoted ±0.006 uncertainty inherit this same fitted model, so the 10% accuracy claim is not validated against unmodeled systematics. The tau central value is measured from real maps rather than constructed from the model, so the circularity is partial and limited to the error budget and systematics claim.
full rationale
The central tau estimate is obtained by applying a QML cross-spectrum estimator to real 100x143 GHz SRoll2 maps and comparing with an empirical likelihood, so tau is not equal to any fitted input by construction. The fixed normalization 10^9 A_s e^{-2tau}=1.875 is an external input that does not determine tau. The main circularity burden is the self-referential ADCNL validation: the mapmaker's fitted ADCNL model is also the systematic injected into the simulations used to claim systematics are below noise and to build the N+S+F-MC error distribution. This makes the uncertainty estimate and the 'below noise' claim consistency checks of the assumed model rather than independent verifications, warranting a mild score of 2; the persistent TE null anomaly noted by the authors reinforces this as a correctness risk, not a further circularity.
Assumptions & free parameters
free parameters (6)
- alpha_100 (synchrotron template scaling for 100 GHz) =
0.0095 ± 0.0007
- beta_100 (dust template scaling for 100 GHz) =
0.0186 ± 0.00015
- alpha_143 (synchrotron template scaling for 143 GHz) =
0.0163 ± 0.0021
- beta_143 (dust template scaling for 143 GHz) =
0.000394 ± 0.00014
- Diagonal regularization noise added to covariance =
20 nK
- Baseline sky fraction for tau measurement =
f_sky = 0.50
assumptions (6)
- domain assumption 10^9 A_s e^{-2 tau} = 1.875 is fixed when building the EE-only likelihood.
- domain assumption The other LambdaCDM parameters are fixed to the Planck 2018 best fit when sampling tau from the EE spectrum.
- domain assumption FFP8 covariance matrices adequately describe the noise of the QML estimator.
- domain assumption Multipoles l = 2 to 29 are negligibly correlated in the tau likelihood.
- domain assumption Residual foregrounds after template cleaning are negligible at low multipoles.
- domain assumption The N+S+F-MC simulations faithfully represent the noise, systematics, and foreground residuals in SRoll2 maps.
Cite this review
Pith. "Pith review of Reionization optical depth determination from Planck HFI data with ten percent accuracy." pith.science (2026). https://pith.science/paper/TY3G7YQN
@misc{pith2026190809856,
  author       = {Pith},
  title        = {Pith review of: Reionization optical depth determination from Planck HFI data with ten percent accuracy},
  year         = {2026},
  howpublished = {\url{https://pith.science/paper/TY3G7YQN}},
  note         = {Machine review of arXiv:1908.09856}
}
abstract
We present an estimation of the reionization optical depth $\tau$ from an improved analysis of the High Frequency Instrument (HFI) data of Planck satellite. By using an improved version of the HFI map-making code, we greatly reduce the residual large scale contamination affecting the data, characterized, but not fully removed, in the Planck 2018 legacy release. This brings the dipole distortion systematic effect, contaminating the very low multipoles, below the noise level. On large scale polarization only data, we measure $\tau=0.0566_{-0.0062}^{+0.0053}$ at $68\%$ C.L., reducing the Planck 2018 legacy release uncertainty by $\sim40\%$. Within the $\Lambda$CDM model, in combination with the Planck large scale temperature likelihood, and the high-$\ell$ temperature and polarization likelihood, we measure $\tau=0.059\pm0.006$ at $68\%$ C.L. which corresponds to a mid-point reionization redshift of $z_{\rm re}=8.14\pm0.61$ at $68\%$ C.L.. This estimation of the reionization optical depth with $10\%$ accuracy is the strongest constraint to date.
Figures

Figures from the paper (11 more)







Forward citations
Cited by 15 Pith papers
-
Forest without Trees is still Fruitful: Constraints on the thermal state of the neutral IGM at $z\approx5.6$ with the 21-cm forest power spectrum
A null detection of the 21-cm forest toward quasar J352–15 at z≈5.8 disfavors very cold and substantially neutral intergalactic gas, giving the first observational constraints from a 21-cm forest power spectrum.
-
Boosting the optical depth to Thomson scattering with primordial black hole evaporation at high redshift
A monochromatic primordial black hole population can raise the CMB optical depth by at most Delta tau ~ 0.008 under current CMB data, leaving BAO-CMB tensions essentially unchanged.
-
DESI DR2 Results IV: Alcock-Paczy\'nski Measurements from the Lyman Alpha Forest and Cosmological Constraints
The full shape of DESI DR2 Lyman-alpha forest correlations constrains the distance ratio DM/DH at z=2.33 to 1.0%, twice as precise as BAO alone.
-
No way ou$\tau$: Epoch of Reionization Observations Do not Support Large Values of the Optical Depth to Reionization
Epoch-of-reionization hydrogen probes, combined with CMB and BAO data but no CMB polarization, yield tau_reio = 0.067 +/- 0.011 and leave the dynamical-dark-energy preference at ~2 sigma.
-
Measuring Cosmic Neutrino Masses Independently of Dark Energy
Two dark-energy-robust cosmological routes bound ∑mν to <0.152 eV (marginalized) and <0.41 eV (late-Universe-free), with the latter independent of tested w(a) models by construction.
-
The $H_0$ world cup. II. A comprehensive competition between proposed Hubble tension solutions
Against a common 2025-26 dataset (Planck PR4, ACT DR6, SPT-3G, DESI DR2, Pantheon+), early dark energy and early modified gravity models win the H0 competition (~3σ residual tension), while radiation and late-time sol...
-
Cosmological Concordance in an Especially Opaque Universe: A Tentative Cosmological Detection of Physical Neutrino Mass in $\Lambda$CDM
Imposing a high prior on τ = 0.11 ± 0.006 produces a 2σ positive neutrino mass sum of 0.10 eV and restores concordance between CMB and DESI data inside ΛCDM.
-
Beyond thermal approximations: Precise cosmological bounds on Axion-Like Particles
Solving the momentum-dependent Boltzmann equation and propagating the exact non-thermal ALP spectrum into CMB analyses yields 95% limits f_a>1.63e6 GeV (e), 9.41e6 GeV (mu), 8.06e4 GeV (tau), and g_a_gamma<1.98e-8 GeV^-1.
-
Cosmological neutrino mass: a frequentist overview in light of DESI
A frequentist profile-likelihood analysis of DESI, Planck, ACT, and eBOSS Lyman-alpha data yields Σmν < 53 meV (95% C.L.) in flat ΛCDM and a CMB-independent bound of 285 meV.
-
Cosmology from Planck CMB Lensing and DESI DR1 Quasar Tomography
DESI DR1 quasars cross-correlated with Planck PR4 lensing give sigma8 = 0.929 and S8 = 0.922, about 1.5 sigma above Planck's LCDM prediction, and a sound-horizon-free H0 = 69.1 km/s/Mpc.
-
Impact of ACT DR6 and DESI DR2 for Early Dark Energy and the Hubble tension
With ACT DR6 and DESI DR2, early dark energy still reconciles CMB and local Hubble measurements to about 2 sigma, and a profile likelihood shows prior-volume effects in Bayesian limits.
-
Cosmological implications of DESI DR2 BAO measurements in light of the latest ACT DR6 CMB data
Adding ACT DR6 data to DESI DR2 BAO keeps the roughly 3 sigma preference for evolving dark energy and, for the baseline Planck+ACT combination, reports a neutrino mass limit below 0.061 eV.
-
The $H_0$ World Cup. I. Summary of the baseline group stage results
In a systematic head-to-head analysis, early dark energy and early modified gravity models reduce the Hubble tension to about 3σ and are favored over ΛCDM, while radiation and late-time alternatives are not.
-
Running of the spectral index: Reconciling the CMB with the Lyman-$\alpha$ Forest
Combining Planck, ACT, SPT-3G and eBOSS data, the authors report a ~2σ preference for a nonzero second derivative of the primordial spectral index and show that featureful inflationary potentials fit the data better t...
-
Late Time Dynamical Dark Energy and the CMB-Distance Ladder Tension
The SNIa absolute-magnitude tension between the distance ladder (−19.204) and CMB+ΛCDM (−19.430) is independent of late-time expansion history, and DESI's w0–wa dark-energy hints shift H0 by only ~0.3–0.4 km/s/Mpc.
Reference graph
Works this paper leans on
-
[1]
, " * write output.state after.block = add.period write newline
ENTRY address author booktitle chapter edition editor eprint howpublished institution journal key month note number organization pages publisher school series title type volume year label extra.label sort.label short.list INTEGERS output.state before.all mid.sentence after.sentence after.block FUNCTION init.state.consts #0 'before.all := #1 'mid.sentence ...
-
[2]
" write newline "" before.all 'output.state := FUNCTION n.dashify 't := "" t empty not t #1 #1 substring "-" = t #1 #2 substring "--" = not "--" * t #2 global.max substring 't := t #1 #1 substring "-" = "-" * t #2 global.max substring 't := while if t #1 #1 substring * t #2 global.max substring 't := if while FUNCTION word.in bbl.in " " * FUNCTION format....
-
[3]
Becker, R. H. et al. , Evidence for Reionization at Z 6: Detection of a Gunn-Peterson trough in a Z = 6.28 Quasar . 2001, Astron. J., 122, 2850, astro-ph/0108097
arXiv 2001
-
[4]
Benabed, K., Cardoso, J. F., Prunet, S., & Hivon, E., TEASING: a fast and accurate approximation for the low multipole likelihood of the Cosmic Microwave Background temperature . 2009, Mon. Not. Roy. Astron. Soc., 400, 219, 0901.4537
work page Pith review arXiv 2009
-
[5]
Bennett , C. L., Larson , D., Weiland , J. L., et al. , Nine-year Wilkinson Microwave Anisotropy Probe (WMAP) Observations: Final Maps and Results . 2013, , 208, 20, 1212.5225
arXiv 2013
-
[6]
Bouwens, R. J., Illingworth, G. D., Oesch, P. A., et al. , Reionization after Planck: The Derived Growth of the Cosmic Ionizing Emissivity now matches the Growth of the Galaxy UV Luminosity Density . 2015, Astrophys. J., 811, 140, 1503.08228
arXiv 2015
-
[7]
Catalano, A., Coulais, A., & Lamarre, J.-M., Analytical approach to optimizing alternating current biasing of bolometers. 2010, Appl. Opt., 49, 5938
work page 2010
-
[8]
& Ferrara, A., Early galaxy formation and its large-scale effects
Dayal, P. & Ferrara, A., Early galaxy formation and its large-scale effects . 2018, Phys. Rept., 780-782, 1, 1809.09136
arXiv 2018
Show all 52 references
-
[9]
M., Pagano, L., Mottet, S., Puget, J
Delouis, J. M., Pagano, L., Mottet, S., Puget, J. L., & Vibert, L., SRoll2: an improved mapmaking approach to reduce large-scale systematic effects in the Planck High Frequency Instrument legacy maps . 2019, Astron. Astrophys., 629, A38, 1901.11386
2019 arXiv
-
[10]
2006, , 370, 343, astro-ph/0601107
Efstathiou , G., Hybrid estimation of cosmic microwave background polarization power spectra . 2006, , 370, 343, astro-ph/0601107
2006 arXiv
-
[11]
A., Becker, R
Fan, X.-H., Strauss, M. A., Becker, R. H., et al. , Constraining the evolution of the ionizing background and the epoch of reionization with z 6 quasars. 2. a sample of 19 quasars . 2006, Astron. J., 132, 117, astro-ph/0512082
2006 arXiv
-
[12]
P., Davis, M., & Schlegel, D
Finkbeiner, D. P., Davis, M., & Schlegel, D. J., Extrapolation of galactic dust emission at 100 microns to CMBR frequencies using FIRAS . 1999, Astrophys. J., 524, 867, astro-ph/9905128
1999 arXiv
-
[13]
, Likelihood methods for CMB experiments
Gerbino, M., Lattanzi, M., Migliaccio, M., et al. , Likelihood methods for CMB experiments . 2019, 1909.09375
2019 arXiv
-
[14]
M., Hivon , E., Banday , A
G \'o rski , K. M., Hivon , E., Banday , A. J., et al. , HEALPix: A Framework for High-Resolution Discretization and Fast Analysis of Data Distributed on the Sphere . 2005, , 622, 759, astro-ph/0409513
2005 arXiv
-
[15]
Gunn, J. E. & Peterson, B. A., On the Density of Neutral Hydrogen in Intergalactic Space . 1965, Astrophys. J., 142, 1633
1965
-
[16]
& Lewis, A., Likelihood Analysis of CMB Temperature and Polarization Power Spectra
Hamimeche, S. & Lewis, A., Likelihood Analysis of CMB Temperature and Polarization Power Spectra . 2008, Phys. Rev., D77, 103013, 0801.0554
2008 arXiv
-
[17]
, Nine-year Wilkinson Microwave Anisotropy Probe (WMAP) Observations: Cosmological Parameter Results
Hinshaw , G., Larson , D., Komatsu , E., et al. , Nine-year Wilkinson Microwave Anisotropy Probe (WMAP) Observations: Cosmological Parameter Results . 2013, , 208, 19, 1212.5226
2013 arXiv
-
[18]
M., Netterfield, C
Hivon, E., Gorski, K. M., Netterfield, C. B., et al. , Master of the cosmic microwave background anisotropy power spectrum: a fast method for statistical analysis of large and complex cosmic microwave background data sets . 2002, Astrophys. J., 567, 2, astro-ph/0105302
2002 arXiv
-
[19]
A., Bock , J
Holmes , W. A., Bock , J. J., Crill , B. P., et al. , Initial test results on bolometers for the Planck high frequency instrument . 2008, , 47, 5996
2008
-
[20]
Keskitalo , R., Ashdown , M. A. J., Cabella , P., et al. , Residual noise covariance for Planck low-resolution data analysis . 2010, , 522, A94, 0906.0175
2010 arXiv
-
[21]
N., Barnes , C., et al
Kogut , A., Spergel , D. N., Barnes , C., et al. , First-Year Wilkinson Microwave Anisotropy Probe (WMAP) Observations: Temperature-Polarization Correlation . 2003, , 148, 161, astro-ph/0302213
2003 arXiv
-
[22]
, On the impact of large angle CMB polarization data on cosmological parameters
Lattanzi, M., Burigana, C., Gerbino, M., et al. , On the impact of large angle CMB polarization data on cosmological parameters . 2017, JCAP, 1702, 041, 1611.01123
2017 arXiv
-
[23]
& Bridle, S., Cosmological parameters from CMB and other data: A Monte Carlo approach
Lewis, A. & Bridle, S., Cosmological parameters from CMB and other data: A Monte Carlo approach . 2002, , 66, 103511, astro-ph/0205436
2002 arXiv
-
[24]
2000, , 538, 473, astro-ph/9911177
Lewis, A., Challinor, A., & Lasenby, A., Efficient computation of CMB anisotropies in closed FRW models . 2000, , 538, 473, astro-ph/9911177
2000 arXiv
-
[25]
2015, Mon
Mangilli, A., Plaszczynski, S., & Tristram, M., Large-scale cosmic microwave background temperature and polarization cross-spectra likelihoods . 2015, Mon. Not. Roy. Astron. Soc., 453, 3174, 1503.01347
2015 arXiv
-
[26]
, Three-Year Wilkinson Microwave Anisotropy Probe (WMAP) Observations: Polarization Analysis
Page , L., Hinshaw , G., Komatsu , E., et al. , Three-Year Wilkinson Microwave Anisotropy Probe (WMAP) Observations: Polarization Analysis . 2007, , 170, 335, astro-ph/0603450
2007 arXiv
-
[27]
Pajot , F., Ade , P. A. R., Beney , J., et al. , Planck pre-launch status: HFI ground calibration . 2010, , 520, A10
2010
-
[28]
2013, The Explanatory Supplement to the Planck 2013 results, https://www.cosmos.esa.int/web/planck/pla ( ESA )
Planck Collaboration ES . 2013, The Explanatory Supplement to the Planck 2013 results, https://www.cosmos.esa.int/web/planck/pla ( ESA )
2013
-
[29]
2015, The Explanatory Supplement to the \ 2015 results, https://www.cosmos.esa.int/web/planck/pla ( ESA )
Planck Collaboration ES . 2015, The Explanatory Supplement to the \ 2015 results, https://www.cosmos.esa.int/web/planck/pla ( ESA )
2015
-
[30]
2018, The Legacy Explanatory Supplement, https://www.cosmos.esa.int/web/planck/pla https://www.cosmos.esa.int/web/planck/pla ( ESA )
Planck Collaboration ES . 2018, The Legacy Explanatory Supplement, https://www.cosmos.esa.int/web/planck/pla https://www.cosmos.esa.int/web/planck/pla ( ESA )
2018
-
[31]
Planck Collaboration 2014O Planck Collaboration XV , Planck 2013 results. XV. CMB power spectra and likelihood . 2014, , 571, A15, 1303.5075
2013 arXiv
-
[32]
Planck Collaboration 2014P Planck Collaboration XVI , Planck 2013 results. XVI. Cosmological parameters . 2014, , 571, A16, 1303.5076
2013 arXiv
-
[33]
Planck Collaboration 2015H Planck Collaboration VIII , Planck 2015 results. VIII. High Frequency Instrument data processing: Calibration and maps . 2016, , 594, A8, 1502.01587
2015 arXiv
-
[34]
Planck Collaboration 2015K Planck Collaboration XI , Planck 2015 results. XI. CMB power spectra, likelihoods, and robustness of parameters . 2016, , 594, A11, 1507.02704
2015 arXiv
-
[35]
Planck Collaboration 2015L Planck Collaboration XII , Planck 2015 results. XII. Full Focal Plane simulations . 2016, , 594, A12, 1509.06348
2015 arXiv
-
[36]
Planck Collaboration 2015M Planck Collaboration XIII , Planck 2015 results. XIII. Cosmological parameters . 2016, , 594, A13, 1502.01589
2015 arXiv
-
[37]
Planck Collaboration 2018B Planck Collaboration II , Planck 2018 results. II. Low Frequency Instrument data processing . 2019, , in press, 1807.06206
2018 arXiv
-
[38]
Planck Collaboration 2018C Planck Collaboration III , Planck 2018 results. III. High Frequency Instrument data processing . 2019, , in press, 1807.06207
2018 arXiv
-
[39]
Planck Collaboration 2018D Planck Collaboration IV , Planck 2018 results. IV. Diffuse component separation . 2019, , in press, 1807.06208
2018 arXiv
-
[40]
Planck Collaboration 2018E Planck Collaboration V , Planck 2018 results. V. Power spectra and likelihoods . 2019, , submitted, 1907.12875
2018 arXiv
-
[41]
Planck Collaboration 2018F Planck Collaboration VI , Planck 2018 results. VI. Cosmological parameters . 2019, , submitted, 1807.06209
2018 arXiv
-
[42]
Planck Collaboration 2018H Planck Collaboration VIII , Planck 2018 results. VIII. Gravitational lensing . 2019, , in press, 1807.06210
2018 arXiv
-
[43]
XLVI , Planck intermediate results
Planck Collaboration IntZU Planck Collaboration Int. XLVI , Planck intermediate results. XLVI. Reduction of large-scale systematic effects in HFI polarization maps and estimation of the reionization optical depth . 2016, , 596, A107, 1605.02985
2016 arXiv
-
[44]
XLVII , Planck intermediate results
Planck Collaboration IntZV Planck Collaboration Int. XLVII , Planck intermediate results. XLVII. Constraints on reionization history . 2016, , 596, A108, 1605.03507
2016 arXiv
-
[45]
LI , Planck intermediate results
Planck Collaboration IntZZA Planck Collaboration Int. LI , Planck intermediate results. LI. Features in the cosmic microwave background temperature power spectrum and shifts in cosmological parameters . 2017, , 607, A95, 1608.02487
2017 arXiv
-
[46]
1998, Ann
Rauch, M., The lyman alpha forest in the spectra of quasistellar objects . 1998, Ann. Rev. Astron. Astrophys., 36, 267, astro-ph/9806286
1998 arXiv
-
[47]
Scheuer , P. A. G., A Sensitive Test for the Presence of Atomic Hydrogen in Intergalactic Space . 1965, , 207, 963
1965
-
[48]
1996, , 280, 299, astro-ph/9412064
Tegmark , M., A method for extracting maximum resolution power spectra from microwave sky maps . 1996, , 280, 299, astro-ph/9412064
1996 arXiv
-
[49]
& de Oliveira-Costa, A., How to measure CMB polarization power spectra without losing information
Tegmark, M. & de Oliveira-Costa, A., How to measure CMB polarization power spectra without losing information . 2001, Phys. Rev., D64, 063001, astro-ph/0012120
2001 arXiv
-
[50]
F., Renault, C., & Santos, D., Xspect, estimation of the angular power spectrum by computing cross power spectra
Tristram, M., Macias-Perez, J. F., Renault, C., & Santos, D., Xspect, estimation of the angular power spectrum by computing cross power spectra . 2005, Mon. Not. Roy. Astron. Soc., 358, 833, astro-ph/0405575
2005 arXiv
-
[51]
2018, Phys
Vanneste, S., Henrot-Versillé, S., Louis, T., & Tristram, M., Quadratic estimator for CMB cross-correlation . 2018, Phys. Rev., D98, 103526, 1807.02484
2018 arXiv
-
[52]
L., Osumi, K., Addison, G
Weiland, J. L., Osumi, K., Addison, G. E., et al. , Effect of Template Uncertainties on the WMAP and Planck Measures of the Optical Depth Due To Reionization . 2018, Astrophys. J., 863, 161, 1801.01226
2018 arXiv
Reviewed August 14, 2026 · model on record in the stance chip above.
Discussion (0). Continue with ORCID to comment.