REVIEW 2 major objections 1 minor 1 cited by
ATWL: A Formal Language for Representing, Comparing, and Reusing Visual Analytics Workflows
T0 review · 2 major / 1 minor · reviewed 2026-06-29 · grok-4.3
Pith's one-line read ATWL formally represents visual analytics workflows as sequences of eight artifact types and standardized transform intents so they can be compared and reused.
desk verdict ATWL gives a concrete ontology and extraction method for VA workflows that reveals some patterns, but its claim to capture arbitrary workflows rests only on fitting 17 examples with no test for coverage gaps. read the letter →
The pith
A machine-rendered reading of the paper's core claim, the machinery that carries it, and where it could break.
The reading
What carries the argument
The modular ontology of exactly eight artifact types paired with a fixed vocabulary of transform intents that together encode both the data-flow structure and the analytical purpose of each workflow step.
What would settle it
A published visual analytics workflow whose structure or intent cannot be expressed using only the eight defined artifact types and the listed transform intents without adding new types or intents.
Extended reading notes
Core claim
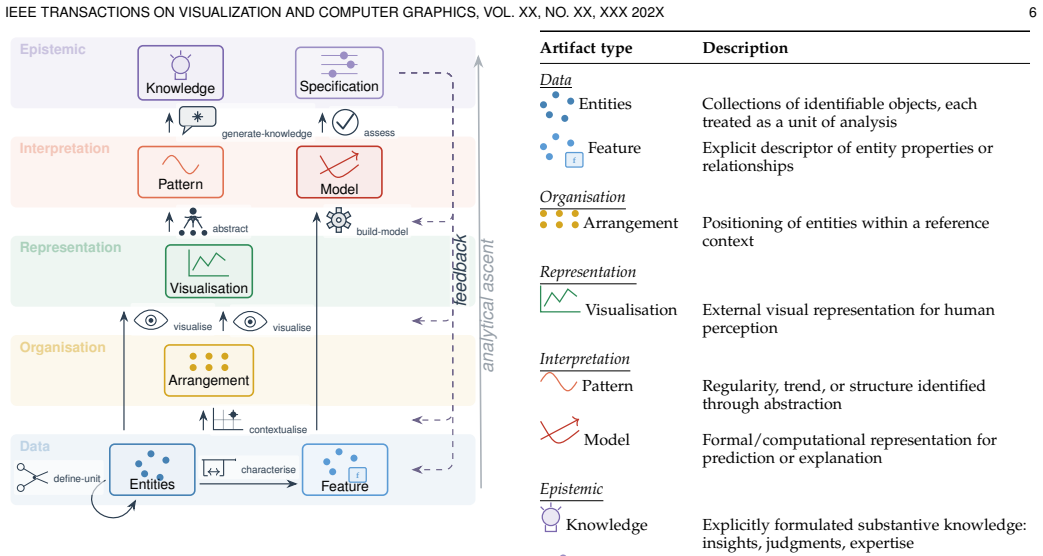
ATWL is a domain-agnostic declarative language built on a modular ontology of eight artifact types (entities, features, arrangements, visualisations, patterns, models, knowledge, specifications) and transforms characterised by standardised intents such as define-unit, characterise, contextualise, and abstract. It captures the structure and underlying analytical intent of VA workflows, allowing systematic comparison across papers and domains plus reuse of proven strategies. Extraction of seventeen workflows from research papers reveals a recurrent meta-structure, recurring motifs, reusable building blocks, diverse iterative strategies, and cross-domain equivalences that remain invisible in pr
Load-bearing premise
The eight artifact types together with the chosen set of transform intents are enough to represent the structure and intent of any visual analytics workflow without significant loss or distortion.
Editorial extensions
If this is right
- Workflows become directly comparable across different papers and application domains.
- Proven analytical strategies can be extracted, stored, and adapted as modular fragments.
- LLM-assisted extraction reduces the human effort needed to build libraries of formal workflows.
- Formal representations supply explicit iteration structure, typed data flow, and fragment provenance that prose descriptions omit.
- Libraries of ATWL workflows remain compact enough to fit inside LLM context windows where full paper collections do not.
Reading between the lines
- A shared repository of ATWL workflows could support automated recommendation or synthesis of new analysis pipelines.
- The same ontology approach might be tested on machine-learning or data-science pipelines outside visual analytics.
- Standardised workflow encodings could become a reporting requirement that improves reproducibility in visual analytics publications.
- Domain experts might later propose controlled extensions to the eight-type ontology once a larger corpus has been encoded.
Editorial analysis
A structured set of objections, weighed in public.
Referee Report
Summary. The manuscript introduces the Artifact-Transform Workflow Language (ATWL), a domain-agnostic declarative language for formally representing visual analytics workflows. ATWL is defined via a modular ontology of exactly eight artifact types (entities, features, arrangements, visualisations, patterns, models, knowledge, specifications) together with standardised transform intents (e.g., define-unit, characterise, contextualise, abstract). The authors describe an LLM-supervised extraction process that reduces human effort to review and refinement, apply it to construct a library of 17 workflows drawn from published VA papers, identify cross-workflow structural regularities invisible in prose, and report a controlled experiment in which the same LLM produces recommendations when supplied either the original papers or the ATWL library, claiming systematic advantages for the formal form in iteration structure, typed data flow, adaptation provenance, and compactness.
Significance. If the ontology proves adequate, ATWL would support systematic comparison, reuse, and formalisation of analytical knowledge across visual analytics, with potential benefits for training and cross-domain transfer. The work merits explicit credit for the construction of a 17-workflow library and for the controlled LLM experiment that isolates differences in output structure and provenance between prose and formal representations. The absence of quantitative metrics in the experiment, however, limits the strength of the utility claims.
major comments (2)
- [Abstract (ontology description)] Abstract (ontology description): the central claim that ATWL enables a transition to formally represented, comparable, and reusable analytical knowledge without material loss or distortion rests on the assertion that the fixed eight-artifact ontology plus fixed transform intents is sufficient for arbitrary VA workflows. This is demonstrated only by successful extraction of the 17 workflows; the extraction process itself presupposes adequacy, and no independent test or search for a workflow requiring a ninth artifact type or additional intent is reported. If such a workflow exists, the representation would omit or distort the original intent, directly undermining the transition claim.
- [Evaluation experiment (controlled LLM comparison)] Evaluation experiment (controlled LLM comparison): the experiment reports that ATWL representations yield more explicit iteration structure, typed data flow, fragment-level adaptation provenance, and compactness, yet supplies no quantitative metrics, controls, statistical tests, or raw data. Without these, it is impossible to assess whether the reported advantages are robust or sensitive to post-hoc choices in prompt construction or output interpretation.
minor comments (1)
- [Extraction process] The manuscript would benefit from an explicit statement of the precise criteria used to decide that a workflow had been successfully captured by the eight artifact types.
Simulated Author's Rebuttal
We thank the referee for the constructive and detailed comments, which help clarify the evidential basis for our claims. We respond point-by-point to the two major comments below.
read point-by-point responses
-
Referee: [Abstract (ontology description)] Abstract (ontology description): the central claim that ATWL enables a transition to formally represented, comparable, and reusable analytical knowledge without material loss or distortion rests on the assertion that the fixed eight-artifact ontology plus fixed transform intents is sufficient for arbitrary VA workflows. This is demonstrated only by successful extraction of the 17 workflows; the extraction process itself presupposes adequacy, and no independent test or search for a workflow requiring a ninth artifact type or additional intent is reported. If such a workflow exists, the representation would omit or distort the original intent, directly undermining the transition claim.
Authors: We agree that the sufficiency of the eight-artifact ontology is foundational to the claim of lossless formalisation. The extraction of 17 workflows from diverse published VA papers, without requiring additional artifact types, supplies empirical support for adequacy within the sampled set. We acknowledge that this does not constitute an exhaustive or independent search for counterexamples. In revision we will add an explicit discussion of ontology extensibility (how a ninth type could be introduced modularly) and will qualify the central claim to state that the ontology has been shown adequate for the 17 extracted workflows rather than asserted as sufficient for all possible VA workflows. revision: partial
-
Referee: [Evaluation experiment (controlled LLM comparison)] Evaluation experiment (controlled LLM comparison): the experiment reports that ATWL representations yield more explicit iteration structure, typed data flow, fragment-level adaptation provenance, and compactness, yet supplies no quantitative metrics, controls, statistical tests, or raw data. Without these, it is impossible to assess whether the reported advantages are robust or sensitive to post-hoc choices in prompt construction or output interpretation.
Authors: The referee is correct that the experiment is presented qualitatively and lacks quantitative metrics or statistical tests. The design intentionally emphasised observable structural differences (iteration explicitness, typed flows, provenance granularity) that are difficult to reduce to single scalar metrics. We will revise the section to include: (i) the precise prompts employed, (ii) tabulated counts of explicit iteration steps and data-flow connections across the paired outputs, and (iii) the full set of LLM responses as supplementary material. These additions will allow readers to evaluate robustness and sensitivity to prompt choices. revision: yes
Circularity Check
No significant circularity detected
full rationale
The paper defines ATWL declaratively via a chosen modular ontology (eight artifact types and fixed transform intents) and then applies it to extract and analyze 17 workflows from published papers. This is a definitional artifact followed by demonstration on an external corpus, not a derivation in which a claimed result or prediction reduces by construction to the inputs (no fitted parameters renamed as predictions, no self-definitional loops in equations, and no load-bearing self-citation chains). The controlled experiment contrasts ATWL representations against original prose papers, supplying an independent utility check. The ontology choice is presented as an engineering decision whose sufficiency is shown on the constructed library rather than derived from data that would force the outcome.
Assumptions & free parameters
assumptions (1)
- domain assumption VA workflows can be faithfully decomposed into the eight listed artifact types and transforms labeled by the listed intents without loss of analytical intent
invented entities (1)
-
ATWL artifact types (entities, features, arrangements, visualisations, patterns, models, knowledge, specifications) and transform intents
Cite this review
Pith. "Pith review of ATWL: A Formal Language for Representing, Comparing, and Reusing Visual Analytics Workflows." pith.science (2026). https://pith.science/paper/TZI4VHRH
@misc{pith2026260525489,
  author       = {Pith},
  title        = {Pith review of: ATWL: A Formal Language for Representing, Comparing, and Reusing Visual Analytics Workflows},
  year         = {2026},
  howpublished = {\url{https://pith.science/paper/TZI4VHRH}},
  note         = {Machine review of arXiv:2605.25489}
}
read the original abstract
Visual analytics (VA) workflows are inherently complex, involving data transformation, feature engineering, visual representation, and human interpretation. They are typically described in unstructured prose, hindering systematic comparison, reuse of proven strategies, and training of novices. We present Artifact-Transform Workflow Language (ATWL), a domain-agnostic, declarative language that formally represents VA workflows by capturing their structure and underlying analytical intent. ATWL is built upon a modular ontology of eight artifact types (entities, features, arrangements, visualisations, patterns, models, knowledge, specifications) and transforms characterised by standardised intents (e.g., define-unit, characterise, contextualise, abstract). To show that formalisation effort need not impede adoption, we extract workflows from research papers through supervised interaction with LLM agents, reducing the human role to review and refinement. Using this process, we constructed a library of seventeen ATWL workflows from published VA papers. Cross-workflow analysis reveals structural regularities -- a recurrent meta-structure, recurring motifs, reusable building blocks, diverse iterative strategies, and cross-domain equivalences -- that remain invisible in prose. We further evaluate practical utility through a controlled experiment in which the same LLM addressed two analytical problems with the library supplied either as original papers or as ATWL representations. Both forms enabled useful recommendations, but the formal representation systematically added explicit iteration structure, typed data flow, fragment-level adaptation provenance, and compactness supporting scaling beyond what prose libraries can fit in an LLM's context. ATWL enables a transition from narrative descriptions to formally represented, comparable, and reusable analytical knowledge.
Figures


Figures from the paper (2 more)


Forward citations
Cited by 1 Pith paper
-
From Idea to Prototype in an Afternoon: Scaffolded, AI-Assisted Rapid VA Prototyping
A case study shows that the ATWL scaffold with an AI assistant enabled rapid creation of a visual analytics prototype testing relaxed Pareto frontiers and option constellations, yielding lessons on scaffold usage.
Reference graph
Works this paper leans on
-
[1]
Design study method- ology: Reflections from the trenches and the stacks,
M. Sedlmair, M. Meyer, and T. Munzner, “Design study method- ology: Reflections from the trenches and the stacks,”IEEE Trans- actions on Visualization and Computer Graphics, vol. 18, no. 12, pp. 2431–2440, 2012
2012
-
[2]
The value of visualization,
J. van Wijk, “The value of visualization,” inVIS 05. IEEE Visualiza- tion, 2005., 2005, pp. 79–86
2005
-
[3]
Viewing visual analytics as model building,
N. Andrienko, T. Lammarsch, G. Andrienko, G. Fuchs, D. Keim, S. Miksch, and A. Rind, “Viewing visual analytics as model building,”Computer Graphics Forum, vol. 37, no. 6, pp. 275–299, 2018
2018
-
[4]
Knowledge generation model for visual analytics,
D. Sacha, A. Stoffel, F. Stoffel, B. C. Kwon, G. Ellis, and D. A. Keim, “Knowledge generation model for visual analytics,”IEEE Transactions on Visualization and Computer Graphics, vol. 20, no. 12, pp. 1604–1613, 2014
2014
-
[5]
Systemization of knowledge (sok): Visualization insight – two decades of research, practice, and future directions,
C. He, N. Elmqvist, A. Bellucci, M. Munshi, and G. Jacucci, “Systemization of knowledge (sok): Visualization insight – two decades of research, practice, and future directions,”ACM Comput. Surv., vol. 58, no. 9, Feb. 2026
2026
-
[6]
The nested blocks and guidelines model,
M. Meyer, M. Sedlmair, P . S. Quinan, and T. Munzner, “The nested blocks and guidelines model,”Information Visualization, vol. 12, no. 3–4, pp. 262–275, 2013
2013
-
[7]
Design activity framework for visualization design,
S. McKenna, D. Mazur, J. Agutter, and M. Meyer, “Design activity framework for visualization design,”IEEE Transactions on Visual- ization and Computer Graphics, vol. 20, no. 12, pp. 2191–2200, 2014
2014
-
[8]
An ontological framework for sup- porting the design and evaluation of visual analytics systems,
M. Chen and D. S. Ebert, “An ontological framework for sup- porting the design and evaluation of visual analytics systems,” Computer Graphics Forum, vol. 38, no. 3, pp. 131–144, 2019. IEEE TRANSACTIONS ON VISUALIZATION AND COMPUTER GRAPHICS, VOL. XX, NO. XX, XXX 202X 18
2019
Show all 56 references
-
[9]
From re- quirement to solution: Unveiling problem-driven design patterns in visual analytics,
Y. Wu, S. Gao, S. Zhang, X. Dou, X. Wang, and Q. Li, “From re- quirement to solution: Unveiling problem-driven design patterns in visual analytics,”IEEE Transactions on Visualization and Computer Graphics, vol. PP , pp. 1–18, 02 2025
2025
-
[10]
Methods included: standardizing computational reuse and portability with the common workflow language,
M. R. Crusoe, S. Abeln, A. Iosup, P . Amstutz, J. Chilton, N. Tijani´ c, H. Ménager, S. Soiland-Reyes, B. Gavrilovi´ c, C. Goble, and T. C. Community, “Methods included: standardizing computational reuse and portability with the common workflow language,” Commun. ACM, vol. 65,...
2022
-
[11]
[Online]
Object Management Group,Business Process Model and Notation (BPMN), Version 2.0, Object Management Group Standard, 2011. [Online]. Available: http://www.omg.org/spec/BPMN/2.0/
2011
-
[12]
VisTrails: visualization meets data management,
S. P . Callahan, J. Freire, E. Santos, C. E. Scheidegger, C. T. Silva, and H. T. Vo, “VisTrails: visualization meets data management,” inProceedings of the 2006 ACM SIGMOD International Conference on Management of Data, 2006, p. 745–747
2006
-
[13]
Scientific workflow management and the kepler system,
B. Ludäscher, I. Altintas, C. Berkley, D. Higgins, E. Jaeger, M. Jones, E. A. Lee, J. Tao, and Y. Zhao, “Scientific workflow management and the kepler system,”Concurrency and Computation: Practice and Experience, vol. 18, no. 10, pp. 1039–1065, 2006
2006
-
[14]
KNIME – the Konstanz infor- mation miner: version 2.0 and beyond,
M. R. Berthold, N. Cebron, F. Dill, T. R. Gabriel, T. Kötter, T. Meinl, P . Ohl, K. Thiel, and B. Wiswedel, “KNIME – the Konstanz infor- mation miner: version 2.0 and beyond,”SIGKDD Explor. Newsl., vol. 11, no. 1, p. 26–31, Nov. 2009
2009
-
[15]
Vis4ml: An ontology for visual analytics assisted machine learning,
D. Sacha, M. Kraus, D. A. Keim, and M. Chen, “Vis4ml: An ontology for visual analytics assisted machine learning,”IEEE Transactions on Visualization and Computer Graphics, vol. 25, no. 1, p. 385–395, Jan. 2019
2019
-
[16]
Information-theoretic cost–benefit analysis of hybrid decision workflows in finance,
P . Beaucamp, H. Maylor, and M. Chen, “Information-theoretic cost–benefit analysis of hybrid decision workflows in finance,” Entropy, vol. 27, no. 8, 2025
2025
-
[17]
A nested model for visualization design and vali- dation,
T. Munzner, “A nested model for visualization design and vali- dation,”IEEE Transactions on Visualization and Computer Graphics, vol. 15, no. 6, pp. 921–928, 2009
2009
-
[18]
PROV-DM: The PROV data model,
L. Moreau and P . Missier, “PROV-DM: The PROV data model,” W3C, W3C Recommendation, Apr. 2013, https://www.w3.org/ TR/2013/REC-prov-dm-20130430/
2013
-
[19]
Provenance and scientific workflows: challenges and opportunities,
S. B. Davidson and J. Freire, “Provenance and scientific workflows: challenges and opportunities,” inProceedings of the 2008 ACM SIGMOD International Conference on Management of Data, 2008, p. 1345–1350
2008
-
[20]
What may visualization processes op- timize?
M. Chen and A. Golan, “What may visualization processes op- timize?”IEEE Transactions on Visualization and Computer Graphics, vol. 22, no. 12, p. 2619–2632, Dec. 2016
2016
-
[21]
Cluster and calendar based visualization of time series data,
J. J. van Wijk and E. R. van Selow, “Cluster and calendar based visualization of time series data,” inProceedings of the IEEE Sympo- sium on Information Visualization (InfoVis ’99), 1999, pp. 4–9
1999
-
[22]
Reducing snapshots to points: A visual analytics approach to dynamic net- work exploration,
S. van den Elzen, D. Holten, J. Blaas, and J. J. van Wijk, “Reducing snapshots to points: A visual analytics approach to dynamic net- work exploration,”IEEE Transactions on Visualization and Computer Graphics, vol. 22, no. 1, p. 1–10, Jan. 2016
2016
-
[23]
Mobilitygraphs: Visual analysis of mass mobility dynamics via spatio-temporal graphs and clus- tering,
T. von Landesberger, F. Brodkorb, P . Roskosch, N. Andrienko, G. Andrienko, and A. Kerren, “Mobilitygraphs: Visual analysis of mass mobility dynamics via spatio-temporal graphs and clus- tering,”IEEE Transactions on Visualization and Computer Graphics, vol. 22, no. 1, pp. 11–20, 2016
2016
-
[24]
From movement tracks through events to places: Extracting and characterizing significant places from mobility data,
G. Andrienko, N. Andrienko, C. Hurter, S. Rinzivillo, and S. Wro- bel, “From movement tracks through events to places: Extracting and characterizing significant places from mobility data,” in2011 IEEE Conference on Visual Analytics Science and Technology (V AST), 2011, pp. 161–170
2011
-
[25]
Visually-driven analysis of movement data by progressive clustering,
S. Rinzivillo, D. Pedreschi, M. Nanni, F. Giannotti, N. Andrienko, and G. Andrienko, “Visually-driven analysis of movement data by progressive clustering,”Information Visualization, vol. 7, pp. 225– 239, 07 2008
2008
-
[26]
Episodes and topics in multivariate temporal data,
N. Andrienko, G. Andrienko, and G. Shirato, “Episodes and topics in multivariate temporal data,”Computer Graphics Forum, vol. 42, no. 6, p. e14926, 2023
2023
-
[27]
Temporal event sequence simplification,
M. Monroe, R. Lan, H. Lee, C. Plaisant, and B. Shneiderman, “Temporal event sequence simplification,”IEEE Transactions on Visualization and Computer Graphics, vol. 19, no. 12, pp. 2227–2236, 2013
2013
-
[28]
Eventaction: Visual analytics for temporal event sequence recommendation,
F. Du, C. Plaisant, N. Spring, and B. Shneiderman, “Eventaction: Visual analytics for temporal event sequence recommendation,” in2016 IEEE Conference on Visual Analytics Science and Technology (V AST), 2016, pp. 61–70
2016
-
[29]
UTOPIAN: User-driven topic modeling based on interactive nonnegative matrix factor- ization,
J. Choo, C. Lee, C. K. Reddy, and H. Park, “UTOPIAN: User-driven topic modeling based on interactive nonnegative matrix factor- ization,”IEEE Transactions on Visualization and Computer Graphics, vol. 19, no. 12, pp. 1992–2001, 2013
1992
-
[30]
A partition-based framework for building and validating regression models,
T. Mühlbacher and H. Piringer, “A partition-based framework for building and validating regression models,”IEEE Transactions on Visualization and Computer Graphics, vol. 19, no. 12, pp. 1962–1971, 2013
1962
-
[31]
A visual analytics framework for spatio-temporal analysis and modelling,
N. Andrienko and G. Andrienko, “A visual analytics framework for spatio-temporal analysis and modelling,”Data Mining and Knowledge Discovery, vol. 27, no. 1, pp. 55–83, Jul 2013
2013
-
[32]
Human-in-the-loop: Visual analytics for building models recognizing behavioral patterns in time series,
N. Andrienko, G. Andrienko, A. Artikis, P . Mantenoglou, and S. Rinzivillo, “Human-in-the-loop: Visual analytics for building models recognizing behavioral patterns in time series,”IEEE Computer Graphics and Applications, vol. 44, no. 3, pp. 14–29, 2024
2024
-
[33]
A user-based visual analytics workflow for ex- ploratory model analysis,
D. Cashman, S. R. Humayoun, F. Heimerl, K. Park, S. Das, J. Thompson, B. Saket, A. Mosca, J. Stasko, A. Endert, M. Gleicher, and R. Chang, “A user-based visual analytics workflow for ex- ploratory model analysis,”Computer Graphics Forum, vol. 38, no. 3, pp. 185–199, 2019
2019
-
[34]
A workflow for visual diagnostics of binary classifiers using instance-level explanations,
J. Krause, A. Dasgupta, J. Swartz, Y. Aphinyanaphongs, and E. Bertini, “A workflow for visual diagnostics of binary classifiers using instance-level explanations,” in2017 IEEE Conference on Visual Analytics Science and Technology (V AST), 2017, pp. 162–172
2017
-
[35]
Rfx: A design study for the interactive exploration of a random forest to enhance testing procedures for electrical engines,
J. Eirich, M. Münch, D. Jäckle, M. Sedlmair, J. Bonart, and T. Schreck, “Rfx: A design study for the interactive exploration of a random forest to enhance testing procedures for electrical engines,”Computer Graphics Forum, vol. 41, no. 6, pp. 302–315, 2022
2022
-
[36]
Visualiz- ing dataflow graphs of deep learning models in TensorFlow,
K. Wongsuphasawat, D. Smilkov, J. Wexler, J. Wilson, D. Mané, D. Fritz, D. Krishnan, F. B. Vigéas, and M. Wattenberg, “Visualiz- ing dataflow graphs of deep learning models in TensorFlow,”IEEE Transactions on Visualization and Computer Graphics, vol. 24, no. 1, pp. 1–12, 2018
2018
-
[37]
The what-if tool: Interactive probing of machine learning models,
J. Wexler, M. Pushkarna, T. Bolukbasi, M. Wattenberg, F. B. Viégas, and J. Wilson, “The what-if tool: Interactive probing of machine learning models,”IEEE Transactions on Visualization and Computer Graphics, vol. 26, no. 1, pp. 56–65, 2020
2020
-
[38]
Visual analytics: Definition, process, and chal- lenges,
D. Keim, G. Andrienko, J.-D. Fekete, C. Görg, J. Kohlhammer, and G. Melançon, “Visual analytics: Definition, process, and chal- lenges,”Lecture Notes in Computer Science, 03 2008. IEEE TRANSACTIONS ON VISUALIZATION AND COMPUTER GRAPHICS, VOL. XX, NO. XX, XXX 202X 1 Appendix to...
2008
-
[39]
All artifact identifiers are unique within the workflow
-
[40]
Every transform input references a declared artifact
-
[41]
Artifacts withorigin: givenare never transform outputs
-
[42]
Identify and analyze recurring daily patterns in time series data through interactive clustering and calendar-based visualization; detect standard patterns and exceptional days
The artifact dependency graph is acyclic (except for explicitassignstatements in loops). Additional conventions: •Exogenous artifacts (origin: given) are typically de- clared near the top or near their first use. •Lists of artifact IDs are comma-separated. •Artifact references...
1999 doi
-
[43]
Thedistribution explorationloop in [26] investigates how patterns distribute across contextual dimensions
test alternative analytical approaches. Thedistribution explorationloop in [26] investigates how patterns distribute across contextual dimensions. These loops are characteristic of analytical processes in which the goal isunderstanding rather thanoptimisation. Data restructuri...
-
[44]
Spatial aggregation→Temporal clustering
-
[45]
Destination clustering→Route analysis
-
[46]
Symbol encoding→Topic discovery→Distribution exploration
-
[47]
Feature engineering→Model validation
-
[48]
Component selection→Boundary refinement
-
[49]
iterative refinement
Hypothetical probing→Fairness strategy [31]† Analysis cycle⊃{Grouping, Model fitting} [34]† Model improvement⊃Diagnostic exploration TABLE 17: Progressive abstraction in multi-loop workflows. †= nested (non-sequential) structure.In six workflows, successive loops raise the abs...
1990
-
[50]
Spatial-clustering loop with visual assessment 2 Place-level time series and occupancy
-
[51]
Spatio-temporal aggregation 3 Critical states (empty/full)
-
[52]
iterate until topic set is stable
Feature-engineering loop with threshold tuning 4 Daily-profile clustering and flow patterns [21], [23] Calendar-based pattern view; flow-graph view 5a Predictive model [30], [31] Residual-based model refinement 5b Allocation plan [28] Prescriptive plan-tuning loop TABLE 22: Ad...
-
[53]
regular weekday
followed by six analytical phases, each building on results from the previous one. The overall logic is: 0)Define “places”by grouping nearby docking stations. 1)Aggregate trip datato the place level and compute availability time series. 2)Discover temporal demand-supply patter...
-
[54]
A validated set of research topics with representative keywords and a document map
-
[55]
Smoothed temporal trend charts showing each topic’s trajectory from 1990 to 2024
1990
-
[56]
IEEE TRANSACTIONS ON VISUALIZATION AND COMPUTER GRAPHICS, VOL
A structured narrative summarising rising, declining, and stable themes, major transition points, and distinct research eras in the IEEE VIS community. IEEE TRANSACTIONS ON VISUALIZATION AND COMPUTER GRAPHICS, VOL. XX, NO. XX, XXX 202X 20 Loop L1: Refine cluster structure D_ho...
Reviewed June 29, 2026 · model on record in the stance chip above.
Discussion (0). Continue with ORCID to comment.