REVIEW 2 major objections 6 minor 13 references
The Illusion of Robustness: Aggregate Accuracy Hides Prediction Flips under Task-Irrelevant Context
T0 review · 2 major / 6 minor · reviewed 2026-08-02 · deepseek-v4-flash
Pith's one-line read State-of-the-art models look robust to irrelevant context in aggregate, but the stability is illusory: meaningless pseudo-words flip individual answers by tens of points in both directions, and the affected questions are largely model-speci
desk verdict Careful empirical study showing two-sided per-example flips under irrelevant context; the single unvalidated LLM grader is the main soft spot, but independent local-model results and hand-checkable examples make the claim hold. read the letter →
The pith
A machine-rendered reading of the paper's core claim, the machinery that carries it, and where it could break.
The reading
What carries the argument
The load-bearing objects are the two metrics from Section 2: Instability (INS), the mean absolute per-question accuracy change after adding context, and Worst-tail Degradation (WTD), the average accuracy loss in the worst-affected 10% of questions. Because both are estimated from 20 sampled responses per question per condition, the paper adds a bootstrap noise-floor correction — resampling only the no-context trials — to estimate the sampling-induced positive bias and subtract it. The argument runs on the contrast between the near-zero mean change and the large tail magnitudes, plus the near-zero cross-model correlation of per-question changes, which rules out a purely data-driven explanatio
What would settle it
Re-run MMLU-Pro with five times the sample budget — 100 no-context and 100 context responses per question, graded by two independent graders — and recompute the noise-adjusted INS, WTD, and cross-model correlations. If the adjusted metrics collapse toward zero, or the cross-model Pearson correlation rises well above 0.1 once attenuation is corrected, then the measured instability is mostly sampling noise; if the numbers hold, the two-sided flips and model-specificity are confirmed.
Extended reading notes
Core claim
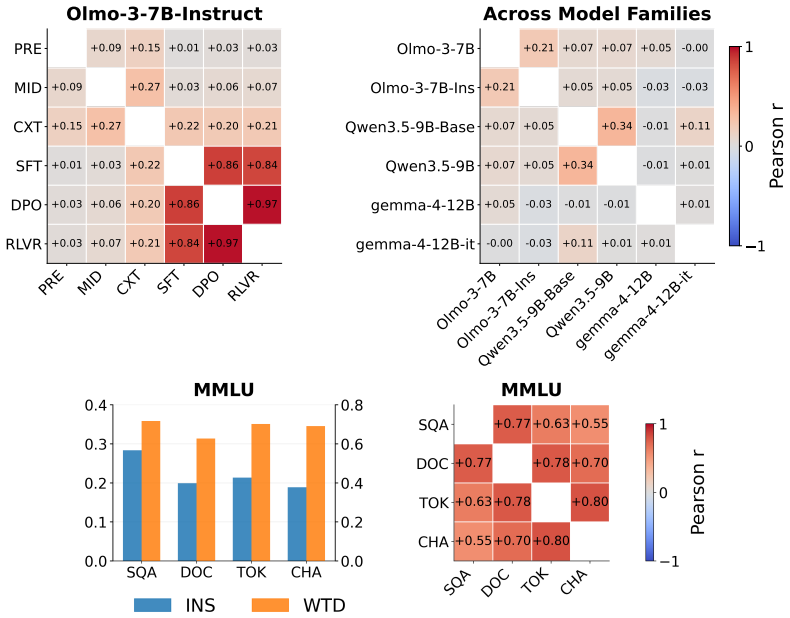
Central claim: context-induced instability is real and two-sided. Prepending task-irrelevant text changes a question's chance of being answered correctly; the changes are large on a small tail of questions while averaging to near zero. The paper defines Instability (INS), mean absolute per-example accuracy change, and Worst-tail Degradation (WTD), average drop in the worst 10% of questions, then subtracts a bootstrap noise floor. Across four benchmarks and eight models, INS reaches 13.6% and WTD 53.2% while mean accuracy moves only a few points. Per-example shifts are uncorrelated across models (Pearson r = 0.00 on MMLU-Pro), so affected questions belong to the model, not the data.
Load-bearing premise
Every per-question change score rests on 40 sampled answers (20 per condition) judged by a single automated grader, and the bootstrap correction removes only the mean null bias, not per-example noise; if residual noise is larger than assumed, the reported magnitudes and the model-specificity result shrink.
Editorial extensions
If this is right
- Evaluation that reports only aggregate accuracy keeps missing tail failures: on the worst 10% of questions a model can lose more than half its accuracy while the mean moves by under a point.
- Because the affected questions differ sharply between models, a context-robustness fix validated on one model cannot be assumed to transfer to another.
- The effect appears even with meaningless pseudo-word context, so it is not retrieval: the model is not being misled by real information in the context.
- More test-time compute — higher reasoning effort or chain-of-thought prompting — shrinks but does not eliminate instability, so paying for extra tokens is only a partial mitigation.
- A model's baseline confidence on a question predicts how much that question's answer will move under context, but not whether the move helps or hurts; question ambiguity predicts neither.
Reading between the lines
- If model specificity holds under realistic long-context deployments, per-example flips could serve as a cheap behavioral fingerprint: models with similar averages that flip different questions are functionally distinct in ways standard leaderboards miss.
- The uncertainty–magnitude link suggests an operational early-warning: flag high-uncertainty questions whenever long context is added, since those are the answers most likely to move — but the flag is directionless, so it cannot tell a deployer whether the move will be good or bad.
- A natural next experiment the paper leaves implicit: test whether flips under irrelevant context correlate with flips under innocuous prompt rephrasing; if they do, prompt sensitivity and context sensitivity are one underlying instability, and mitigation work can be unified.
- Targeting worst-tail degradation directly as a training objective, rather than average loss, could be a more direct route to context reliability than scaling test-time reasoning — a hypothesis the paper's checkpoint results make testable.
Editorial analysis
A structured set of objections, weighed in public.
Referee Report
Summary. The paper studies whether LLM accuracy on QA benchmarks is robust to task-irrelevant context. Using 10k-token pseudo-word contexts prepended to questions from MMLU-Pro, GPQA, HLE, and SimpleQA, it estimates per-example correctness change Δ_i from 20 repeated baseline trials and 20 repeated context-condition trials for eight models. Two metrics are introduced: Instability (INS), the average |Δ_i|, and Worst-tail Degradation (WTD), the mean loss in the worst 10% of examples, both adjusted by a bootstrap noise floor computed from no-context trials alone (Section 2). The central finding is that aggregate accuracy change Δ is small (mostly ±2%) while INS reaches 13.6% and WTD 53.2%; per-example changes concentrate in the tails (88.3% of total absolute change in the two outer deciles), are two-sided, and are largely model-specific (mean cross-model Pearson r ≈ 0.00; Jaccard 0.09 vs. the 0.05 random baseline). Question ambiguity is uncorrelated with change; baseline uncertainty correlates with change magnitude but not direction (split-sample ρ ≈ 0.21). Ablations cover context type, context length, test-time compute, and model development stage.
Significance. If the measurement is valid, the paper is a solid empirical contribution: it turns a diffuse worry about distracting context into a quantified, per-example phenomenon with two simple metrics, and the model-specificity result is practically important (failures cannot be predicted from the data alone). The statistical apparatus is well above the norm: bootstrap noise floors from 1000 null experiments, split-sample WTD with disjoint selection/measurement trials, split-half reliability with attenuation ceilings and Spearman-Brown correction, disjoint-fold correlation estimators, a homogeneous-shift null simulation, and released code/data. These strengthen the reproducibility of the per-example signal. The principal caveat is that all labels come from one unvalidated LLM judge, so the magnitudes and the model-specificity finding are conditional on grader validity; the phenomenon itself is corroborated by the worked examples in Appendix I. With a grader-validation study added, the paper would be a strong candidate for publication.
major comments (2)
- [§3 (Experiment Details); Appendix D (Table 7); Appendix H.2] Every quantitative claim in the paper — Table 1 INS/WTD magnitudes, the 88.3% tail concentration (§3.1), cross-model r≈0.00 and Jaccard 0.09 (§3.2), and Table 3's correlations — is computed from binary correctness labels produced by a single automated judge, gpt-5.4-mini at low reasoning. No human validation, inter-annotator agreement, or comparison with the datasets' official/exact-match grading is reported, and Table 2's taxonomy is itself LLM-annotated. The split-half reliability (Table 7) establishes reproducibility of the judge's labels, not validity: a judge that systematically mis-grades responses whose style changes under long contexts would yield reproducible, context-correlated artifacts. Because one judge grades all models, judge errors interacting with model-specific response styles could also manufacture the appearance of model specificity. The required assumption — grading
- [§3.3, Figure 6; Table 4 (right)] The development-stage conclusions ('instability emerges during pretraining'; 'SFT substantially increases instability'; 'post-training amplifies INS/WTD') do not control for the room-to-change confound the paper itself flags in §3.1: INS and WTD are bounded by baseline accuracy. As the OLMo checkpoints' AVG rises from 25.4% to 47.4%, part of the WTD increase (17.7→22.1) could be mechanical. Likewise, gemma-4-12B → gemma-4-12B-it shows AVG 58.5→78.5 with WTD 24.5→40.7; higher AVG means more probability mass available for degradation, making the 'amplification' reading ambiguous. A baseline-accuracy-stratified or log-odds-scale version of Figure 6/Table 4 is needed to separate genuine growth in instability from the mechanical effect of increasing room to change. The SFT/DPO comparisons, where AVG changes little while INS/WTD jump, are the least affected and do support the claim.
minor comments (6)
- [Table 1 vs. Table 6] The headline INS/WTD values are noise-adjusted, but Table 1 reports them without uncertainty. Table 6 gives CIs only for the unadjusted estimates and the floors. Since the floor is an average over 1000 bootstrap trials its own variance is small, but the paper should state explicitly that adjusted CIs are obtained by shifting the Table 6 CIs by the floor, or report adjusted CIs directly, so readers can judge whether e.g. gpt-5.5's HLE WTD of 4.3 (observed 16.9, floor 12.6) is distinguishable from zero.
- [§2; §3.3] INS/WTD are conditional on the particular fixed set of M=10 contexts and K=10; the bootstrap null resamples trials but not contexts, so context-draw variability is not part of the noise floor. A short sensitivity analysis varying M and K, or an explicit statement that the magnitudes are specific to the chosen context sample, would clarify the scope of the headline numbers.
- [§3.1, Table 2; Appendix C] The qualitative error taxonomy is generated by another LLM (gpt-5.5) without human validation. The claim that improved and degraded examples follow different error distributions should be flagged as exploratory, or the annotation should be validated on a sample.
- [§1; §2] Framing: the fact that INS can be large while Δ≈0 is a mathematical consequence of averaging absolute values (triangle inequality), so the abstract's 'masks' framing should make explicit that the contribution is the empirical magnitude, two-sidedness, reproducibility, and model-specificity of the flips, not the existence of a gap between INS and |Δ|.
- [Tables 1 and 4 headers; §3 experiment details] Presentation: the header 'A VG∆INS ↓ WTD↓' appears to be a formatting artifact (should read 'AVG | Δ | INS | WTD'). Also, the sentence in §3 that contexts are 'prepended to the question as an extra user message between the question and the system message' is ambiguous about the final message order; Appendix H.1 should specify the exact sequence (system → context → question?) for reproducibility.
- [Table 3] Table 3 pools n=1690 questions across four benchmarks, whereas §3.2 reports per-dataset correlations. Pooling mixes datasets with very different characteristics (e.g., HLE floor effects); reporting the Table 3 correlations per dataset would make the 'consistently uncorrelated' claim easier to verify.
Circularity Check
No significant circularity: the core INS/WTD results are empirical measurements supported by noise corrections and split-half reliability, not consequences of the metric definitions alone.
full rationale
The paper's derivation chain is: define latent correctness probabilities s_ij; estimate them by repeated sampling; define per-example change Δ_i, INS = mean |Δ_i|, and WTD as worst-tail degradation; apply a bootstrap noise-floor correction; then report adjusted magnitudes, tail concentration, cross-model correlations, and correlates. No load-bearing step is equivalent to its inputs by construction. It is true that INS ≥ |mean Δ_i| follows from the triangle inequality, but the paper does not present that inequality as a derived empirical finding; the empirical content is that the measured INS values are large (up to 13.6%), that per-example changes concentrate in the tails, that the effect is two-sided, and that affected examples are model-specific. Those claims are supported by the noise-corrected estimates, split-sample WTD (Appendix A), and randomized split-half reliability (Appendix D), not by the definitions themselves. The bootstrap adjustment is explicitly described as a noise-floor correction rather than an unbiased estimator, and the split-sample estimator separates selection trials from measurement trials, so no fitted quantity is renamed as a prediction. The single automated grader concern is a measurement-validity issue—grader bias correlated with context-induced response-style changes could affect magnitudes and model-specificity—but that is not circularity: the estimates could be inaccurate without the derivation reducing to its inputs. No self-citation is load-bearing; citations to prior work are contextual background rather than the justification for the central claim. Therefore no specific circular step can be exhibited, and the appropriate score is 0.
Assumptions & free parameters
free parameters (6)
- K (WTD tail percentile) =
10
- M (number of contexts per example) =
10
- Sampling trials (p, q) =
p=20 baseline, q=2 per context
- Default context length =
10k tokens
- Pseudo-word vocabulary parameters =
Zipf frequency threshold 1.5, vocabulary size 10000, word length 3–8 chars
- Automated grader =
gpt-5.4-mini (low reasoning)
assumptions (5)
- domain assumption Pseudo-word contexts (random lowercase strings filtered by English frequency) are task-irrelevant and contain no task-relevant evidence.
- domain assumption Binary correctness averaged over repeated samples is a valid estimate of a latent per-example correctness probability s_ij, and the automated grader is unbiased.
- standard math Under the null hypothesis, context-condition trials are exchangeable with no-context trials, so resampling no-context samples yields a valid noise floor for INS and WTD.
- domain assumption The evaluation configuration (context prepended as an extra user message, no-reasoning or lowest reasoning effort) is the appropriate lens for measuring context-induced instability.
- standard math Per-example change vectors Δ_i are stable model-level traits, so cross-model correlations and Jaccard overlaps are interpretable after correcting for attenuation.
Cite this review
Pith. "Pith review of The Illusion of Robustness: Aggregate Accuracy Hides Prediction Flips under Task-Irrelevant Context." pith.science (2026). https://pith.science/paper/UF4XPNZ4
@misc{pith2026260712963,
  author       = {Pith},
  title        = {Pith review of: The Illusion of Robustness: Aggregate Accuracy Hides Prediction Flips under Task-Irrelevant Context},
  year         = {2026},
  howpublished = {\url{https://pith.science/paper/UF4XPNZ4}},
  note         = {Machine review of arXiv:2607.12963}
}
read the original abstract
As large language models (LLMs) grow more capable, they are increasingly deployed in context-rich settings where task inputs are often accompanied by long, partially irrelevant context. In a controlled setting, we find that state-of-the-art models often appear robust to task-irrelevant context at the aggregate level: prepending it to benchmark questions causes little change in overall accuracy. This aggregate stability, however, masks significant per-example instability. Even semantically meaningless pseudo-words, formed by randomly combining characters, can markedly shift model predictions on a small fraction of examples, degrading performance on some while improving it on others. This two-sided effect holds consistently across a wide range of models and datasets, yet the affected examples are largely model-specific. We further show that this instability is modulated by context type, context length, test-time compute, and model development stage. Together, our findings reveal context-induced tail risks concealed by aggregate accuracy, motivating per-example reliability evaluation of language models.
Figures


Figures from the paper (5 more)


Reference graph
Works this paper leans on
-
[1]
Did it effectively answer a different problem than posed — misreading the question, or adding/relaxing a constraint? -> A
-
[2]
Is the fault a false factual claim — a wrong recalled fact/entity/attribute, or invented supporting detail — rather than a reasoning error? -> B
-
[3]
Is the method or reasoning itself wrong — a wrong/overgeneralized rule or concept, or an invalid inference chaining otherwise-right facts and rules (not merely a mechanical slip)? -> C. 16 Response Tokens Reasoning Tokens Model A VG∆Baseline Context Baseline Context gpt-oss-120b (low)77.4−0.6 188 194 160 154 gpt-oss-120b (mid)79.5 +0.4 201 202 443 405 gpt...
-
[4]
Was the method right but slipped in execution — an arithmetic/numeric error, a bookkeeping/representation slip, a miscount, or picking the wrong final option after a correct derivation? -> D
-
[5]
Covariance
Otherwise (none clearly applies, or too little information to tell) -> E. ## Output format First output the label line: the code, an em dash, and its short name — e.g.`B — Wrong Fact`. Then, on the next line, give a brief one-sentence explanation of why this code applies to the specific failure. Do not list multiple codes or write anything beyond the labe...
-
[8]
Extract the single option the response finally commits to
-
[9]
Finding the final answer: - A response may mention, weigh, or even initially state several options before settling on one
Decide whether that option matches the ground truth. Finding the final answer: - A response may mention, weigh, or even initially state several options before settling on one. Extract only the option it ultimately commits to — normally its concluding statement — and ignore options it stated earlier but then moved away from. - Use'None'only when the respon...
-
[10]
Extract the final exact answer the response commits to
Show all 13 references
-
[11]
Finding the final answer: - A response may explore, revise, or initially state different answers before settling on one
Decide whether that answer matches the ground truth. Finding the final answer: - A response may explore, revise, or initially state different answers before settling on one. Extract only the answer it ultimately commits to — normally its concluding statement — and ignore answe...
2018
-
[12]
**Paris Saint-Germain**
-
[13]
Response (with context, retrieved the wrong fact) Napoli came second in Group C of the 2018–19 UEFA Champions League
**Red Star Belgrade** 26 Liverpool finished second behind PSG and advanced to the knockout stage. Response (with context, retrieved the wrong fact) Napoli came second in Group C of the 2018–19 UEFA Champions League. Brief explanation: In Group C, Paris Saint-Germain finished f...
2018
-
[2021]
URLhttps://openreview.net/forum?id=d7KBjmI3GmQ. C.-P. Hsieh, S. Sun, S. Kriman, S. Acharya, D. Rekesh, F. Jia, and B. Ginsburg. RULER: What’s the real context size of your long-context language models? InFirst Conference on Language Modeling, 2024. URLhttps://openreview.net/fo...
2024 arXiv
-
[2024]
URLhttps://openreview.net/forum?id=Ti67584b98. M. T. Ribeiro, T. Wu, C. Guestrin, and S. Singh. Beyond accuracy: Behavioral testing of NLP models with CheckList. In D. Jurafsky, J. Chai, N. Schluter, and J. Tetreault, editors,Proceedings of the 58th Annual Meeting of the Assoc...
2020 arXiv
Reviewed August 2, 2026 · model on record in the stance chip above.
Discussion (0). Continue with ORCID to comment.