Partition-Guided Distance Saliency: Bridging Decision and Objective Spaces in Many-Objective Optimization
Pith reviewed 2026-07-01 06:28 UTC · model grok-4.3
The pith
PGDS framework uses surrogate-learned distance mappings and automatic partitioning to explain variable impacts in many-objective optimization.
A machine-rendered reading of the paper's core claim, the machinery that carries it, and where it could break.
Core claim
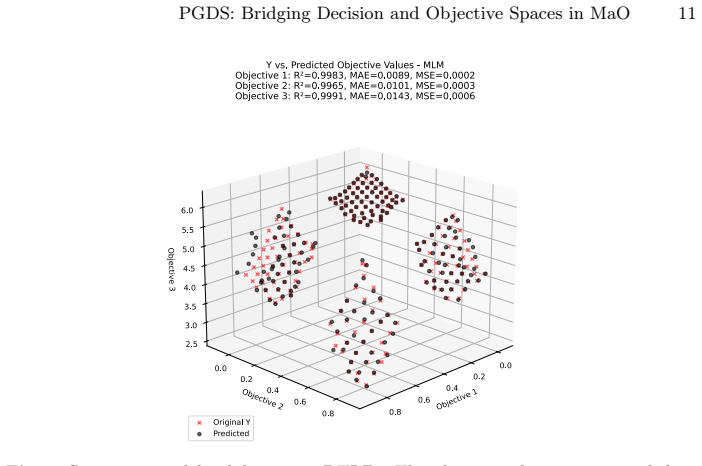
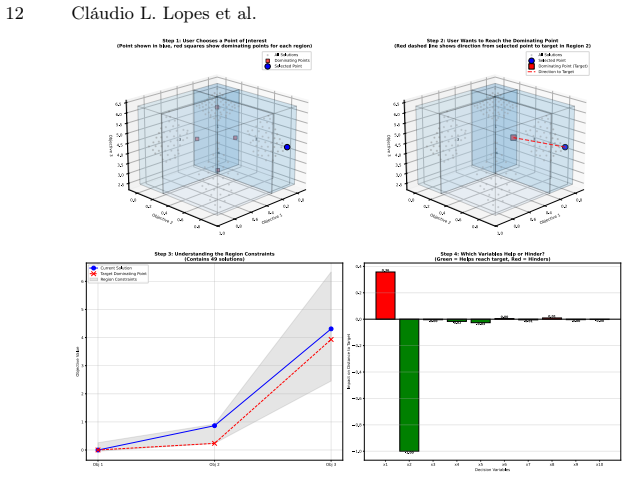
The central claim is that a surrogate model trained on geometric distances between solutions in decision space can reliably predict proximity relations in objective space; automatic partitioning then supplies target dominating points without user input; and per-variable perturbation analysis quantifies sensitivity so that each decision variable can be classified as either a driver facilitating movement toward a chosen region or a blocker imposing geometric constraints.
What carries the argument
Partition-Guided Distance Saliency (PGDS) three-stage pipeline that maps decision-space distances to objective proximity via surrogate, auto-partitions objectives to select dominating points, and computes variable-wise distance shifts to label drivers versus blockers.
If this is right
- Automated dominating-point selection removes the need for a priori target specification in high-dimensional objective spaces.
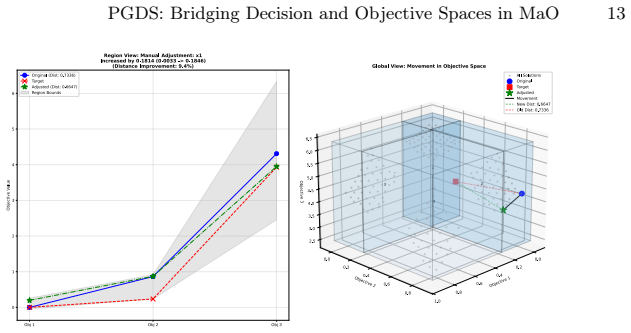
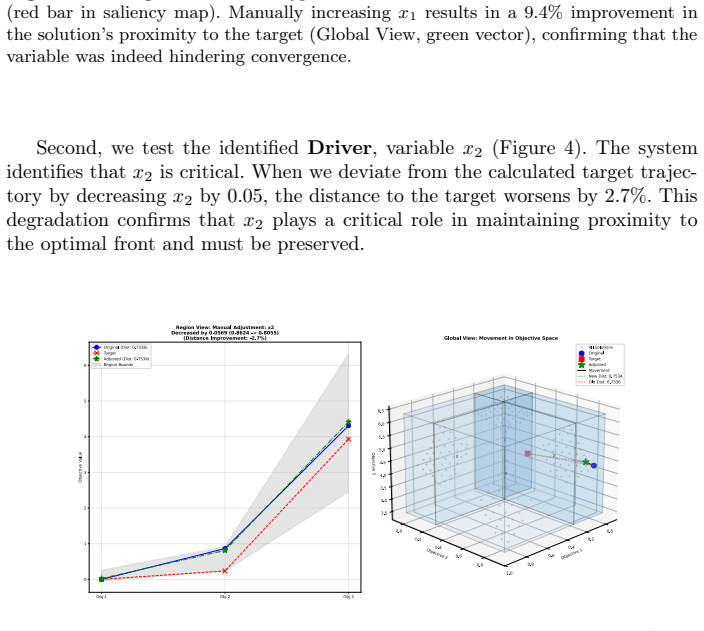
- Variable classification into drivers and blockers directly indicates which coordinates to adjust to improve convergence toward a local region.
- The same pipeline applied to the welded-beam problem yields physics-interpretable constraints that visualization alone does not surface.
- The approach scales at least to 10-objective continuous problems where traditional XAI rules produce undifferentiated outputs.
Where Pith is reading between the lines
- The distance-mapping surrogate could be replaced by an exact geometric oracle on problems where closed-form distance relations exist, testing whether the learned approximation is necessary.
- Partitioning quality may degrade when objective landscapes contain many disconnected Pareto segments, suggesting a follow-up test on disconnected test functions.
- Insights from PGDS might feed directly into interactive decision-support interfaces that highlight which variables to change first.
- The framework's emphasis on local dominating points implies it could be extended to track how driver/blocker status evolves across successive generations of an evolutionary algorithm.
Load-bearing premise
A surrogate model can reliably learn a mapping from geometric distances in the decision space to proximity in the objective space.
What would settle it
If the surrogate's distance-to-proximity predictions show high error on validation solutions drawn from the same distribution as the training points, the downstream driver and blocker labels lose their claimed geometric grounding.
Figures
read the original abstract
Explainability in Many-Objective Optimization (MaO) is currently hindered by the escalating complexity of the Pareto front, which renders the relationship between high-dimensional decision variables and objective outcomes increasingly opaque. As the number of objectives exceeds the limits of traditional visualization, decision-makers encounter a ``cognitive drought'' in identifying relevant trade-offs or specifying target regions without a priori knowledge. To bridge this interpretability gap, we introduce the {Partition-Guided Distance Saliency (PGDS)} framework, a novel XAI approach designed for continuous optimization landscapes. Our framework automates the explanation process through a three-stage pipeline that prioritizes geometric intuition over abstract rules. First, we employ a surrogate model that learns how geometric distances in the decision space map to proximity in the objective space. Second, to address the difficulty of manual target selection in high dimensions, the framework automatically partitions the objective landscape into distinct regions and identifies local ``Dominating Points'' to serve as automated targets for improvement. Third, we quantify how sensitive a solution's position is to each decision variable by measuring the distance shifts induced by perturbations to each variable. This allows PGDS to categorize features as either ``Drivers'' which facilitate convergence toward preferred regions, or ``Blockers'' which represent geometric constraints hindering further progress. Validation on 10-objective benchmarks and a physics-informed engineering problem (Welded Beam) demonstrates that PGDS provides differentiated, actionable insights that traditional visualization and rule-based XAI methods fail to provide.
Editorial analysis
A structured set of objections, weighed in public.
Referee Report
Summary. The paper introduces the Partition-Guided Distance Saliency (PGDS) framework for explainability in many-objective optimization (MaO). It proposes a three-stage pipeline: (1) a surrogate model that learns a mapping from geometric distances in decision space to proximity in objective space; (2) automatic partitioning of the objective landscape together with identification of local Dominating Points as targets; and (3) perturbation-based sensitivity analysis that classifies decision variables as Drivers (facilitating convergence) or Blockers (imposing geometric constraints). The authors claim that PGDS yields differentiated, actionable insights on 10-objective benchmarks and the Welded Beam problem that traditional visualization and rule-based XAI methods cannot provide.
Significance. If the surrogate mapping is shown to be accurate, the automatic partitioning and sensitivity categorization could offer a geometrically grounded alternative to rule-based XAI in high-dimensional MaO, addressing the claimed "cognitive drought" in identifying trade-offs. The framework's emphasis on continuous landscapes and physics-informed validation is a potential strength, but only if the load-bearing surrogate step is quantitatively supported.
major comments (2)
- [Stage 1 / surrogate description] Surrogate-model section (Stage 1 of the three-stage pipeline): the central claim that the learned distance-to-proximity mapping enables reliable partitioning and sensitivity analysis is unsupported because no error metric (MSE, R^{2}, cross-validation score), ablation, or hold-out validation of the surrogate is reported. This mapping directly determines the Dominating Points and Driver/Blocker labels; without quantified accuracy the downstream validation on 10-objective benchmarks and Welded Beam cannot be assessed.
- [Validation / experimental results] Validation section (benchmarks and Welded Beam): the assertion that PGDS provides "differentiated, actionable insights" that visualization and rule-based XAI fail to deliver is not accompanied by any quantitative comparison (e.g., user-study metrics, fidelity scores, or decision-maker preference data). The reported results therefore remain qualitative and cannot substantiate the superiority claim.
minor comments (2)
- [Methods / notation] Notation for "Dominating Points" and "Drivers/Blockers" should be defined with explicit mathematical symbols or pseudocode in the methods section to avoid ambiguity when the partitioning algorithm is described.
- [Figures / captions] Figure captions for the Welded Beam results should explicitly state which decision variables were classified as Drivers versus Blockers and the perturbation magnitude used in Stage 3.
Simulated Author's Rebuttal
We thank the referee for the insightful comments on our paper. We address each major comment below and indicate the revisions we will make to strengthen the manuscript.
read point-by-point responses
-
Referee: [Stage 1 / surrogate description] Surrogate-model section (Stage 1 of the three-stage pipeline): the central claim that the learned distance-to-proximity mapping enables reliable partitioning and sensitivity analysis is unsupported because no error metric (MSE, R^{2}, cross-validation score), ablation, or hold-out validation of the surrogate is reported. This mapping directly determines the Dominating Points and Driver/Blocker labels; without quantified accuracy the downstream validation on 10-objective benchmarks and Welded Beam cannot be assessed.
Authors: We acknowledge that the surrogate model's accuracy was not quantitatively validated in the original manuscript. The focus was on the end-to-end framework and the insights it generates. To address this, we will add a dedicated subsection in the revised version reporting MSE, R² scores, and k-fold cross-validation results for the surrogate on the benchmark problems. This will provide the necessary evidence for the reliability of the distance-to-proximity mapping. revision: yes
-
Referee: [Validation / experimental results] Validation section (benchmarks and Welded Beam): the assertion that PGDS provides "differentiated, actionable insights" that visualization and rule-based XAI fail to deliver is not accompanied by any quantitative comparison (e.g., user-study metrics, fidelity scores, or decision-maker preference data). The reported results therefore remain qualitative and cannot substantiate the superiority claim.
Authors: The validation presented is qualitative because the primary contribution is the novel geometric approach to generating insights in high-dimensional MaO, where traditional quantitative XAI metrics may not directly apply. However, we agree that additional quantitative support would be beneficial. In the revision, we will include a comparison table showing how PGDS identifies specific Drivers and Blockers that are not apparent from visualization or rule-based methods, and discuss potential user-study designs for future work. We maintain that the case studies on 10-objective problems and Welded Beam provide concrete examples of actionable insights. revision: partial
Circularity Check
No circularity: pipeline uses learned surrogate for downstream analysis without reduction to inputs by construction
full rationale
The described three-stage pipeline begins with a surrogate that learns a mapping from decision-space distances to objective-space proximity; this learned mapping then informs automatic partitioning, dominating-point identification, and perturbation-based sensitivity analysis. No equations, fitted parameters, or results are shown reducing a claimed output (e.g., Drivers/Blockers or insights) to the surrogate fit itself by definition. Validation is presented on external 10-objective benchmarks and the Welded Beam problem rather than internal tautology. No self-citations, uniqueness theorems, or ansatzes imported from prior author work appear in the text. The derivation therefore remains self-contained against external benchmarks.
Axiom & Free-Parameter Ledger
Reference graph
Works this paper leans on
-
[1]
Abed-Alguni, B.H.: Evomapx: An explainable framework for metaheuris- tic optimization algorithms. Expert Systems with Applications298, 129514 (2026).https://doi.org/https://doi.org/10.1016/j.eswa.2025.129514, https://www.sciencedirect.com/science/article/pii/S095741742503129X
-
[2]
Bentley, J.L.: Multidimensional binary search trees used for associative searching. Commun. ACM18(9), 509–517 (Sep 1975).https://doi.org/10.1145/361002. 361007
-
[3]
Deb, K., Pratap, A., Agarwal, S., Meyarivan, T.: A fast and elitist multiobjective genetic algorithm: [nsga-ii]. IEEE Transactions on Evolutionary Computation6(2), 182–197 (2002).https://doi.org/10.1109/4235.996017
-
[4]
IEEE Transactions on Evolutionary Computation18(4), 577–601 (2014)
Deb, K., Jain, H.: An evolutionary many-objective optimization algorithm using reference-point-based nondominated sorting approach, part i: solving problems with box constraints. IEEE Transactions on Evolutionary Computation18(4), 577–601 (2014)
2014
-
[5]
IEEE Transactions on Evolutionary Computation 6(2), 182–197 (2002)
Deb, K., Pratap, A., Agarwal, S., Meyarivan, T.: A fast and elitist multiobjec- tive genetic algorithm: NSGA-II. IEEE Transactions on Evolutionary Computation 6(2), 182–197 (2002)
2002
-
[6]
In: Proceedings of the 8th Annual Conference on Genetic and Evolutionary Computation
Deb, K., Sundar, J.: Reference point based multi-objective optimization using evo- lutionary algorithms. In: Proceedings of the 8th Annual Conference on Genetic and Evolutionary Computation. p. 635–642. GECCO ’06, Association for Comput- ing Machinery, New York, NY, USA (2006).https://doi.org/10.1145/1143997. 1144112
-
[7]
In: International Conference on Evolutionary Multi- Criterion Optimization
Fieldsend, J.E.: Visualising high-dimensional pareto relationships in two- dimensional scatterplots. In: International Conference on Evolutionary Multi- Criterion Optimization. pp. 258–272. Springer (2016)
2016
-
[8]
IEEE TEC10(2006), 477–506 (2011)
Huband, S., Hingston, P., Barone, L.: A Review of Multi-objective Test Problems and a Scalable Test Problem Toolkit. IEEE TEC10(2006), 477–506 (2011)
2006
-
[9]
In: Proceedings of the 31st International Conference on Neural Information Processing Systems
Lundberg, S.M., Lee, S.I.: A unified approach to interpreting model predictions. In: Proceedings of the 31st International Conference on Neural Information Processing Systems. p. 4768–4777. NIPS’17, Curran Associates Inc., Red Hook, NY, USA (2017)
2017
-
[10]
Mei, Y., Chen, Q., Lensen, A., Xue, B., Zhang, M.: Explainable artificial intelli- gencebygeneticprogramming:Asurvey.IEEETransactionsonEvolutionaryCom- putation27(3), 621–641 (2023).https://doi.org/10.1109/TEVC.2022.3225509
-
[11]
Journal of Machine Learning Research1, 1–33 (2025), arXiv:2505.15516v1 [cs.LG]
Meijer, C., Bos, E.G.P.: Explainable embeddings with distance explainer. Journal of Machine Learning Research1, 1–33 (2025), arXiv:2505.15516v1 [cs.LG]
-
[12]
Kluwer Academic Publish- ers, Boston, MA (1999)
Miettinen, K.: Nonlinear Multiobjective Optimization. Kluwer Academic Publish- ers, Boston, MA (1999)
1999
-
[13]
ACM Transactions on Evolu- tionary Learning4(1), 1–39 (2024)
Misitano, G.: Exploring the explainable aspects and performance of a learnable evolutionary multiobjective optimization method. ACM Transactions on Evolu- tionary Learning4(1), 1–39 (2024)
2024
-
[14]
Misitano, G., Afsar, B., Lárraga, G., Miettinen, K.: Towards explainable interac- tive multiobjective optimization: R-ximo. Autonomous Agents and Multi-Agent Systems36(2) (Oct 2022).https://doi.org/10.1007/s10458-022-09577-3 PGDS: Bridging Decision and Objective Spaces in MaO 21
-
[15]
Nagar, D., Ramu, P., Deb, K.: Visualization and analysis of pareto-optimal fronts using interpretable self-organizing map (isom). Swarm and Evolutionary Compu- tation76, 101202 (2023).https://doi.org/https://doi.org/10.1016/j.swevo. 2022.101202
-
[16]
RISE: Randomized Input Sampling for Explanation of Black-box Models
Petsiuk, V., Das, A., Saenko, K.: Rise: Randomized input sampling for explanation of black-box models. arXiv preprint arXiv:1806.07421 (2018)
work page internal anchor Pith review Pith/arXiv arXiv 2018
-
[17]
Ribeiro, M.T., Singh, S., Guestrin, C.: "why should i trust you?": Ex- plaining the predictions of any classifier. In: Proceedings of the 22nd ACM SIGKDD International Conference on Knowledge Discovery and Data Mining. p. 1135–1144. KDD ’16, Association for Computing Machinery, New York, NY, USA(2016).https://doi.org/10.1145/2939672.2939778,https://doi.or...
-
[18]
In: Proceedings of the International Work-Conference on Artificial Neural Networks (IWANN)
de Souza Junior, A.H., Corona, F., Miche, Y., Lendasse, A., Barreto, G.A., Sim- ula, O.: Minimal learning machine: A new distance-based method for supervised learning. In: Proceedings of the International Work-Conference on Artificial Neural Networks (IWANN). Lecture Notes in Computer Science, vol. 7902, pp. 408–416. Springer (2013)
2013
-
[19]
IEEE Transactions on Evolutionary Computation19(2), 225–245 (2015)
Tušar, T., Filipuč, B.: Visualization of pareto front approximations in evolutionary multiobjective optimization: A critical review and the prosection method. IEEE Transactions on Evolutionary Computation19(2), 225–245 (2015)
2015
-
[20]
IEEE Transactions on Evolutionary Computation11(6), 712–731 (2007)
Zhang, Q., Li, H.: Moea/d: A multiobjective evolutionary algorithm based on decomposition. IEEE Transactions on Evolutionary Computation11(6), 712–731 (2007)
2007
-
[21]
Information Sciences418, 478–494 (2017)
Zhen, L., Li, M., Cheng, R.: Objective reduction for visualising many-objective solution sets. Information Sciences418, 478–494 (2017)
2017
-
[22]
In: 2019 IEEE Congress on Evolutionary Computation (CEC)
Zou, J., Sun, Y., Li, M.: Visualizing the pareto front of many-objective optimiza- tion problems using t-sne. In: 2019 IEEE Congress on Evolutionary Computation (CEC). pp. 2456–2463. IEEE (2019)
2019
discussion (0)
Sign in with ORCID, Apple, or X to comment. Anyone can read and Pith papers without signing in.