REVIEW 3 major objections 4 minor 66 references
A reentrancy of motility-induced phase separation in overdamped active Brownian particles
T0 review · 3 major / 4 minor · reviewed 2026-08-06 · deepseek-v4-flash
Pith's one-line read MIPS reverses when surface stress cracks the dense cluster
desk verdict An interesting but under-tested mechanism paper: reentrancy itself is not new, and the f_LA-to-slip causal claim is explicitly admitted as an assumption. read the letter →
The pith
A machine-rendered reading of the paper's core claim, the machinery that carries it, and where it could break.
The reading
What carries the argument
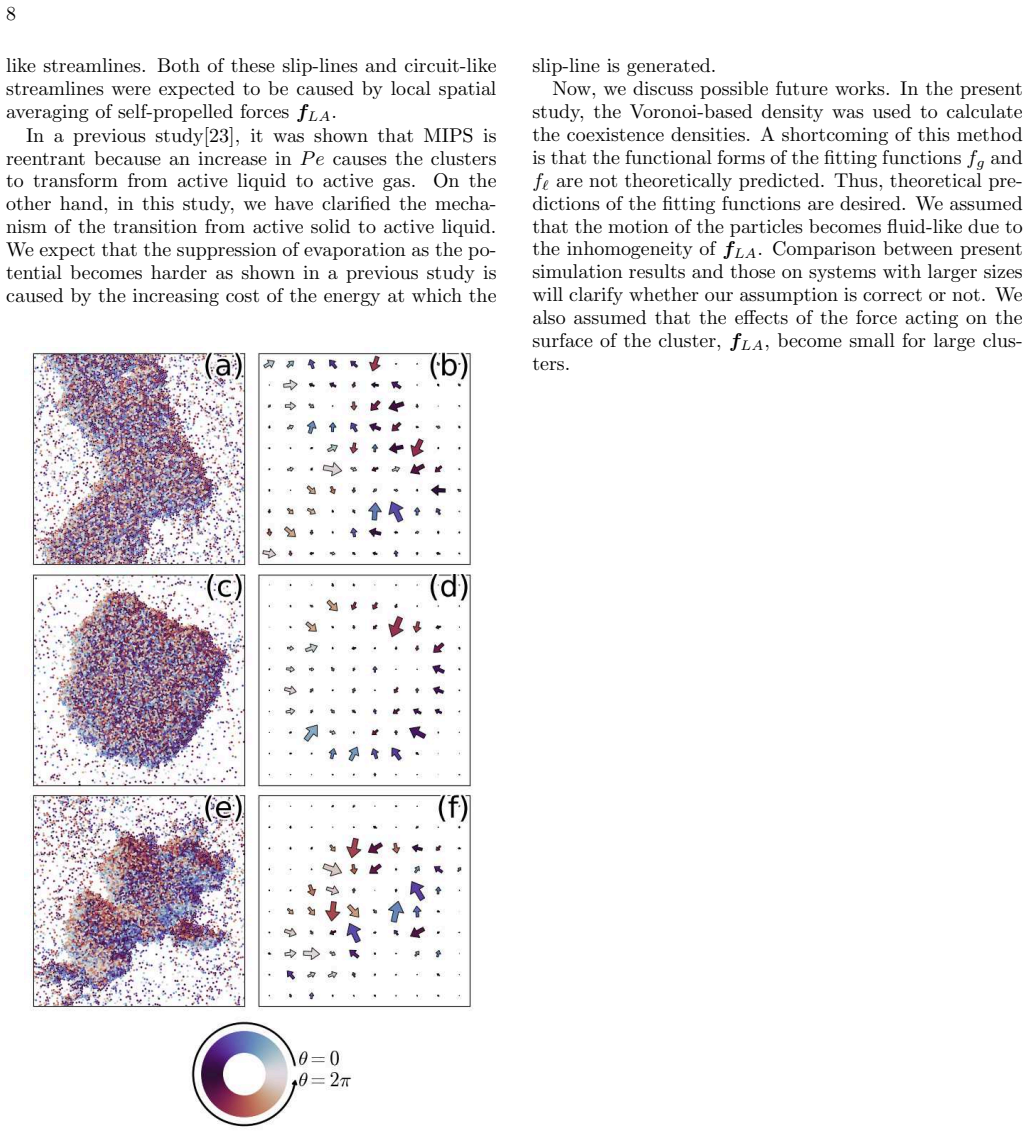
The load-bearing quantity is $\mathbf{f}_{\mathrm{LA}}(\mathbf{r})$, the local spatial average of the self-propelled force $v_0 \mathbf{n}_i$ over particles in each grid cell. Because particles that have just collided with the dense phase still point inward and only later lose orientation through rotational diffusion, $\mathbf{f}_{\mathrm{LA}}$ is large on the cluster surface and oriented into the cluster, so it acts as a surface stress. The argument links this stress to plastic response through defect tracking: inside the triangular-lattice cluster, coordination-5 and coordination-7 particles form dislocation pairs; their trajectories trace slip lines that coincide with straight boundaries between coherently moving domains. Slip deformation is argued to be energetically preferred because it shortens interparticle distances only along the slip line. Coexistence densities come from Voronoi cell densities fitted with a log-normal dilute peak and a new power-law-like dense peak, while the cluster interior is defined by current-flow closeness centrality; the relevant timescale is $\tau^* = 5 \times 3/Pe$.
What would settle it
Recompute the coexistence densities with a grid-based density histogram and two Gaussian fits, or from direct cluster-size statistics, for $Pe = 400$, $800$, and $1000$ at $\Phi = 0.6$; if $\rho_\ell - \rho_g$ stays nearly constant or fails to approach zero, the reported reentrancy is an artifact of the $f_\ell$ fit.
Extended reading notes
Core claim
In overdamped ABPs with WCA repulsion, the coexistence densities $\rho_g$ and $\rho_\ell$ first separate and then approach each other again as $Pe$ increases, so MIPS is reentrant, and the paper traces this reentrancy to multiple slip deformation of the cluster. The cluster is a triangular-lattice solid whose 5–7 defect pairs act as dislocations; as $Pe$ grows, dislocation paths coincide with straight domain boundaries (slip lines), adjacent domains move in opposite directions, and the mean-square displacement inside the cluster loses the glassy plateau seen at lower $Pe$. The stress source is $\mathbf{f}_{\mathrm{LA}}$, the local spatial average of the self-propelled force, which is large at the cluster surface and points inward because freshly collided particles push toward the interior before their orientations randomize. $\mathbf{f}_{\mathrm{LA}}$ thus compresses the cluster from outside and preferentially causes slip because slip costs less energy than other large deformations; more slip lines at higher $Pe$ fluidize the cluster and reduce its particle number.
Load-bearing premise
The dense-phase coexistence density is extracted with an ad hoc fitting function $f_\ell$ whose left tail visibly misses the simulated distribution (admitted in the supplementary information), so if that bias closes the density gap, the reentrancy itself could be a fitting artifact.
Editorial extensions
If this is right
- If reentrancy is a yield phenomenon, MIPS's upper-$Pe$ boundary is set by the cluster's ability to withstand the surface stress $\mathbf{f}_{\mathrm{LA}}$, not by the evaporation rate.
- The dense phase should lose its glassy plateau at high $Pe$: particles inside the cluster show ballistic motion on the slip timescale, so rheological signatures of the cluster should change from solid-like to fluid-like.
- Reentrancy should be weaker in larger systems, since $\mathbf{f}_{\mathrm{LA}}$ is a surface force and the stress it generates per particle shrinks as clusters grow.
- Observing slip lines and 5–7 defect trajectories inside active clusters would provide direct evidence for this mechanism, distinguishing it from evaporation.
Reading between the lines
- Inference: because $\mathbf{f}_{\mathrm{LA}}$ is built from particles that collide while pointing inward and then randomize, its strength depends on rotational diffusion; systems with persistent orientation, such as run-and-tumble particles with long run lengths, should show a different $Pe$-dependence of reentrancy than the ABPs studied here.
- Inference: if the cluster behaves as a deformable solid under $\mathbf{f}_{\mathrm{LA}}$, the same argument predicts a finite yield stress for MIPS clusters; an external shear applied to a cluster at moderate $Pe$ should induce the same slip-line fluidization at lower $Pe$ than spontaneous reentrancy.
- Inference: the paper's finite-size statement implies that the reentrancy observed here is strongest in small droplets, so experiments with microfluidic or trap-confined active droplets should test reentrancy more readily than bulk samples.
Editorial analysis
A structured set of objections, weighed in public.
Referee Report
Summary. This manuscript studies reentrant motility-induced phase separation (MIPS) in overdamped active Brownian particles by molecular dynamics simulation. The author extracts coexistence densities from fits of the bimodal Voronoi density distribution using the log-normal form f_g and a power-law form f_l (Eqs. 13-14), and reports that the difference rho_l - rho_g is nonmonotonic in the Péclet number, implying reentrant MIPS. For the mechanism, the paper analyzes particle motion in the largest cluster, identifies slip lines and domain motion associated with dislocations, and proposes that the locally averaged self-propulsion force f_LA at the cluster surface generates stress that causes multiple slip deformation, destabilizing the dense phase at high Pe.
Significance. If validated, the proposed slip-deformation mechanism would offer a distinct pathway for high-Pe MIPS suppression, complementing the evaporation-based explanation of Ref. 23. The manuscript's strengths are its direct simulation approach, the availability of supplementary videos showing dislocation motion and slip deformation, and the explicit admission in ESI S.3 of the limitations of the fitting procedure. However, the central evidence rests on two pillars that are not yet quantitatively established: the fitting-based coexistence densities and the causal link from f_LA to slip deformation. Both need additional analysis before the conclusions can be accepted.
major comments (3)
- [§IV, Eqs. (13)-(14), ESI S.3, Tables S1-S2] The coexistence densities rho_g and rho_l, which constitute the main quantitative evidence for reentrancy, are obtained from fits whose functional form is not theoretically justified and whose fit quality is admittedly imperfect. ESI S.3 states that the fitting is misaligned with the tail on the left side of the main peak for several Péclet numbers. Because f_l increases as a power law and is used to compute rho_l through Eq. (16), a systematic bias in the left tail of the dense-phase peak will directly bias rho_l. With sample sizes as low as 4 (Tables S1-S2) and no error bars on rho_g or rho_l, the closing of rho_l-rho_g at high Pe cannot be distinguished from fit bias. The author should provide uncertainty quantification (e.g., bootstrap over independent runs), compare with a grid-density histogram fitted with standard Gaussian functions, and test robustness of the nonmonotonicity to alternative fitting forms.
- [§VII Discussion and §VIII Conclusion] The central mechanistic claim that f_LA generates stress on the cluster and causes the multiple slip deformation is not supported by a quantitative correlation or controlled test. The Discussion explicitly concedes that no specific relationship between f_LA and the motion of the domain was observed, and the future-work paragraph refers to the fluidization as an assumption. The observation that f_LA is large and inward-oriented at the cluster surface is expected from the collision geometry and does not by itself establish causation. To support the mechanism, the paper would need at least one of the following: a computed stress tensor, a correlation between local f_LA shear components and subsequent slip activity, or a perturbation in which f_LA is varied independently while slip frequency is monitored. As it stands, the mechanism claim is a hypothesis rather than a demonstrated result.
- [§V, Fig. 5 and Fig. S.2] The statement that the MSD plateau disappears for Pe = 800 is based on visual inspection of a single plot without a quantitative criterion or error bars. Since this observation is used to conclude that particles inside the cluster become fluid-like at high Pe, a quantitative measure (e.g., plateau height or effective exponent at a fixed lag time) with run-to-run variability should be reported. The MSD curves in Fig. S.2 also show a switch from glass-like to ballistic behavior near tau ~ 3/Pe for Pe <= 400 but earlier for Pe >= 800; clarifying this crossover would strengthen the fluidization claim.
minor comments (4)
- [Title and Abstract] The title contains a typo ('B rownian') and the abstract contains 'Partcles' and 'P artcle'; these should be corrected.
- [§IV, Eq. (14)] The fitting function f_l is defined only for phi < phi_0, but the integral in Eq. (16) runs from 0 to infinity; the definition should be completed by stating that f_l = 0 for phi >= phi_0 or by restricting the integration domain.
- [§IV, second additional comment] The sentence discussing the finite-size effect contains a grammatical break ('In Fig. 2(b) do not show this tendency'), which makes the argument difficult to follow; please rewrite this passage.
- [§III, Fig. 1 and §V] The notation density and the threshold c* would benefit from a brief intuitive explanation of why CFCC, rather than a geometric distance criterion, is used to define the interior of the cluster; the current text jumps quickly to the technical definition.
Circularity Check
No significant circularity: the reentrancy is read from simulated coexistence densities and the slip-deformation mechanism is inferred from independent particle trajectories; the f_LA causal link is an acknowledged assumption, not a fitted input.
full rationale
The paper's central observation (suppression of MIPS at high Pe) is obtained by fitting two functions f_g and f_l (Eqs. 13-14) to the measured Voronoi density distribution and computing rho_g and rho_l via Eqs. 15-16. This is a data-reduction procedure, not a prediction from a fitted parameter: no parameter is fitted to the reentrancy trend and then reused to 'predict' it. The ESI (S.3) concedes a fitting mismatch: 'the fitting is misaligned with the tail on the left side of the main peak,' which is a genuine measurement-bias risk for rho_l, but it does not make the trend definitionally equal to the fit. The mechanism section is not circular either: slip-lines are detected from dislocation trajectories (Section VI) and f_LA is computed from instantaneous orientations (Section VII); neither quantity is defined as the other. The causal step 'f_LA generates stress on the cluster, and it causes the multiple slip deformation' is an interpretation, and the paper itself tempers it: 'we could not observe a specific relationship between f_LA and the motion of the domain' and future-work states 'we assumed that the motion of the particles becomes fluid-like due to the inhomogeneity of f_LA.' That is an unsupported or overstated causal claim, a correctness risk, not reduction-by-construction. There are no load-bearing self-citations, no imported uniqueness theorem, and the model is standard overdamped ABP dynamics rather than a renamed known result. The reentrancy itself was already reported in Ref. [23], and the present simulation evidence is self-contained against that external benchmark. Hence the circularity score is 0.
Assumptions & free parameters
free parameters (1)
- Fitting parameters of fg and f_l (C, mu, sigma, D, phi0, a) =
Not reported; fitted independently for each (Pe, Phi, N)
assumptions (5)
- domain assumption Stokes-Einstein-Debye relation DT = d^2 DR / 3 is assumed (Eq. 5)
- domain assumption The system reaches steady state by t=1000
- ad hoc to paper The functional forms of fg and f_l are valid descriptions of the Voronoi density distribution
- ad hoc to paper The CFCC threshold c* correctly separates cluster interior from surface so that 'inside' particles are representative
- ad hoc to paper f_LA is causally related to the slip deformation
Cite this review
Pith. "Pith review of A reentrancy of motility-induced phase separation in overdamped active Brownian particles." pith.science (2026). https://pith.science/paper/UTRZQPJ2
@misc{pith2026250701553,
  author       = {Pith},
  title        = {Pith review of: A reentrancy of motility-induced phase separation in overdamped active Brownian particles},
  year         = {2026},
  howpublished = {\url{https://pith.science/paper/UTRZQPJ2}},
  note         = {Machine review of arXiv:2507.01553}
}
abstract
In a system of Self-Propelled Particles (SPPs), the combination of self-propulsion and excluded volume effects can result in a phase separation called Motility-Induced Phase Separation (MIPS). Previous studies reported that MIPS is one of the phenomena so-called "reentrant phase separation" ,i.e., MIPS is suppressed when the P\'eclet number $Pe$ (dimensionless self-propelled speed) is sufficiently large. We used a fundamental model of SPPs, i.e., overdamped Active Brownian Partcles (ABPs), to investigate the mechanism of the reentrancy of MIPS. We expect that elucidating the conditions under which MIPS occur is important, since MIPS is a phenomenon that can occur in a wide range of SPPs systems, and the potential applications of MIPS can also be wide range. Detailed investigation of particle motion revealed that a entire particle cluster deforms due to multiple slip deformation (known as plastic deformation in materials science). As $Pe$ increases, the frequency of occurrence of slip-lines increases, and the particle motion becomes fluid-like. Therefore, the shape of the cluster becomes unstable and the number of particles in the cluster decreases. Let $\bf{f}_{LA}$ be the local spatial average of the self-propelled force generated by the particles. The observation of the inhomogeneity in the magnitude and direction of $\bf{f}_{LA}$ shows that $\bf{f}_{LA}$ is large on the cluster surface and generally orients toward the cluster inside. We determined that $\bf{f}_{LA}$ generates stress on the cluster, and it causes the multiple slip deformation.
Figures


Figures from the paper (5 more)



Reference graph
Works this paper leans on
- [23]
- [1]
- [2]
-
[3]
3, we expected that the coexistence densi- ties satisfy the lever rule
From Fig. 3, we expected that the coexistence densi- ties satisfy the lever rule. V. DETERMINA TION OF THE INSIDE OF THE MAXIMUM CLUSTER AND CALCULA TION MEAN SQUARE DISPLACEMENT We focused on the particles contained inside the max- imum cluster and calculated the Mean Square Displace- ment(MSD) of the particles in the clusters. First, we will explain how...
-
[4]
B. ten Hagen, S. van Teeffelen and H. L¨ owen, J. Phys.:Condens. Matter , 2011, 23, 194119
work page 2011
-
[5]
This is consis- tent with previous studies reporting that MIPS cluster FIG
They show plateau-like behavior. This is consis- tent with previous studies reporting that MIPS cluster FIG. 4: Some examples of CFCC calculation results. (a) and (b) are visualizations of the values of CFCC. Colored circles indicate particles contained in the maximum cluster and gray circles indicate other particles. The relationship between the values o...
-
[6]
M. E. Cates, Rep. Prog. Phys. , 2012, 75, 042601
work page 2012
- [7]
Show all 66 references
-
[8]
C. M. B. Guti´ errez, C. Vanhille-Campos, F. Alarc´ on, I. Pagonabarraga, R. Brito and C. Valeriani, Soft Matter , 2021, 17, 10479–10491
2021
-
[9]
After the collisions, the orientations can vary due to rotational dif- fusion
Even if the orientation vectors {ni} are not perfectly antiparallel to the normal vector of the cluster surface, the particles can still collide with the cluster. After the collisions, the orientations can vary due to rotational dif- fusion. Therefore, fLA can also tilt from t...
-
[10]
Romanczuk, M
P. Romanczuk, M. B¨ ar, W. Ebeling, B. Lindner and L. Schimansky-Geier, The European Physical Journal Special Topics, 2012, 202, 1–162
2012
-
[11]
A. P. Solon, M. E. Cates and J. Tailleur, The European Physical Journal Special Topics , 2015, 224, 1231–1262
2015
-
[12]
Volpe, I
G. Volpe, I. Buttinoni, D. Vogt, H.-J. K¨ ummerer and C. Bechinger, Soft Matter , 2011, 7, 8810–8815
2011
-
[13]
Fodor, C
E. Fodor, C. Nardini, M. E. Cates, J. Tailleur, P. Visco and F. van Wijland, Phys. Rev. Lett. , 2016, 117, 038103
2016
-
[14]
Koumakis, C
N. Koumakis, C. Maggi and R. Di Leonardo, Soft Matter, 2014, 10, 5695–5701
2014
-
[15]
Jiang, N
H.-R. Jiang, N. Yoshinaga and M. Sano, Phys. Rev. Lett., 2010, 105, 268302
2010
-
[16]
M. E. Cates and J. Tailleur, Annu. Rev. Condens. Matter Phys., 2015, 6, 219–244
2015
-
[17]
T. B. Jones, 1983 Annual Meeting Industry Applications Society, 1983, pp. 1029–1033
1983
-
[18]
Dommersnes, A
P. Dommersnes, A. Mikkelsen and J. O. Fossum, The Eu- ropean Physical Journal Special Topics , 2016, 225, 699– 706
2016
-
[19]
Geyer, D
D. Geyer, D. Martin, J. Tailleur and D. Bartolo, Phys. Rev. X , 2019, 9, 031043
2019
-
[20]
Y. Fily, S. Henkes and M. C. Marchetti, Soft Matter , 2014, 10, 2132–2140
2014
-
[21]
Buttinoni, J
I. Buttinoni, J. Bialk´ e, F. K¨ ummel, H. L¨ owen, C. Bechinger and T. Speck, Phys. Rev. Lett. , 2013, 110, 238301
2013
-
[22]
G. S. Redner, M. F. Hagan and A. Baskaran, Phys. Rev. Lett., 2013, 110, 055701
2013
-
[24]
J. D. Weeks, D. Chandler and H. C. Andersen, J. Chem. Phys., 1971, 54, 5237–5247
1971
-
[25]
Mandal, B
S. Mandal, B. Liebchen and H. L¨ owen, Phys. Rev. Lett. , 2019, 123, 228001
2019
-
[26]
Schwarz-Linek, C
J. Schwarz-Linek, C. Valeriani, A. Cacciuto, M. E. Cates, D. Marenduzzo, A. N. Morozov and W. C. K. Poon, Proc. Natl. Acad. Sci. U. S. A. , 2012, 109, 4052–4057
2012
-
[27]
J. Su, M. Feng, Y. Du, H. Jiang and Z. Hou, Commun. Phys., 2023, 6, 58
2023
-
[28]
Tarjus and D
G. Tarjus and D. Kivelson, J. Chem. Phys. , 1995, 103, 3071–3073
1995
-
[29]
Dill and S
K. Dill and S. Bromberg, Molecular Driving Forces: Sta- tistical Thermodynamics in Biology, Chemistry, Physics, and Nanoscience , Garland Science, New York, 2nd edn, 2010
2010
-
[30]
P. J. W. Debye, Polar molecules , The Chemical Catalog Company, inc., New York, 1929
1929
-
[31]
B. J. Bruce and P. Robert, Dynamic light scattering : with applications to chemistry, biology, and physics , Wi- ley, New York, 2000
2000
-
[32]
Darij, arXiv, 2023, preprint, arXiv:2308.04512v3, https://arxiv.org/abs/2308.04512
G. Darij, arXiv, 2023, preprint, arXiv:2308.04512v3, https://arxiv.org/abs/2308.04512
2023 arXiv
-
[33]
Martin-Roca, R
J. Martin-Roca, R. Martinez, L. C. Alexander, A. L. Diez, D. G. A. L. Aarts, F. Alarcon, J. Ram ´ ırez and C. Valeriani, J. Chem. Phys. , 2021, 154, 164901
2021
-
[34]
J. A. Anderson, J. Glaser and S. C. Glotzer, Comput. Mater. Sci. , 2020, 173, 109363
2020
-
[35]
Ernesto, arXiv, 2013, preprint, arXiv:1302.4378v2, https://arxiv.org/abs/1302.4378
E. Ernesto, arXiv, 2013, preprint, arXiv:1302.4378v2, https://arxiv.org/abs/1302.4378
2013 arXiv
-
[36]
E. A. B. Over, I. T. C. Hooge and C. J. Erkelens, Behav- ior Research Methods , 2006, 38, 251–261
2006
-
[37]
Voronoi, Journal f¨ ur die reine und angewandte Math- ematik, 1908, 133, 97–178
G. Voronoi, Journal f¨ ur die reine und angewandte Math- ematik, 1908, 133, 97–178
1908
-
[38]
It is at the bottom of this preprint
Electronic supplementary information (ESI) available. It is at the bottom of this preprint. 10
-
[39]
R. Y. Yang, R. P. Zou and A. B. Yu, Phys. Rev. E , 2002, 65, 041302
2002
-
[40]
A. P. Solon, J. Stenhammar, M. E. Cates, Y. Kafri and J. Tailleur, Phys. Rev. E , 2018, 97, 020602
2018
-
[41]
Usui, Journal of Geographical Systems , 2018, 20, 295– 316
H. Usui, Journal of Geographical Systems , 2018, 20, 295– 316
2018
-
[42]
Dornan and W
V. Dornan and W. E. Harris, The Astronomical Journal , 2024, 168, 48
2024
-
[43]
J. T. Siebert, F. Dittrich, F. Schmid, K. Binder, T. Speck and P. Virnau, Phys. Rev. E , 2018, 98, 030601
2018
-
[44]
Szamel and E
G. Szamel and E. Flenner, EPL, 2021, 133, 60002
2021
-
[45]
X.-q. Shi, G. Fausti, H. Chat´ e, C. Nardini and A. Solon, Phys. Rev. Lett. , 2020, 125, 168001
2020
-
[46]
Brandes and D
U. Brandes and D. Fleischer, STACS 2005, Berlin, Hei- delberg, 2005, pp. 533–544
2005
-
[47]
Caprini and U
L. Caprini and U. Marini Bettolo Marconi, Soft Matter , 2021, 17, 4109–4121
2021
-
[49]
Delaunay, Bulletin of the Academy of Sciences of the U
B. Delaunay, Bulletin of the Academy of Sciences of the U. S. S. R. Classe des Sciences Mathematiques et Na- turelles, 1934, 7, 793–800
1934
-
[50]
Digregorio, D
P. Digregorio, D. Levis, L. F. Cugliandolo, G. Gonnella and I. Pagonabarraga, Soft Matter , 2022, 18, 566–591
2022
-
[51]
Z. D. Jastrzebski, The nature and properties of engineer- ing materials , Wiley, New York, 1977. Supplementary information This supplementary information contains additional figures, vi deos and data that supplement the main text. S.1. DIMENSIONLESS EQUA TIONS OF MOTION Dimensi...
1977
-
[52]
The argument of ψ i indicates the inclination of the crystal axis to x-axis
When the crystal is distorted, |Ni| ̸ = 6 and θij ̸= πn/ 3, (n ∈ N), |ψ i| takes a value smaller than 1. The argument of ψ i indicates the inclination of the crystal axis to x-axis. When the entire crystal is gradually ro- tated by π/ 3, the angle θij of each bond vector gradu...
-
[53]
video1: https://youtube.com/shorts/IYU8HlcsLiY? feature=share
-
[54]
video2: https://youtube.com/shorts/r4fIz6pV0LU? feature=share
-
[55]
video3: https://youtube.com/shorts/DAiDMCXSzUI? feature=share
-
[56]
video4: https://youtube.com/shorts/pkxJtGwAZGE? feature=share
-
[57]
video5: https://youtube.com/shorts/xxlYuCuQDY4? feature=share
-
[58]
video6: https://youtube.com/shorts/kAjgBw22X7w? feature=share
-
[59]
video7: https://youtube.com/shorts/uq6lMlboXB8? feature=share
-
[60]
E. P. Bernard and W. Krauth, Phys. Rev. Lett. , 2011, 107, 155704
2011
-
[61]
S. C. Kapfer and W. Krauth, Phys. Rev. Lett., 2015, 114, 035702
2015
-
[62]
Digregorio, D
P. Digregorio, D. Levis, A. Suma, L. F. Cugliandolo, G. Gonnella and I. Pagonabarraga, Phys. Rev. Lett. , 2018, 121, 098003
2018
-
[63]
Digregorio, D
P. Digregorio, D. Levis, L. F. Cugliandolo, G. Gonnella and I. Pagonabarraga, Soft Matter , 2022, 18, 566–591. 5 P e= 50 60 70 80 90 100 200 300 400 500 600 700 800 900 1000 N = 1024 15 15 15 15 15 15 10 10 10 10 10 10 10 10 6 2048 15 11 11 10 10 15 8 8 8 8 8 8 8 8 7 4096 15 1...
2022
-
[64]
6 15 11 11 10 10 16 10 10 10 10 15 5 5 10 20
-
[65]
7 4 4 4 4 4 4 4 4 4 4 4 4 8 8 4
-
[66]
8 4 4 4 4 4 4 4 4 4 4 4 4 4 8 8 TABLE S.2: The number of samples with the parameter fixed as N = 8192 and P e and Φ are changed
-
[800]
The size of the arrow is proportional to the magnitude of the fLA of the grid
Here, fLA is average value of self-propelled forces within each grid (total number of grids is 10 × 10). The size of the arrow is proportional to the magnitude of the fLA of the grid. The colormap below the figure shows the relationship between the color and the orientation. In...
Reviewed August 6, 2026 · model on record in the stance chip above.
Discussion (0). Sign in to comment.