REVIEW 4 major objections 5 minor 14 references
An Associated Particle Imaging System for Soil-Carbon Measurements
T0 review · 4 major / 5 minor · reviewed 2026-08-14 · deepseek-v4-flash
Pith's one-line read The paper demonstrates that an associated-particle imaging system based on a DT neutron generator can reconstruct neutron scattering sites in soil in three dimensions, with lateral resolution under 5 cm and depth resolution under 7 cm…
desk verdict Genuine first demonstration of API for soil carbon, but the headline 3D resolution claim is not yet supported by the data shown; the paper deserves a serious referee with major revision. read the letter →
The pith
A machine-rendered reading of the paper's core claim, the machinery that carries it, and where it could break.
The reading
What carries the argument
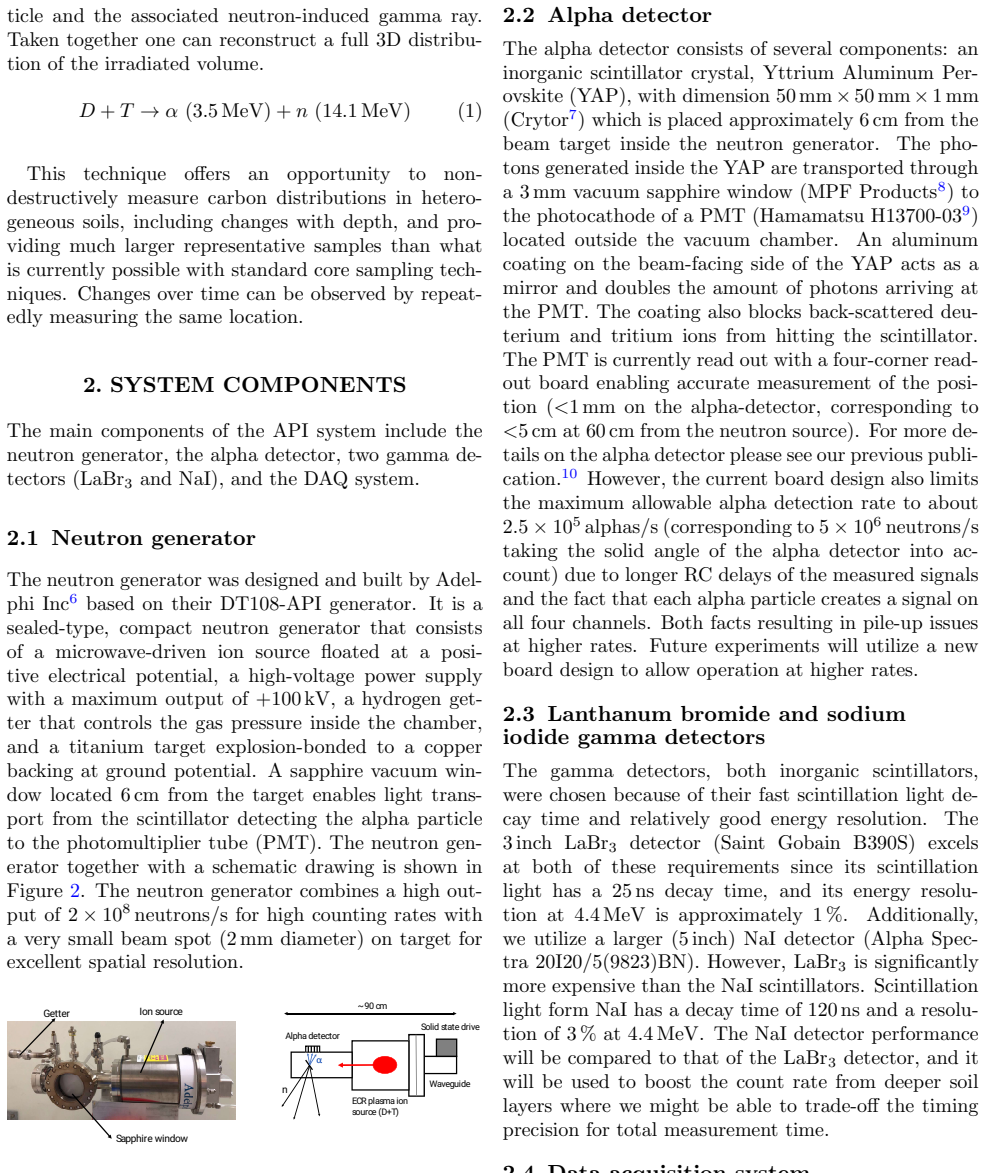
The carrying mechanism is alpha-tagged neutron time-of-flight, also called associated particle imaging. Each D+T fusion emits a 3.5 MeV alpha particle and a 14.1 MeV neutron in opposite directions; a thin position-sensitive yttrium aluminum perovskite (YAP) scintillator records the alpha's position and arrival time, which gives the neutron's direction and starts a clock. When that neutron scatters inelastically off a nucleus in the soil, the nucleus emits a characteristic gamma ray (for example 4.44 MeV from 12C), and a fast scintillator (LaBr3 or NaI) records the gamma's arrival time and energy. The time difference converts to distance traveled by the neutron, so each detected gamma is assigned a 3D position. A 500-MHz digital DAQ with constant-fraction discrimination supplies the timing, and energy gating of the gamma spectrum selects which element produced each event.
What would settle it
Measure the FWHM of the alpha-to-LaBr3 time difference on the actual stacked soil-box array with the same CFD settings; if it is larger than the 1.3 ns obtained on the 1-inch dry sand sample, the <7 cm depth-resolution claim would not be supported by the data. A complementary check is to place a graphite slab of known thickness at a known depth and verify that the reconstructed 4.44 MeV depth profile has an edge width no larger than about 7 cm.
Extended reading notes
Core claim
The discovery is that a compact, sealed DT neutron generator equipped with a position-sensitive alpha detector and fast gamma-ray detectors can do 3D element-specific imaging of soil. The paper demonstrates this on a 2x3x3 stack of aluminum boxes filled with a homogeneous sand-worm-casting mixture (4% carbon by weight), with a graphite brick and a pure-sand box as standards. Reconstructed x-y and y-z projections show the separated samples, and gamma-ray spectra selected from each spatial region show the expected inelastic-scattering lines. The paper claims lateral resolution of <5 cm at 60 cm from the source and depth resolution of <7 cm, and it shows that the 4.497 MeV silicon line sits close enough to the 4.44 MeV carbon line that it must be accounted for in carbon quantification.
Load-bearing premise
The claimed <7 cm depth resolution depends on a 1.3 ns timing FWHM measured on a separate 1-inch dry sand sample and reported as part of a forthcoming publication; the paper does not directly show that the same timing holds for the stacked soil-box geometry and the 9-hour run.
Editorial extensions
If this is right
- Soil carbon can be mapped in three dimensions non-destructively, with voxels of roughly a few centimeters, removing the need for destructive coring to see depth changes.
- Because gamma spectra can be gated to specific regions, unwanted counts from structural materials and shielding are strongly reduced, so cleaner spectra can be obtained from buried volumes.
- The same measurement yields gamma lines from carbon, silicon, oxygen, and aluminum, so one scan can report several soil constituents simultaneously.
- Repeated measurements of the same location become possible, allowing carbon stock changes over time to be tracked without disturbing the soil.
- At full neutron output with a faster alpha readout, the 9-hour acquisition could drop below 15 minutes, making the technique practical for field-scale surveys.
Reading between the lines
- A practical carbon-quantification workflow will need to deconvolve the 28Si 4.5 MeV line from the 12C 4.44 MeV line; the paper presents spectra but not a calibrated carbon density map, so the quantitative accuracy of the method remains open.
- If the timing resolution can be pushed toward the ~1 ns the authors speculate is possible, depth resolution would improve to roughly 5 cm, which would make finer soil stratification visible; the paper does not demonstrate this improvement.
- The same region-of-interest gating logic could be extended to the 6.13 MeV oxygen line, potentially mapping soil moisture or oxide content in the same scan, an application the paper does not explore.
- The depth-resolution claim rests on a single timing measurement made on a 1-inch dry sand sample; a direct test on the real soil-box geometry would either confirm the 7 cm figure or reveal its limit.
Signed reviews
Editorial analysis
A structured set of objections, weighed in public.
Referee Report
Summary. The manuscript describes an Associated Particle Imaging (API) system for non-destructive soil-carbon measurements and reports first experimental results from a premixed sand sample containing 4% carbon by weight. A DT neutron generator with a position-sensitive alpha detector, LaBr3 and NaI gamma detectors, and a Pixie-16 digital DAQ are used to reconstruct the 3D location of neutron inelastic-scattering interactions from the alpha-particle position and the time difference between alpha and gamma detection. The authors present reconstructed x-y and y-z projections of a stacked soil-box phantom with graphite and sand standards, gamma-ray spectra extracted from selected spatial regions, and a table of identified inelastic lines. They claim a lateral resolution below 5 cm at 60 cm from the neutron source and a depth resolution below 7 cm, based on a 1.3 ns FWHM timing measurement, and they state that 3D resolution of several centimeters in all dimensions has been demonstrated. The paper also outlines planned improvements to increase count rate and reduce measurement time.
Significance. If the resolution and quantification claims are substantiated, the instrument would offer a genuinely useful capability: non-destructive, three-dimensional mapping of carbon and other light elements in soil with centimeter-scale resolution, on much larger representative volumes than conventional core sampling. The approach is physically direct, uses no fitted parameters, and the paper shows a clean demonstration of region-of-interest gamma spectroscopy with clear separation of carbon, silicon, and oxygen lines. The authors are also candid about limitations, including the weak visibility of the phantom in the y-z projection and energy-resolution degradation due to gain drift. However, the central resolution claims are not yet fully supported by the data shown: the depth-resolution claim depends on a calibration measurement not presented in the manuscript, and the lateral-resolution claim is inferred from geometry rather than measured in the reconstructed images. The quantitative connection to the known 4% carbon content is also not established. These gaps are fixable and do not invalidate the approach, but they are load-bearing for the paper's main conclusions.
major comments (4)
- [Section 2.4, Fig. 4] The central claim of a depth resolution below 7 cm rests entirely on the 1.3 ns FWHM timing value reported in Section 2.4, which is said to come from a forthcoming publication using a 1-inch-thick dry sand sample. The timing measurement itself is not shown, and no depth calibration is performed in the stacked soil-box geometry actually used in the experiment. Figure 4 explicitly states that the graphite and sand boxes are not clearly visible in the y-z projection, so the data do not provide independent evidence that the depth coordinate is resolved at the 7 cm level in the reported measurement. Please include the timing distribution, validate the depth scale against a known interface or step in the measured geometry, or soften the depth-resolution claim accordingly.
- [Section 2.2, Fig. 3] The claimed lateral resolution of <5 cm at 60 cm is derived from the stated <1 mm position accuracy of the alpha detector through simple geometry, rather than from a measured edge response or line-spread function in the reconstructed image. Figure 3 shows the x-y projection but does not provide a quantitative measure of how sharply the soil, sand, and graphite boundaries are reconstructed. Please report a lateral-resolution measurement obtained from the data, with uncertainties, or explicitly label the current value as an expected geometric limit rather than a demonstrated resolution.
- [Section 3, Fig. 5] The title and abstract promise the ability to 'measure carbon in soil,' yet the paper provides no quantitative comparison of the reconstructed carbon signal to the known 4% carbon content of the soil mixture. The gamma spectra in Fig. 5 are normalized and displayed by eye, and no peak-area or carbon-yield analysis is presented. To support the soil-carbon application, please fit the 4.44 MeV carbon peak in the soil spectrum, account for the nearby 28Si line at 4.497 MeV, compare the carbon signal in the soil and graphite regions with the sand blank, and report the resulting carbon mass or density with an uncertainty. Without this step, the quantitative claim of carbon measurement is not demonstrated.
- [Section 3, Fig. 5] The paper attributes the degradation of LaBr3 energy resolution from about 1% to about 3% at 4.4 MeV to gain drift during the 9-hour run. Since the depth-resolution claim relies on a timing FWHM measured under different, presumably shorter, conditions, the stability of the timing response over the long measurement is not established. Please provide evidence that the 1.3 ns timing FWHM is valid over the full 9-hour acquisition, or quantify the possible drift in the timing path and its effect on the claimed <7 cm depth resolution.
minor comments (5)
- [Section 2.4] There is a typo in 'Measurements ... where used to obtain' which should read 'were used to obtain'; similarly, 'horizontal extend of the sample' should be 'horizontal extent of the sample.'
- [Section 4] The sentence 'First experimental results and characterization of capabilities where obtained' should read 'were obtained.'
- [Section 3, Table 1 caption] The phrase 'which it hard to resolve' is a typo; it should be 'which is hard to resolve.'
- [Section 2.2] The statement that the alpha-detector position accuracy is '<1 mm on the alpha-detector, corresponding to <5 cm at 60 cm' would benefit from a brief geometrical explanation or a reference to the previous publication, since the conversion depends on the distance from the alpha detector to the neutron target and the flight path to the sample.
- [General] The y-z projection in Fig. 4 is difficult to interpret because the axis labeling and color scale are not fully described; please add a scale bar, color-bar units, and a description of the coordinate origin relative to the neutron generator and the soil-box array.
Circularity Check
No significant circularity: the 3D resolution claims are unit conversions of independently measured hardware resolutions, not re-derivations of the paper's own inputs.
full rationale
The paper's central quantitative claims—<5 cm lateral resolution and <7 cm depth resolution—are direct consequences of measured hardware quantities stated in the paper. The lateral resolution follows from the alpha-detector position resolution (<1 mm) projected to 60 cm from the neutron source, and the depth resolution follows from the measured 1.3 ns FWHM timing resolution converted through the known 14.1 MeV neutron velocity. Neither quantity is fitted to the soil-box data being reported, and neither is defined by the carbon/silicon/oxygen spectra that constitute the experimental result. The reconstructed images and region-selected gamma spectra are independent measurements obtained with the instrument, not predictions deduced from the resolution numbers. The only self-citation, reference [10], supports component details of the alpha detector and is not load-bearing for the soil-carbon demonstration. The 'forthcoming publication' timing calibration is a legitimate concern about evidential strength, but it is not circular: it is an external empirical input measured in a separate dry-sand sample. No equation in the paper reduces to its own output, no fitted parameter is renamed as a prediction, and no uniqueness theorem or ansatz is imported from the authors' prior work. Thus the derivation chain is self-contained, with only a minor and non-load-bearing self-citation, giving a circularity score of 1.0.
Assumptions & free parameters
assumptions (3)
- standard math DT fusion emits an alpha particle and a 14.1 MeV neutron at 180 degrees in the center-of-mass frame, so the alpha position defines the neutron direction.
- domain assumption Inelastic neutron scattering on C, Si, and O produces characteristic gamma lines (4.44, 4.497, 6.13 MeV) with sufficient yield for detection.
- domain assumption The 12C 4.44 MeV peak can be resolved from the 28Si 4.497 MeV peak in soil spectra at the achieved detector resolution.
Cite this review
Pith. "Pith review of An Associated Particle Imaging System for Soil-Carbon Measurements." pith.science (2026). https://pith.science/paper/V6O72JNU
@misc{pith2026190800950,
  author       = {Pith},
  title        = {Pith review of: An Associated Particle Imaging System for Soil-Carbon Measurements},
  year         = {2026},
  howpublished = {\url{https://pith.science/paper/V6O72JNU}},
  note         = {Machine review of arXiv:1908.00950}
}
abstract
We present first results from experimental data showing the capabilities of an Associated Particle Imaging system to measure carbon in soil and other elements. Specifically, we present results from a pre-mixed soil sample containing pure sand (SiO$_2$) and 4% carbon by weight. Because the main isotopes of all those three elements emit characteristic high-energy gamma rays following inelastic neutron scattering, it is possible to measure their distribution with our instrument. A 3D resolution of several centimeters in all dimensions has been demonstrated.
Figures


Figures from the paper (1 more)

Reference graph
Works this paper leans on
-
[1]
C. L. Fontana, A. Carnera, M. Lunardon, F. Pino, C. Sada, F. Soramel, L. Stevanato, G. Neb- bia, C. Carasco, B. Perot, A. Sardet, G. Sannie, A. Iovene, C. Tintori, K. Grodzicki, M. Moszyski, P. Sibczyski, L. Swiderski, and S. Moretto, “De- tection system of the first rapidly relocatable tagged neutron inspection system (rrtnis), devel- oped in the framewor...
-
[2]
In-field tests of the euritrack tagged neutron inspection system,
C. Carasco, B. Perot, S. Bernard, A. Mariani, J.-L. Szabo, G. Sannie, T. Roll, V. Valkovic, D. Sudac, G. Viesti, M. Lunardon, C. Bottosso, D. Fabris, G. Nebbia, S. Pesente, S. Moretto, A. Zenoni, A. Donzella, M. Moszynski, M. Gierlik, T. Batsch, D. Wolski, W. Klamra, P. L. Tourneur, M. Lhuissier, A. Colonna, C. Tintori, P. Peerani, V. Sequeira, and M. Sal...
work page 2008
-
[3]
Development of a time-tagged neu- tron source for snm detection,
Q. Ji, B. Ludewigt, J. Wallig, W. Waldron, and J. Tinsley, “Development of a time-tagged neu- tron source for snm detection,” Physics Procedia 66, pp. 105 – 110, 2015. The 23rd International Conference on the Application of Accelerators in Research and Industry - CAARI 2014
work page 2015
-
[4]
Soil carbon debt of 12,000 years of human land use,
J. Sanderman, T. Hengl, and G. J. Fiske, “Soil carbon debt of 12,000 years of human land use,” Proc. Natl. Acad. Sci. U. S. A. 114, pp. 9575– 9580, Sept. 2017
work page 2017
-
[5]
J. Huang, B. Minasny, A. B. McBratney, J. Padar- ian, and J. Triantafilis, “The location- and scale- specific correlation between temperature and soil carbon sequestration across the globe,” Sci. Total Environ. 615, pp. 540–548, Feb. 2018
work page 2018
- [6]
-
[7]
CRYTUR, spol. s r.o. https://crytur.cz, 2018
work page 2018
- [8]
Show all 14 references
-
[9]
https://www.hamamatsu.com, 2018
Hamamatsu Photonics K.K. https://www.hamamatsu.com, 2018
2018
-
[10]
Position sensitive alpha detector for an associate particle imaging system,
M. A. Unzueta, W. Mixter, Z. Croft, J. Joseph, B. Ludewigt, and A. Persaud, “Position sensitive alpha detector for an associate particle imaging system,” arXiv.org , p. 1811.08591, Nov. 2018
2018 arXiv
-
[11]
XIA, Pixie-16 User Manual , Aug. 2018
2018
-
[12]
Knoll, Radiation Detection and Measurement , Wiley, 3rd ed., 2010
G. Knoll, Radiation Detection and Measurement , Wiley, 3rd ed., 2010
2010
-
[13]
As- sociated particle imaging instrumentation for future planetary surface missions,
M. Litvak, Y. Barmakov, S. Belichenko, R. Bestaev, E. Bogolubov, A. Gavrychenkov, A. Kozyrev, I. Mitrofanov, A. Nosov, A. Sanin, V. Shvetsov, D. Yurkov, and V. Zverev, “As- sociated particle imaging instrumentation for future planetary surface missions,” Nucl. Instrum. Methods...
2019
-
[2017]
Worth, TX, USA
Conference on the Application of Acceler- ators in Research and Industry, CAARI 2016, 30 October 4 November 2016, Ft. Worth, TX, USA
2016
Reviewed August 14, 2026 · model on record in the stance chip above.
Discussion (0). Continue with ORCID to comment.