REVIEW 4 major objections 5 minor 28 references
This paper claims a Bayesian smooth fit pins the global 12C+12C S-factor at 1.5 MeV to (2.13±0.01)×10^16 keV b in the body and 1.20×10^16 keV b in the abstract—both below the traditional 1975 normalization.
Reviewed by Pith at T0; open to challenge. T0 means a machine referee read the full paper against a public rubric. the ladder, T0–T4 →
T0 review · deepseek-v4-flash
2026-08-03 15:36 UTC pith:VD2Q436E
load-bearing objection A well-intentioned re-analysis undermined by an error in the uncertainty weighting and an abstract that disagrees with the body; the sub-percent error bar is an artifact. the 4 major comments →
Bayesian Smooth-Fit Extrapolation of the ¹²C+{}¹²C Astrophysical S Factor
The pith
A machine-rendered reading of the paper's core claim, the machinery that carries it, and where it could break.
Core claim
On its own terms, the paper's discovery is that when heterogeneous low-energy datasets—direct measurements, Coulomb-corrected Trojan Horse points, and inverse-kinematics results—are forced to agree with a single smooth quadratic in log10 S*(E), the allowed band collapses to a very narrow envelope. The central number is quoted in the body as S*(1.5 MeV) = (2.13+0.01−0.01)×10^16 keV b, corresponding to 0.45% uncertainty; the abstract quotes S*(1.5 MeV) = 1.20×10^16 keV b. Both values are below the 1975 reference normalization of 3.0×10^16 keV b. The author takes this as evidence against a sharp rise of S*(E) at low energies and against a low-energy fusion-hindrance pattern, and in favor of a r
What carries the argument
The carrying object is the modified astrophysical factor S*(E) = S(E)e^{0.46E}, whose base-10 logarithm is fitted as a quadratic a0 + a1(E−E0) + a2(E−E0)^2 over 1.5–3.5 MeV with pivot E0 = 1.5 MeV. The fit is done in log space so errors become approximately Gaussian; a flat prior yields a Gaussian posterior for the coefficients, and Monte Carlo draws from the covariance matrix propagate the band to S*(E). To keep point clusters from dominating, the analysis replaces each uncertainty by σ_i/√N when N measurements occupy a close energy region, and assigns a flat 25% relative error to all datasets except the inverse-kinematics one. The machinery's job is to turn many inconsistent data points in
Load-bearing premise
The load-bearing premise is that, after assigning a flat 25% uncertainty and applying the √N reduction, the remaining scatter among the 614 points can be treated as independent Gaussian noise; if the real systematic differences among experiments are larger or correlated, the quoted 0.45% band and the central value itself do not follow.
What would settle it
Recalculate the same posterior exactly as specified in the paper: if the pipeline reproduces 1.20×10^16 keV b, the body's 2.13 is wrong; if it reproduces 2.13, the abstract is wrong. Independently, repeat the fit with per-dataset normalization nuisance parameters and no √N grouping; if the 68% interval at 1.5 MeV widens beyond roughly 20% or the median moves outside 1.2–2.2 ×10^16 keV b, the claimed narrow constraint does not survive a more honest error model.
If this is right
- If the smooth posterior is correct, the 12C+12C fusion rate at T9 = 0.3–1.2 is only 33–46% of the commonly used analytic rate, materially slowing carbon burning in stellar models.
- The 68% credible interval quoted at 1.5 MeV is so narrow (0.45%) that it would make S*(1.5 MeV) a sharp anchor for any future R-matrix or reaction-rate evaluation.
- The absence of a steep low-energy rise in the smooth fit means the low-energy enhancement suggested by a plane-wave Trojan Horse analysis is not supported once Coulomb corrections and inverse-kinematics data are included.
- The fit is deliberately restricted to the smooth component, so narrow resonances remain to be added; the quoted rate should be regarded as a truncated rate above T9 ≈ 1.2.
Where Pith is reading between the lines
- Editorial inference: the 0.45% credible interval is almost certainly an artifact of the error model, because assigning every non-inverse-kinematics dataset the same 25% uncertainty and then dividing by √N removes the between-dataset scatter that carries real systematic information.
- Editorial inference: the abstract/body disagreement (1.20 vs 2.13 ×10^16 keV b) is large enough that no downstream comparison—rate ratios, stellar yields—should be trusted until the published number is reconciled in a single consistent workflow.
- Editorial inference: a straightforward calibration test would be to generate synthetic 12C+12C-like datasets from a known smooth S*(E) plus realistic correlated systematics, then apply this pipeline and check whether the 68% interval covers the truth; one would expect it to badly undercover.
- Editorial inference: the smooth-component posterior could be used as a prior for the background term of a full R-matrix fit, which would yield a complete stellar rate and test whether residual resonance structure changes the 1.5 MeV value.
Editorial analysis
A structured set of objections, weighed in public.
Referee Report
Summary. The paper proposes a Bayesian smooth-fit of log10 S*(E) using a quadratic polynomial over the energy range 1.5–3.5 MeV, combining direct measurements, Coulomb-renormalized Trojan Horse Method data, and the inverse-kinematics results of Nan et al. The central claims are a tightly constrained value S*(1.5 MeV) = (2.13^{+0.01}_{-0.01}) × 10^16 keV b (a 68% credible interval of ±0.45%) and a reduced stellar carbon-burning rate relative to the CF88 reference. The linear algebra of the Gaussian posterior and the Monte Carlo propagation are standard. However, the abstract quotes a different central value (1.20 × 10^16 keV b), the claimed reaction-rate reduction is not derived anywhere in the body, and the quoted sub-percent uncertainty is controlled by ad hoc uncertainty assignments, including a σ/√N rescaling that, as implemented, increases rather than decreases the weight of clustered data.
Significance. If the analysis were sound, a smooth global extrapolation anchored by inverse-kinematics and THM constraints would be a useful input for nuclear astrophysics, and the paper is genuinely transparent in presenting its equations and pipeline (data → likelihood → posterior → S*(E)). It also claims robustness checks against cubic/quartic extensions. But the central numerical result is internally inconsistent, the uncertainty model has a load-bearing flaw, and the astrophysical rate conclusion is not substantiated. Until these are resolved, the paper's contribution cannot be assessed; the sub-percent credible interval, in particular, appears to be an artifact of the uncertainty model rather than a robust data-driven constraint.
major comments (4)
- [Abstract vs. Sec. V B and Sec. VI] The abstract states S*(1.5 MeV) = 1.20 × 10^16 keV b, whereas Eq. (34) and Eq. (35) quote S*(1.5 MeV) = 2.13 × 10^16 keV b. These differ by a factor of 1.8, which is large enough to alter the astrophysical conclusion. The abstract also claims R_present/R_CF88 ≈ 0.33–0.46, but no reaction-rate calculation, temperature integration, or comparison with CF88 appears in the body; this is an unsupported central claim.
- [Sec. V D, Eq. (8)] The σ_eff = σ_i/√N prescription is introduced to prevent clusters of closely spaced points from dominating the fit. In the likelihood of Eq. (8), however, replacing σ_i by σ_i/√N multiplies each individual point's weight by N. A cluster of N points therefore contributes N^2/σ_i^2 rather than N/σ_i^2 to the chi-square, so clusters dominate more, not less. This directly contradicts the stated purpose and inflates the information content of the 614-point dataset. Since the 0.45% credible interval in Eq. (34) depends on this weighting, the headline uncertainty is not meaningful as presented.
- [Eqs. (1), (2), (31), (34)] The central value and its uncertainty are not independent measurements: because the pivot is E0 = 1.5 MeV, Eq. (31) gives y0 = a0, so S*(1.5 MeV) = 10^{a0} and the ±0.45% interval are direct re-statements of the fitted polynomial coefficient and its covariance. That covariance is governed by the uniform 25% uncertainty (Eq. 1), the 5% floor for the Nan et al. data (Eq. 2), and the σ/√N rescaling. These are ad hoc choices, and no sensitivity analysis is provided. The claim in Sec. V D that the narrow posterior arises naturally from N = 614 rather than from the uncertainty assignments is therefore not supported.
- [Sec. II D, Eq. (3)] The adequacy of the quadratic model is asserted rather than demonstrated. Item 4 says higher-order terms do not improve the Bayesian evidence and item 5 says robustness checks confirm stability, but no evidence values, chi-square comparisons, or robustness plots are shown. Without these, the reader cannot check whether the smooth-background assumption is consistent with the data or whether the narrow posterior is an artifact of the restricted model space.
minor comments (5)
- [Abstract] The abstract says data are used at 'E < 3.5 MeV', but the fit is restricted to 1.5 ≤ E ≤ 3.5 MeV. The lower bound should be stated explicitly.
- [Eq. (33)] Equation (33) contains (1.5 − E0), which is zero by the definition E0 = 1.5 MeV. This is needlessly confusing and should be simplified to S*(1.5 MeV) = 10^{a0}.
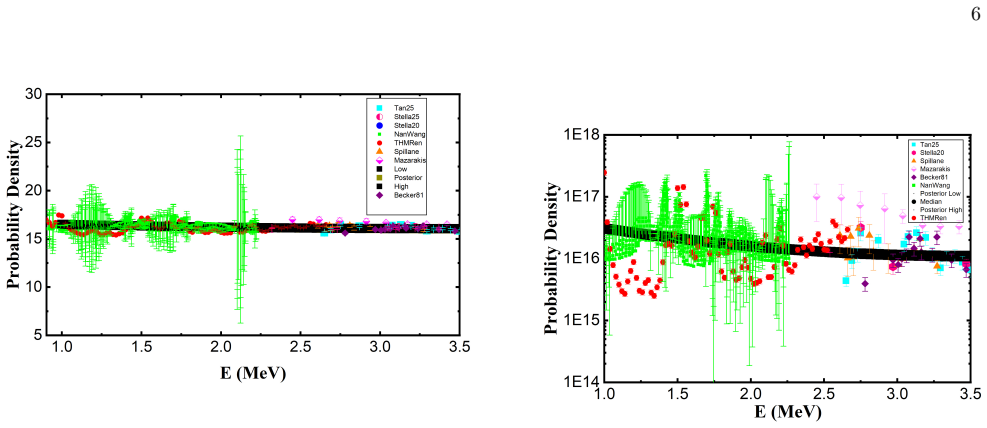
- [Figs. 1 and 2] Both captions state that the median curve is visually indistinguishable from the band boundaries. As a result, the figures do not convey the fit quality or the energy dependence of the uncertainty and should be replotted with a scale where the median is visible.
- [References] Reference [8] contains a duplicated '192702)', and reference [21] contains garbled text ('tieacce♪tlowercase'). The reference list needs a careful editorial pass.
- [Notation] S and S^* are used interchangeably; Eq. (7) defines S^* = S e^{0.46E}, but Eqs. (29) and (34) sometimes quote Sglobal and sometimes S^*. The distinction should be made consistently.
Circularity Check
No significant circularity: the reported S*(1.5 MeV) is the fitted quadratic coefficient at the pivot energy, and the band is standard covariance propagation.
full rationale
The paper is transparently an empirical fit rather than a first-principles derivation. Equation (3) posits log10 S*(E) as a quadratic polynomial in E, and the pivot is chosen at E0 = 1.5 MeV. Equation (31) explicitly identifies the mean of the posterior for y(E0) with the MAP value a0,MAP = 16.32, and Eq. (33) reduces S*(1.5 MeV) to 10^{a0}. Thus the headline value is a fitted coefficient, not an independent prediction. This is what a parameter-estimation paper reports; it is not circular unless the paper claims to predict a quantity that was used as input, which it does not. The LO/MED/HI band is obtained by propagating the covariance matrix of the same linear model (Eqs. 23, 28), again standard uncertainty propagation, not a separate derived result. The datasets enter only through the likelihood; no low-energy S*(1.5 MeV) value is imposed as a prior or constraint. The self-citations (Refs. [13], [18]) are not load-bearing in a circular way: the Bayesian formalism is standard, and the low-energy conclusion is also anchored by the independent inverse-kinematics data of Ref. [12]. The σ_eff = σ_i/√N weighting and uniform 25% uncertainties are ad hoc modeling choices that affect the width of the quoted interval, and the abstract/body discrepancy (1.20 vs 2.13 ×10^16 keV b) is a serious internal-consistency problem, but these are statistical/reproducibility concerns, not circularity under the specified definitions. The derivation chain does not reduce to its own inputs by construction.
Axiom & Free-Parameter Ledger
free parameters (7)
- a0 (log10 S* at E0=1.5 MeV) =
16.32
- a1 (linear coefficient)
- a2 (quadratic coefficient)
- Uniform fractional uncertainty δ_i=0.25 =
0.25
- Minimum 5% uncertainty for Nan et al. data =
0.05
- Effective uncertainty σ_eff = σ_i/√N
- Pivot energy E0=1.5 MeV =
1.5 MeV
axioms (6)
- domain assumption The experimental data from Refs. [3–10,12,13] are accurate, representative, and their systematic differences are fully captured by the assigned uncertainties.
- ad hoc to paper log10 S*(E) is well approximated by a quadratic polynomial over 1.5–3.5 MeV.
- domain assumption After log transformation, experimental uncertainties are Gaussian and statistically independent.
- domain assumption Flat priors on a0, a1, a2 are sufficient; the Gaussian approximation to the posterior is valid.
- ad hoc to paper The effective uncertainty reduction σ_eff = σ_i/√N is a valid way to combine clustered measurements.
- domain assumption S*(E) = S(E)e^{0.46E} is the appropriate modified S-factor for combining the datasets.
read the original abstract
A Bayesian analysis of the astrophysical \(S\) factor for the \(^{12}{\rm C}+{}^{12}{\rm C}\) fusion reaction is presented using available low-energy information at carbon--carbon relative energies \(E <3.5~{\rm MeV}\), including direct measurements and recent inverse-kinematics data. The goal of the global Bayesian fit is not to reproduce the local resonance-by-resonance structure of the \(^{12}{\rm C}+{}^{12}{\rm C}\) system, but rather to constrain the smooth global component of \(S^{*}(E)\) using the direct and inverse-kinematics constraints. The resulting posterior \(S^{*}(E)\) lies systematically below the traditional FCZ75 reference normalization over the energy interval considered. For example, at \(E=1.5~{\rm MeV}\) the median posterior value is \(S^{*}(1.5~{\rm MeV})=1.20\times10^{16}~{\rm keV\,b}\), whereas the Fowler--Caughlan--Zimmerman reference value is \(S^{*}_{\rm FCZ75}=3.0\times10^{16}~{\rm keV\,b}\) [W.~A. Fowler, G.~R. Caughlan, and B.~A. Zimmerman, Annu. Rev. Astron. Astrophys. \textbf{13}, 69 (1975)]. Thus, the updated posterior favors a lower smooth low-energy trend and does not support a sharp increase of \(S^{*}(E)\) as the energy decreases. The astrophysical consequence of the analysis is assessed through the thermonuclear reaction rate \(N_A\langle\sigma v\rangle\). The resulting median rate is lower than the CF88 analytic rate [G.~R. Caughlan and W.~A. Fowler, At. Data Nucl. Data Tables \textbf{40}, 283 (1988)] over the temperature interval considered, with \(R_{\rm present}/R_{\rm CF88}\simeq0.33\)--\(0.46\) for \(0.3\leq T_9\leq1.2\). At higher temperatures, where the Gamow window extends above the upper end of the adopted integration interval, the calculated rate should be regarded as a truncated rate rather than a complete stellar rate.
Figures
Reference graph
Works this paper leans on
-
[1]
[12] are assigned a uni- form fractional uncertainty δi = 0.25,(1) corresponding to a25%relative uncertainty on S(Ei)
All datasets except for Ref. [12] are assigned a uni- form fractional uncertainty δi = 0.25,(1) corresponding to a25%relative uncertainty on S(Ei). This choice reflects the typical normaliza- tion uncertainties quoted for the majority of direct and indirect measurements and avoids the intro- duction of dataset-specific tuning parameters
-
[2]
[12] are pro- vided in the form of adopted central valuesSad i (Ei) together with an energy-dependentS-factor band defined by lower and upper boundsS lo i (Ei)and Shi i (Ei)
The inverse-kinematics data of Ref. [12] are pro- vided in the form of adopted central valuesSad i (Ei) together with an energy-dependentS-factor band defined by lower and upper boundsS lo i (Ei)and Shi i (Ei). A relative uncertainty is assigned as δi = max Shi i (Ei)−S lo i (Ei) 2S ad i (Ei) ,0.05 ,(2) imposing a minimum5%uncertainty in order to avoid an...
-
[3]
Narrow resonances appear as localized deviations from this background and therefore do not bias the extracted global trend
-
[4]
The quadratic model is applied over arestricted energy interval (1.5–3.5 MeV), within which the smooth envelope oflog10 S∗(E)varies slowly
-
[5]
The polynomial parametrization is not intended as a physical model of the reaction mechanism; it serves as a local regression that approximates the smooth background trend
-
[7]
The inclusion of higher-order polynomial terms does not improve the Bayesian evidence and leads to additional coefficients that are statistically in- significant
-
[8]
Robustness checks confirm that the extracted value ofS(1.5 MeV)is stable under cubic or quartic ex- tensions of the polynomial, with deviations well be- low the quoted credible intervals. III. BAYESIAN FORMALISM A. Bayes’ theorem The statistical inference problem addressed in this work is formulated within a Bayesian framework. Given a set of experimental...
-
[9]
Moriet al., MNRAS Lett.482, L70 (2019) arXiv:1810.01025 (2018)
K. Moriet al., MNRAS Lett.482, L70 (2019) arXiv:1810.01025 (2018)
Pith/arXiv arXiv 2019
-
[10]
Chieffi, S
A. Chieffi, S. Courtin, R. James deBoeret al., Eur. Phys. J. A (In Press) (2025)
2025
-
[11]
M. G. Mazarakis, W. E. Stephens, Phys. Rev. C7, 1280 (1973). (doi.org/10.1103/PhysRevC.7.1280)
-
[12]
H.W. Becker, K.U. Kettner, C. Rolfset al., Z. Phys. A 303, 305 (1981), (doi.org/10.1007/BF01421528)
-
[13]
T. Spillane, F. Raiola, C. Rolfs, Phys. Rev. Lett.98, 122501, (2007) (doi:10.1103/PhysRevLett.98.122501)
-
[14]
Y. Taniguchi, M. Kimura, Phys. Lett. B823, 136790 (2021), (doi.org/10.1016/j.physletb.2021.136790)
arXiv 2021
-
[15]
W. P. Tan, A. Boeltzig, C. Dulalet al., Phys. Rev. Lett. 124, 192702 (2020) (doi:10.1103/PhysRevLett.124)
-
[16]
W. P. Tan, A. Gula, K. Lee, Phys. Rev.C,110, 035808 (2024) (doi:10.1103/PhysRevC.110.035808).192702)
-
[17]
has also found no compelling evidence for a fusion hindrance pattern at low energies, further underscoring the uncertainties associated with extrapolations based on specific hindrance assumptions. The central challenge is therefore to combine these het- erogeneous datasets in a statistically consistent manner, accounting for their different energy coverag...
Pith/arXiv arXiv 2025
-
[18]
G. Fruet, S. Courtin, M. Heineet al., Phys. Rev. Lett.124, 192701 (2020) (doi:10.1103/PhysRevLett.124.192701)
- [19]
-
[20]
A. Tumino ,C. Spitaleri, M.LaCognata,et al., Nature, 557, 687 (2018) (doi:10.1038/s41586-018-0149-4)
-
[21]
W. Nan, Y. Wang, J. Suet al., Phys. Lett. B862, 139341 (2025) (doi: 10.1016/j.physletb.2025.139341)
arXiv 2025
-
[22]
A.M. Mukhamedzhanov, D.Y. Pang, A.S. Kady- rovet al., Phys. Rev. C99, 064618 (2019) (doi.org/10.1103/PhysRevC.99.064618)
-
[23]
Y. Taniguchi, M. Kimura, Phys. Lett. B849, 138434 (2024) (doi.org/10.1016/j.physletb.2023.138434)
arXiv 2024
-
[24]
C. L. Jiang, H. Esbensen, K. E. Rehm,et al.Phys. Rev. Lett.89, 052701 (2002). (doi: 10.1103/Phys- RevLett.89.052701)
doi:10.1103/phys- 2002
-
[25]
K. Uzawa and K. Hagino, Phys. Rev. C112, L061601 (2025). (doi: 10.1103/PhysRevC.112.L061601)
-
[26]
A. M. Mukhamedzhanov Phys Rev C (in Press) (2025); arXiv
2025
-
[27]
J. R. Patterson, H. Winkler, C. S. Zaidins, Astrophys. J. 157, 367 (1969)
1969
-
[28]
G.R. Caughlan, W.A. Fowler, At. Data Nucl. Data Ta- bles40, 283 (1988) (doi: 10.1016/0092-640X(88)90009-5)
-
[29]
Gasques⁄tieacce♪tlowercaseet al., Phys
L.R. Gasques⁄tieacce♪tlowercaseet al., Phys. Rev. C76, 035802 (2007) (doi: 10.1103/PhysRevC.76.035802)
discussion (0)
Sign in with ORCID, Apple, or X to comment. Anyone can read and Pith papers without signing in.