REVIEW 3 major objections 4 minor 72 references
OntoPlot: A Novel Visualisation for Non-hierarchical Associations in Large Ontologies
T0 review · 3 major / 4 minor · reviewed 2026-08-14 · deepseek-v4-flash
Pith's one-line read OntoPlot, a hybrid icicle-plot visualisation, speeds up association exploration in large ontologies while preserving the hierarchy.
desk verdict Solid visualization design study with a real gap to fill, but the evaluation's restriction to low-association classes leaves the headline claim broader than the evidence. read the letter →
The pith
A machine-rendered reading of the paper's core claim, the machinery that carries it, and where it could break.
The reading
What carries the argument
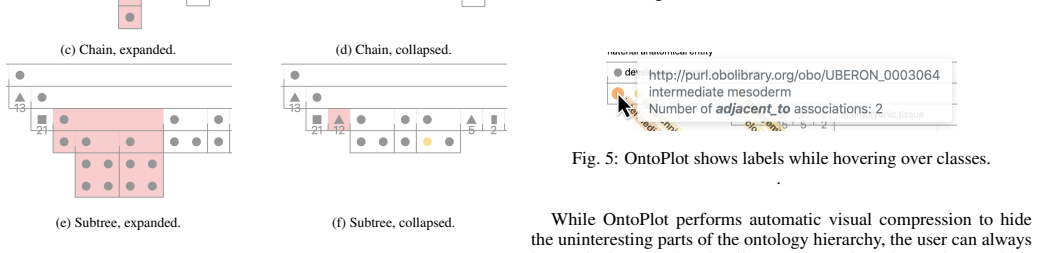
The load-bearing object is the OntoPlot visual encoding itself: an icicle plot in which hierarchy boxes are broken into circle glyphs for individual classes, with leaf nodes wrapped into multi-circle boxes to save width, and irrelevant subtrees replaced by three compression glyphs (square, thin block, triangle) that state how many nodes are hidden. Around this encoding sits a linear-time depth-first traversal that marks classes as interesting or uninteresting for the selected association property and identifies which boxes can be compressed. This is what turns a wide, leaf-heavy ontology into a compact view where association density is visible as colour intensity and association targets are directly labelled, removing the need to count links by hand.
What would settle it
Run a replication of the ten tasks with a new expert cohort on a large ontology where many classes have more than 25 associations and where simple lookups outnumber complex reasoning; if completion-time and accuracy gains over the standard editor disappear or reverse, the claimed general advantage does not hold. A cheaper check: in the existing study data, count how many classes exceed the 25-association cutoff—if most association work concerns such hubs, the evaluation systematically avoided the hard cases.
Extended reading notes
Core claim
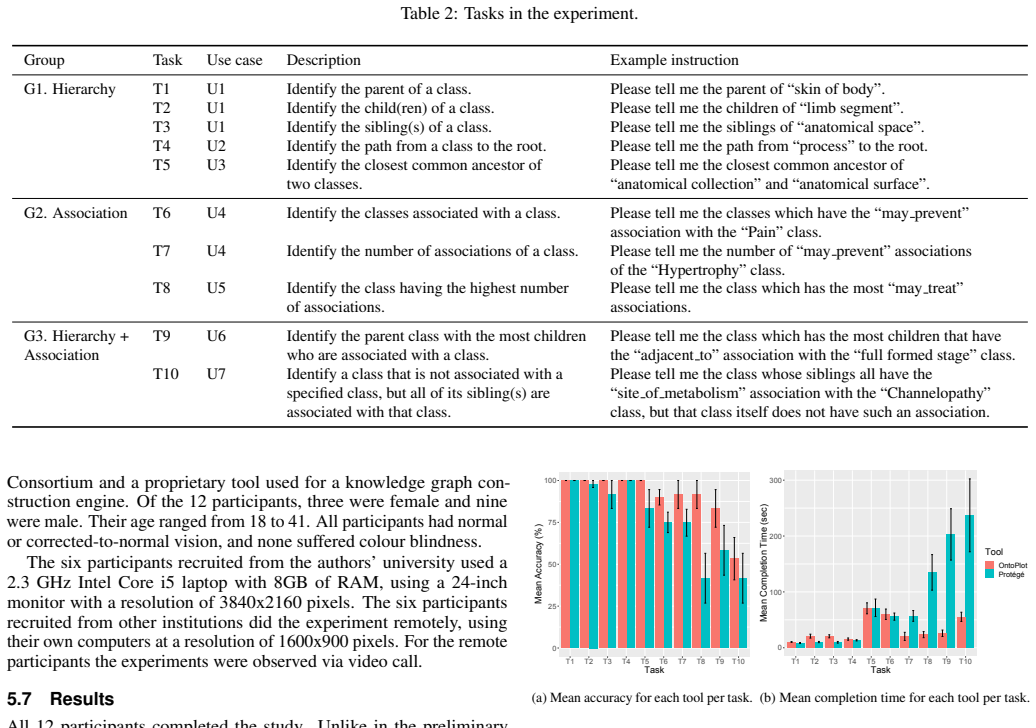
The central claim is that OntoPlot attains its design goals for association-related tasks without sacrificing the hierarchy. Given an ontology and a selected association type (an OWL object property), OntoPlot recolours and labels every class carrying that association, with colour intensity encoding how many associations a class has; it then compresses all subtrees that contain no such classes into three distinct glyphs—a square for collapsed leaf groups, a thin block for uninteresting chains, and a triangle for larger uninteresting subtrees—each labelled with the hidden node count. Users can expand or collapse any subtree, filter, search, and switch to a focus mode that shows only the associations of one selected class. The expert study compared this against the standard indented-list editor using ten tasks in three groups: hierarchy comprehension, association identification, and combined hierarchy-plus-association reasoning. OntoPlot matched the baseline on accuracy for hierarchy tasks and significantly beat it on completion time for the most complex association tasks, with all twelve participants preferring OntoPlot for association-related work.
Load-bearing premise
The central conclusion assumes the ten study tasks are a fair sample of real association work, and that the tested classes, each with fewer than 25 associations, represent the cases users actually encounter.
Editorial extensions
If this is right
- For large biomedical ontologies, questions like which parent has the most children associated with a class and which sibling lacks an expected association can be answered in seconds instead of by manual cross-referencing.
- Ontology authors and analysts can inspect class effects—where every child of a class shares a drug or adverse-event association—directly from the visualisation rather than from separate text panes.
- The compression scheme keeps the full hierarchy readable at scale, so association exploration no longer requires sacrificing overview.
- The same interaction design transfers to any hierarchy with cross-links, such as research-collaboration networks or agronomic data, since OntoPlot is domain agnostic.
- The tool that experts prefer for association tasks now shows both structure and links, which may shift how ontology analysis is presented and published.
Reading between the lines
- If the advantage holds beyond classes with more than 25 associations, the compression and colour-intensity design may also work for hub-heavy ontologies; the paper deliberately limited test questions to classes with fewer than 25 associations to keep sessions short.
- The task mix weights complex reasoning tasks heavily, so a field study with a more representative distribution of simple lookups versus complex reasoning might shift the measured advantage, since the baseline editor was faster on two simple hierarchy tasks.
- A natural extension is rendering multiple association types simultaneously, for instance by glyph shape or layered colour, allowing users to compare connectivity across properties without switching; the paper only selected one property at a time.
- The speed gain likely comes less from perception alone and more from eliminating cross-pane switching: in the baseline editor, users cannot select a class and an association type at the same time, so the comparison privileges integrated views.
Editorial analysis
A structured set of objections, weighed in public.
Referee Report
Summary. The manuscript presents OntoPlot, a hybrid icicle-plot and glyph-based visualisation designed to show non-hierarchical associations alongside the hierarchical structure of large ontologies. The authors derive seven use cases U1-U7 from biomedical ontology analysis, translate them into design requirements R1-R6, and describe OntoPlot's visual encodings (colour intensity scaled by association count, compression glyphs for uninteresting subtrees, focus mode, and interactive expansion/collapse). They report an expert user study with 12 domain experts comparing OntoPlot with Protégé on ten tasks in three groups: hierarchy (G1), association (G2), and combined hierarchy-plus-association (G3). The results show that Protégé was significantly faster for two G1 tasks, while OntoPlot was significantly faster for association tasks T7-T10, significantly more accurate for T8, and preferred by all participants for G2 and G3. The authors conclude that OntoPlot attains its design goals and significantly outperforms Protégé on efficiency for complex association-based tasks.
Significance. If the empirical claims hold, the paper is a useful contribution to ontology visualisation: it addresses the under-explored problem of non-hierarchical association exploration, provides a working implementation with a public URL, and evaluates against an external de facto baseline. The strengths include an explicit task taxonomy, a counterbalanced within-subjects design, domain-expert participants, and transparent reporting of the earlier prototype study's limitations. The main risk is external validity: the study restricts task stimuli to classes with fewer than 25 associations, so the high-association regime that motivated the design is untested, and some of the statistical claims rest on uncorrected multiple comparisons. These issues are reparable by re-scoping the conclusions and reporting additional detail, rather than by fundamental reworking of the system.
major comments (3)
- [§5.4, Table 2, §3.3] The restriction in §5.4 to 'classes with less than 25 associations' is load-bearing for the association-task claims. Task T8 is presented as operationalising U5 ('detect significant associations... greatest strength'), but if any class in OCVDAE has more than 25 associations for the tested properties, then the task as administered asks for the maximum only within a truncated set and is not the designed task. Moreover, because §3.3 states that the colour key is dynamic depending on the maximum number of associations applying to any one class, a large ontology-wide maximum would place all classes with fewer than 25 associations in the lowest colour bins; the study therefore evaluates the colour-intensity encoding in its least discriminative range. The paper never reports the per-property association-count distribution, and the §6 conclusion that OntoPlot 'significantly outperformed Protégé on efficiency for the complex association-based tasks' is stated without this qualifier. The high-association regime, where Protégé's textual lists become longest and OntoPlot's compression glyphs and count labels should matter most, remains untested.
- [§5.7, Table 4] The statistical analysis performs many significance tests on a sample of 12 participants without correction for multiple comparisons and without effect sizes or confidence intervals. Table 4 reports dozens of comparisons; a single p < 0.05 for T8 accuracy is consistent with what multiple testing can produce by chance. The time effects for T9 and T10 (p < 0.01 and p < 0.001) are more robust, but the paper should state the total number of comparisons made, report effect sizes for the headline claims, and soften any language that treats every starred cell in Table 4 as equally strong evidence.
- [§5.7] Completion time was analysed only for answers with accuracy greater than 0%, using a Mann-Whitney test on unequal samples. This makes the efficiency comparison conditional on correctness and can bias the time estimates: if one tool produced more incorrect responses, the corresponding slow or fast trials are excluded in a way that may systematically inflate the remaining tool's speed advantage. The authors should report how many trials per task and tool were excluded, and consider an analysis that models accuracy and time jointly or reports an efficiency measure that counts incorrect attempts.
minor comments (4)
- [§5.7] The text refers to the 'Whitney-Mann test'; the correct name is the Mann-Whitney U test.
- [§4] The paper references supplementary materials for the prototype study but does not state where they can be obtained; an artifact/data availability statement would help readers assess the earlier results.
- [§3.3] The description of the dynamic colour key says 'Nodes with the minimum and maximum number of associations are clearly coloured', but it does not specify how many discrete bins are used or how interpolation handles ties; a short explanation or a legend figure would improve reproducibility.
- [Abstract] The abstract states that 'the results confirm that OntoPlot attains our design goals for association-related tasks', but the study shows mixed results for hierarchy tasks and an untested high-association regime; the wording should be qualified in the abstract as well as in the conclusion.
Circularity Check
No circularity: the central claim is an empirical user-study comparison against an external baseline, not a derivation from fitted inputs or self-citations.
full rationale
The paper's central claim is that OntoPlot significantly outperforms Protégé on efficiency for complex association-based tasks (Section 6). This conclusion rests on a controlled user study with 12 domain experts (Section 5.5) that measured accuracy, completion time, and participant ratings for ten tasks, with statistical tests (Wilcoxon and Whitney-Mann) reported in Section 5.7. The comparison baseline, Protégé, is an external tool, and the tasks were derived from stated use cases (Table 1) rather than from OntoPlot's own output. The self-references, such as the earlier landmark-compression work by Jiao et al. [35] and the ontology-based neuropathy analysis by Guo et al. [25], appear as related work and motivation, not as load-bearing justification for the evaluation results. The restriction in Section 5.4 to classes with fewer than 25 associations is a potential generalizability limitation, but it does not make the measured outcome equivalent to an input or fit; it concerns external validity, not circularity. No fitted parameter has been relabeled as a prediction, and no uniqueness theorem or definitional equivalence is invoked to force the result. The derivation chain is therefore self-contained as an empirical evaluation, so no circular step is present.
Assumptions & free parameters
assumptions (3)
- domain assumption The ontology hierarchy can be represented as a tree for the icicle plot layout, with multiple inheritance handled by duplication or ignored.
- domain assumption The ten tasks in Table 2 are valid operationalizations of the seven use cases U1-U7 identified for biomedical ontology analysis.
- domain assumption The compression glyphs (square, thin block, triangle) are quickly understood by users without extensive training.
Cite this review
Pith. "Pith review of OntoPlot: A Novel Visualisation for Non-hierarchical Associations in Large Ontologies." pith.science (2026). https://pith.science/paper/VKJIJGBR
@misc{pith2026190800688,
  author       = {Pith},
  title        = {Pith review of: OntoPlot: A Novel Visualisation for Non-hierarchical Associations in Large Ontologies},
  year         = {2026},
  howpublished = {\url{https://pith.science/paper/VKJIJGBR}},
  note         = {Machine review of arXiv:1908.00688}
}
read the original abstract
Ontologies are formal representations of concepts and complex relationships among them. They have been widely used to capture comprehensive domain knowledge in areas such as biology and medicine, where large and complex ontologies can contain hundreds of thousands of concepts. Especially due to the large size of ontologies, visualisation is useful for authoring, exploring and understanding their underlying data. Existing ontology visualisation tools generally focus on the hierarchical structure, giving much less emphasis to non-hierarchical associations. In this paper we present OntoPlot, a novel visualisation specifically designed to facilitate the exploration of all concept associations whilst still showing an ontology's large hierarchical structure. This hybrid visualisation combines icicle plots, visual compression techniques and interactivity, improving space-efficiency and reducing visual structural complexity. We conducted a user study with domain experts to evaluate the usability of OntoPlot, comparing it with the de facto ontology editor Prot{\'e}g{\'e}. The results confirm that OntoPlot attains our design goals for association-related tasks and is strongly favoured by domain experts.
Figures


Figures from the paper (6 more)



Reference graph
Works this paper leans on
-
[1]
D. Adam. The counting house. Nature, 415(6873):726–729, Feb. 2002. doi: 10.1038/415726a
-
[2]
E. Antezana, M. Kuiper, and V . Mironov. Biological knowledge manage- ment: the emerging role of the Semantic Web technologies. Briefings in Bioinformatics, 10(4):392–407, 2009
work page 2009
-
[3]
G. Antoniou, P. Groth, F. v. v. Harmelen, and R. Hoekstra. A Semantic Web Primer. The MIT Press, 3rd ed., 2012
work page 2012
-
[4]
M. Ashburner, C. A. Ball, J. A. Blake, D. Botstein, H. Butler, J. M. Cherry, A. P. Davis, K. Dolinski, S. S. Dwight, J. T. Eppig, et al. Gene Ontology: tool for the unification of biology. Nature Genetics, 25(1):25–29, 2000
work page 2000
-
[5]
F. Baader and W. Nutt. Basic description logics. In F. Baader, D. Cal- vanese, D. L. McGuinness, D. Nardi, and P. F. Patel-Schneider, eds.,The Description Logic Handbook: Theory, Implementation, and Applications, pp. 43–95. Cambridge University Press, 2003
work page 2003
- [6]
-
[7]
L. Beaudoin, M.-A. Parent, and L. C. Vroomen. Cheops: A Compact Explorer for Complex Hierarchies. In Proceedings of the 7th Conference on Visualization ’96, VIS ’96, pp. 87–92, 1996
work page 1996
- [8]
Show all 72 references
-
[9]
Borgo, J
R. Borgo, J. Kehrer, D. H. S. Chung, E. Maguire, R. S. Laramee, H. Hauser, M. Ward, and M. Chen. Glyph-based Visualization: Foundations, Design Guidelines, Techniques and Applications. In Eurographics 2013 - State of the Art Reports, pp. 39–63. Eurographics Association, 2013
2013
-
[10]
S. H. Brown, P. L. Elkin, S. T. Rosenbloom, C. S. Husser, B. A. Bauer, M. J. Lincoln, J. S. Carter, M. Erlbaum, and M. S. Tuttle. V A National Drug File Reference Terminology: a cross-institutional content coverage study. Medinfo, 11(Pt 1):477–481, 2004
2004
-
[11]
Burger, D
A. Burger, D. Davidson, Y . Yang, and R. Baldock. Integrating partonomic hierarchies in anatomy ontologies. BMC Bioinformatics, 5(1):184, 2004
2004
-
[12]
Carpendale, M
S. Carpendale, M. Chen, D. Evanko, N. Gehlenborg, C. G¨org, L. Hunter, F. Rowland, M.-A. Storey, and H. Strobelt. Ontologies in Biological Data Visualization. IEEE Computer Graphics and Applications, 34(2):8–15, 2014
2014
-
[13]
Cuenca-Grau, I
B. Cuenca-Grau, I. Horrocks, B. Motik, B. Parsia, P. Patel-Schneider, and U. Sattler. OWL 2: The next step for OWL. Journal of Web Semantics: Science, Services and Agents on the World Wide Web, 6(4):309–322, 2008
2008
-
[14]
I. C. S. da Silva, C. M. D. S. Freitas, and G. Santucci. An Integrated Approach for Evaluating the Visualization of Intensional and Extensional Levels of Ontologies. In Proceedings of the 2012 BELIV Workshop: Beyond Time and Errors-Novel Evaluation Methods for Visualization, p...
2012
-
[15]
d’Aquin and N
M. d’Aquin and N. F. Noy. Where to publish and find ontologies? A survey of ontology libraries. Journal of Web Semantics, 11:96–111, 2012
2012
-
[16]
Drury, R
B. Drury, R. Fernandes, M.-F. Moura, et al. A survey of semantic web technology for agriculture. Information Processing in Agriculture, 2019
2019
-
[17]
Dud´aˇs, S
M. Dud´aˇs, S. Lohmann, V . Sv´atek, and D. Pavlov. Ontology visualization methods and tools: a survey of the state of the art. The Knowledge Engineering Review, 33:e10.1–39, 2018
2018
-
[18]
Dunne and B
C. Dunne and B. Shneiderman. Motif Simplification: Improving Network Visualization Readability with Fan, Connector, and Clique Glyphs. In Proceedings of the SIGCHI Conference on Human Factors in Computing Systems, pp. 3247–3256. ACM, 2013
2013
-
[19]
A. J. Enright, B. John, U. Gaul, T. Tuschl, C. Sander, and D. S. Marks. MicroRNA targets in Drosophila. Genome Biology, 5(1):R1, 2003
2003
-
[20]
Field, J
A. Field, J. Miles, and Z. Field. Discovering Statistics Using R. SAGE Publications, 2012
2012
-
[21]
Fraser, N
J. Fraser, N. Adams, A. Macintosh, A. McKay-Hubbard, T. P. Lobo, P. F. Pardo, R. C. Mart ´ınez, and J. S. Vallecillo. Knowledge Management Applied to E-Government Services: The Use of an Ontology. In IFIP In- ternational Working Conference on Knowledge Management in Electronic...
2003
-
[22]
The Gene Ontology in 2010: extensions and refinements
Gene Ontology Consortium. The Gene Ontology in 2010: extensions and refinements. Nucleic Acids Research, 38(suppl 1):D331–D335, 2009
2010
-
[23]
Gene Ontology Consortium: going forward
Gene Ontology Consortium. Gene Ontology Consortium: going forward. Nucleic Acids Research, 43(D1):D1049–D1056, 2015
2015
-
[24]
Graham and J
M. Graham and J. Kennedy. Visual exploration of alternative taxonomies through concepts. Ecological Informatics, 2(3):248–261, 2007
2007
-
[25]
A. Guo, R. Racz, J. Hur, Y . Lin, Z. Xiang, L. Zhao, J. Rinder, G. Jiang, Q. Zhu, and Y . He. Ontology-based collection, representation and analysis of drug-associated neuropathy adverse events. Journal of Biomedical Semantics, 7(1):29, 2016
2016
-
[26]
Hanna, E
J. Hanna, E. Joseph, M. Brochhausen, and W. R. Hogan. Building a drug ontology based on RxNorm and other sources. Journal of Biomedical Semantics, 4(1):44, 2013
2013
-
[27]
Hastings, P
J. Hastings, P. de Matos, A. Dekker, M. Ennis, B. Harsha, N. Kale, V . Muthukrishnan, G. Owen, S. Turner, M. Williams, et al. The ChEBI reference database and ontology for biologically relevant chemistry: en- hancements for 2013. Nucleic Acids Research, 41(D1):D456–D463, 2012
2013
-
[28]
T. F. Hayamizu, R. A. Baldock, and M. Ringwald. Mouse anatomy on- tologies: enhancements and tools for exploring and integrating biomedical data. In Mammalian Genome, 2015
2015
-
[29]
Y . He, S. Sarntivijai, Y . Lin, Z. Xiang, A. Guo, S. Zhang, D. Jagannathan, L. Toldo, C. Tao, and B. Smith. OAE: The Ontology of Adverse Events. Journal of Biomedical Semantics, 5(1):29, 2014
2014
-
[30]
Heer and S
J. Heer and S. K. Card. DOITrees revisited: Scalable, space-constrained visualization of hierarchical data. In Proceedings of the Working Confer- ence on Advanced Visual Interfaces, A VI ’04, pp. 421–424. ACM, New York, NY , USA, 2004
2004
-
[31]
Horridge
M. Horridge. OWLViz. protegewiki.stanford.edu/wiki/OWLViz, github.com/protegeproject/owlviz, 2005. Accessed June 2019
2005
-
[32]
Horrocks, P
I. Horrocks, P. F. Patel-Schneider, and F. van Harmelen. From SHIQ and RDF to OWL: The Making of a Web Ontology Language. Journal of Web Semantics, 1(1):7–26, 2003
2003
-
[33]
J. Hur, A. ¨Ozg¨ur, and Y . He. Ontology-based literature mining and class effect analysis of adverse drug reactions associated with neuropathy- inducing drugs. Journal of Biomedical Semantics, 9(1):17, 2018
2018
-
[34]
S. V . Iyer, R. Harpaz, P. LePendu, A. Bauer-Mehren, and N. H. Shah. Mining clinical text for signals of adverse drug-drug interactions. Journal of the American Medical Informatics Association, 21(2):353–362, 2013
2013
-
[35]
Z. L. Jiao, Q. Liu, Y .-F. Li, K. Marriott, M. Wybrow, et al. Visualization of large ontologies with landmarks. In GRAPP/IVAPP, pp. 461–470, 2013
2013
-
[36]
Jonquet, A
C. Jonquet, A. Toulet, E. Arnaud, S. Aubin, E. D. Yeumo, V . Emonet, J. Graybeal, M.-A. Laporte, M. A. Musen, V . Pesce, et al. AgroPortal: A vocabulary and ontology repository for agronomy. Computers and Electronics in Agriculture, 144:126–143, 2018
2018
-
[37]
A. Jurcık. Knoocks - Ontology Visualization Plug-in for Prot ´eg´e. In Proceeding of CESCG 2012: The 16th Central European Seminar on Computer Graphics, 2012
2012
-
[38]
Katifori, C
A. Katifori, C. Halatsis, G. Lepouras, C. Vassilakis, and E. Giannopoulou. Ontology Visualization Methods – A Survey. ACM Computing Surveys (CSUR), 39(4), 2007
2007
-
[39]
J. B. Kruskal and J. M. Landwehr. Icicle Plots: Better Displays for Hierarchical Clustering. The American Statistician, 37(2):162–168, 1983
1983
-
[40]
Kuhar and V
S. Kuhar and V . Podgorelec. Ontology Visualization for Domain Experts: a New Solution. In 2012 16th International Conference on Information Visualisation, pp. 363–369. IEEE, 2012
2012
-
[41]
M. Kuhn, M. Campillos, I. Letunic, L. J. Jensen, and P. Bork. A side effect resource to capture phenotypic effects of drugs. Molecular Systems Biology, 6(1):343, 2010
2010
-
[42]
Lin and Y
Y . Lin and Y . He. Ontology representation and analysis of vaccine formu- lation and administration and their effects on vaccine immune responses. Journal of Biomedical Semantics, 3(1):17, 2012
2012
-
[43]
B. Liu, J. Li, and M. J. Cairns. Identifying miRNAs, targets and functions. Briefings in Bioinformatics, 15(1):1–19, 2012
2012
-
[44]
Lohmann, V
S. Lohmann, V . Link, E. Marbach, and S. Negru. WebVOWL: Web-based visualization of ontologies. In International Conference on Knowledge Engineering and Knowledge Management, pp. 154–158. Springer, 2014
2014
-
[45]
C. M. Machado, D. Rebholz-Schuhmann, A. T. Freitas, and F. M. Couto. The semantic web in translational medicine: current applications and future directions. Briefings in Bioinformatics, pp. 89–103, 2013
2013
-
[46]
H. F. Moed. Citation Analysis in Research Evaluation, vol. 9. Springer Science & Business Media, 2006
2006
-
[47]
C. J. Mungall, C. Torniai, G. V . Gkoutos, S. E. Lewis, and M. A. Haendel. Uberon, an integrative multi-species anatomy ontology. Genome Biology, 13(1):R5, 2012
2012
-
[48]
Munzner, F
T. Munzner, F. Guimbreti`ere, S. Tasiran, L. Zhang, and Y . Zhou. TreeJux- taposer: Scalable Tree Comparison using Focus+ Context with Guaranteed Visibility. ACM Transactions on Graphics (TOG), 22(3):453–462, 2003
2003
-
[49]
S. Nam, B. Kim, S. Shin, and S. Lee. miRGator: an integrated sys- tem for functional annotation of microRNAs. Nucleic Acids Research, 36(suppl 1):D159–D164, 2007. 10 © 2019 IEEE. This is the author’s version of the article that has been published in IEEE Transactions on Visual...
2007
-
[50]
Niroumand, M
H. Niroumand, M. F. M. Zain, and M. Jamil. Statistical Methods for Com- parison of Data Sets of Construction Methods and Building Evaluation. Procedia-Social and Behavioral Sciences, 89:218–221, 2013
2013
-
[51]
Nobre, N
C. Nobre, N. Gehlenborg, H. Coon, and A. Lex. Lineage: Visualizing Multivariate Clinical Data in Genealogy Graphs. IEEE Transactions on Visualization and Computer Graphics, 2018
2018
-
[52]
N. Noy, R. Fergerson, and M. Musen. The Knowledge Model of Prot´eg´e- 2000: Combining Interoperability and Flexibility. In Knowledge Engineer- ing and Knowledge Management Methods, Models, and Tools, pp. 17–32. Springer, Berlin, Heidelberg, 2000
2000
-
[53]
N. F. Noy, N. H. Shah, P. L. Whetzel, B. Dai, M. Dorf, N. Griffith, C. Jonquet, D. L. Rubin, M.-A. Storey, C. G. Chute, et al. BioPortal: ontologies and integrated data resources at the click of a mouse. Nucleic Acids Research, 37(suppl 2):W170–W173, 2009
2009
-
[54]
Peroni and D
S. Peroni and D. Shotton. The SPAR Ontologies. InInternational Semantic Web Conference, pp. 119–136. Springer, 2018
2018
-
[55]
A. Saghafi. Visualizing Ontologies - A Literature Survey. In International Conference on Conceptual Structures, pp. 204–221. Springer, 2016
2016
-
[56]
Salvadores, P
M. Salvadores, P. R. Alexander, M. A. Musen, and N. F. Noy. BioPortal as a Dataset of Linked Biomedical Ontologies and Terminologies in RDF. Semantic Web, 4(3):277–284, 2013
2013
-
[57]
Sarntivijai, S
S. Sarntivijai, S. Zhang, D. G. Jagannathan, S. Zaman, K. K. Burkhart, G. S. Omenn, Y . He, B. D. Athey, and D. R. Abernethy. Linking MedDRA®- coded clinical phenotypes to biological mechanisms by the Ontology of adverse events: a pilot study on tyrosine kinase inhibitors. Dru...
2016
-
[58]
Schulz, S
H.-J. Schulz, S. Hadlak, and H. Schumann. The Design Space of Implicit Hierarchy Visualization: A Survey. IEEE Transactions on Visualization and Computer Graphics, 17(4):393–411, 2011
2011
-
[59]
Shah and M
N. Shah and M. Musen. Ontologies for Formal Representation of Bi- ological Systems. In Handbook on Ontologies, pp. 445–461. Springer, 2009
2009
-
[60]
L. Shi, Q. Liac, X. Sun, Y . Chen, and C. Lin. Scalable network traf- fic visualization using compressed graphs. In 2013 IEEE International Conference on Big Data, pp. 606–612, 2013
2013
-
[61]
Smith, W
B. Smith, W. Ceusters, B. Klagges, J. K ¨ohler, A. Kumar, J. Lomax, C. Mungall, F. Neuhaus, A. L. Rector, and C. Rosse. Relations in biomed- ical ontologies. Genome Biology, 6(5):R46, 2005
2005
-
[62]
Sprague, L
J. Sprague, L. Bayraktaroglu, D. Clements, T. Conlin, D. Fashena, K. Frazer, M. Haendel, D. G. Howe, P. Mani, S. Ramachandran, et al. The Zebrafish Information Network: the zebrafish model organism database. Nucleic Acids Research, 34(suppl 1):D581–D585, 2006
2006
-
[63]
M. Q. Stearns, C. Price, K. A. Spackman, and A. Y . Wang. SNOMED clinical terms: overview of the development process and project status. In Proceedings of the AMIA Symposium, p. 662. American Medical Informat- ics Association, 2001
2001
-
[64]
Stevens and P
R. Stevens and P. Lord. Application of Ontologies in Bioinformatics. In Handbook on Ontologies, pp. 735–756. Springer, 2009
2009
-
[65]
Storey, M
M.-A. Storey, M. Musen, J. Silva, C. Best, N. Ernst, R. Fergerson, and N. Noy. Jambalaya: Interactive visualization to enhance ontology author- ing and knowledge acquisition in Prot ´eg´e. In Workshop on Interactive Tools for Knowledge Capture, vol. 73, 2001
2001
-
[66]
Wagner, K
C. Wagner, K. S. Cheung, R. K. Ip, and S. Bottcher. Building Semantic Webs for e-government with Wiki technology. Electronic Government, 3(1):36–55, 2006
2006
-
[67]
L. Wang, M. Li, J. Xie, Y . Cao, H. Liu, and Y . He. Ontology-based systematical representation and drug class effect analysis of package insert- reported adverse events associated with cardiovascular drugs used in China. Scientific Reports, 7(1), 2017
2017
-
[68]
M. O. Ward. A Taxonomy of Glyph Placement Strategies for Multidi- mensional Data Visualization. Information Visualization, 1(3–4):194–210, 2002
2002
-
[69]
Winnenburg, A
R. Winnenburg, A. Sorbello, and O. Bodenreider. Exploring adverse drug events at the class level. Journal of Biomedical Semantics, 6(1):18, 2015
2015
-
[70]
Yoghourdjian, T
V . Yoghourdjian, T. Dwyer, K. Klein, K. Marriott, and M. Wybrow. Graph Thumbnails: Identifying and Comparing Multiple Graphs at a Glance. IEEE Transactions on Visualization and Computer Graphics, 24(12):3081– 3095, 2018
2018
-
[71]
Yoon and G
S. Yoon and G. De Micheli. Prediction of regulatory modules comprising microRNAs and target genes. Bioinformatics, 21(suppl 2):ii93–ii100, 2005
2005
-
[72]
Zaman, S
S. Zaman, S. Sarntivijai, and D. R. Abernethy. Use of Biomedical On- tologies for Integration of Biological Knowledge for Learning and Predic- tion of Adverse Drug Reactions. Gene Regulation and Systems Biology, 11:1177625017696075, 2017. 11
2017
Reviewed August 14, 2026 · model on record in the stance chip above.
Discussion (0). Continue with ORCID to comment.