REVIEW 3 major objections 5 minor 17 references
Design and Validation of the Digital Receiver System for the next-generation radio interferometer
T0 review · 3 major / 5 minor · reviewed 2026-08-07 · deepseek-v4-flash
Pith's one-line read A field-validated 8-channel digital receiver achieves sub-nanosecond delay calibration for the BINGO-ABDUS interferometer.
desk verdict Solid engineering validation with real field data; the independent geometric-vs-GPR delay agreement carries the paper, but the sub-ns claim needs error bars or a delay-injection test before I'd fully trust it. read the letter →
The pith
A machine-rendered reading of the paper's core claim, the machinery that carries it, and where it could break.
The reading
What carries the argument
The load-bearing object is the unwrapped cross-correlation phase $\phi_{ij}(f)=\arg\langle X_i(f)X_j^*(f)\rangle$, whose slope in frequency is the inter-antenna delay via $\tau_{ij}=-(1/2\pi)\,d\phi_{ij}/df$. The slope is extracted by Gaussian process regression with kernel $k(f,f')=C\cdot\mathrm{RBF}(\ell=10\,\mathrm{MHz})+\mathrm{WhiteKernel}(\sigma^2=0.1)$, applied to amplitude-selected, RFI-masked frequency points. The fitted slope supplies the 'actual' delay used for compensation, which is implemented as an integer circular shift plus linear fractional-sample interpolation. The geometric delay $\tau_{ij}=b_{ij}\cos\theta_{ij}/c$ computed from surveyed baseline geometry is the independent reference against which the GPR delays are validated.
What would settle it
After unwrapping, compute the residuals of the GPR fit across frequency; if they show systematic curvature rather than scatter around zero, the linear-slope delay estimate is biased. A direct experimental check is to insert a calibrated delay line (say 5 ns) into one antenna path and confirm that the GPR delay shifts by that amount; a miss larger than the claimed sub-nanosecond accuracy would pin the failure on the phase-linearity or kernel assumption.
Extended reading notes
Core claim
On its own terms, the paper establishes that the DH1 receiver digitizes, channelizes, and correlates signals well enough that the time delays between antennas can be recovered from the cross-correlation phase to sub-nanosecond accuracy. For the three Tianlai baselines used against Cassiopeia A, the GPR-fitted delays are $2.269\times 10^{-8}$ s, $1.977\times 10^{-8}$ s, and $1.317\times 10^{-8}$ s, against geometric values of $2.251\times 10^{-8}$ s, $2.010\times 10^{-8}$ s, and $1.323\times 10^{-8}$ s, a match within 5%. After applying the two-stage compensation, the formerly sloped fringe phases flatten and the cross-power spectra rise, which the authors read as simultaneous validation of the analog chain, the ADC/PFB digitization path, and the VDIF data transport. The result is presented as evidence that the receiver meets the backend requirements of BINGO-ABDUS, including its phased-array outrigger stations.
Load-bearing premise
The GPR-fitted delay is assumed to be unbiased, meaning the unwrapped cross-correlation phase really is a straight line in frequency once the low-amplitude points and RFI-affected bands are removed; if the kernel or the point-selection hides curvature, both the 'actual' delays and the compensation derived from them would shift in the same direction, and the sub-nanosecond agreement would no longer validate the receiver.
Editorial extensions
If this is right
- The DH1 receiver can be adopted as the digital backend for the BINGO-ABDUS interferometer, including its phased-array and outrigger stations, without a re-design of the sampling and channelization chain.
- Delay calibration at sub-nanosecond accuracy, using GPR phase-slope fitting with RFI masking, is achievable on 128-MHz sub-bands with the field hardware described.
- The two-stage integer-plus-fractional compensation restores fringe coherence in the observed baselines, which is a prerequisite for beamforming and for arcsecond-scale transient localization.
- The architecture's combination of 8 inputs, 4 GHz sampling, and 100 Gbps VDIF output is scalable to the larger-N arrays planned for BINGO-ABDUS.
Reading between the lines
- The same GPR calibration pipeline could serve as a general-purpose delay estimator for other small interferometers, since it does not depend on BINGO-ABDUS-specific hardware beyond the receiver itself.
- A stronger test than the paper reports would be injecting a known delay into one channel and recovering it with GPR; that would separate estimator bias from antenna-survey errors, which the 5% agreement currently conflates.
- If the phase-frequency linearity assumption holds at wider bandwidths, extending the method across the full 128-MHz sub-band or multiple sub-bands should preserve sub-nanosecond accuracy, and residual curvature in the GPR fit would be the first sign it does not.
- The authors present three baselines; validating on more baselines and at different elevations would show whether the residual 5% differences are dominated by geometric survey error or by systematic phase errors in the receiver.
Editorial analysis
A structured set of objections, weighed in public.
Referee Report
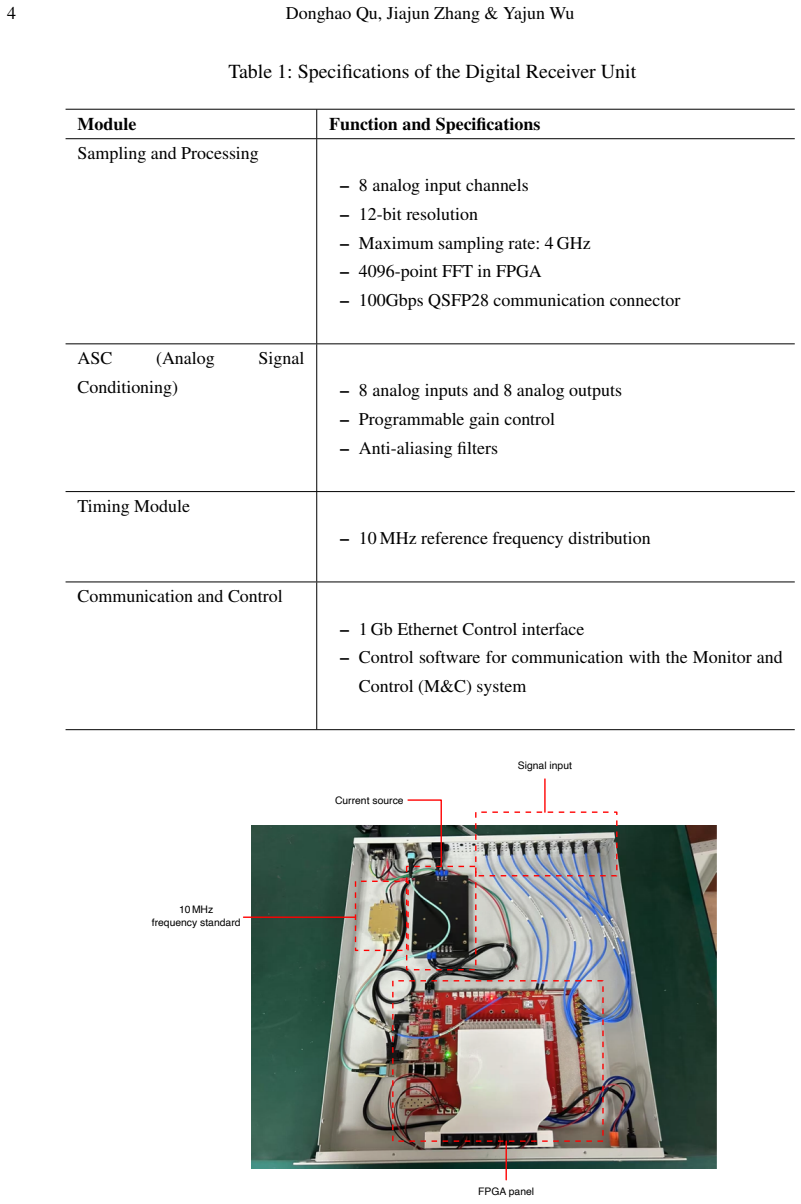
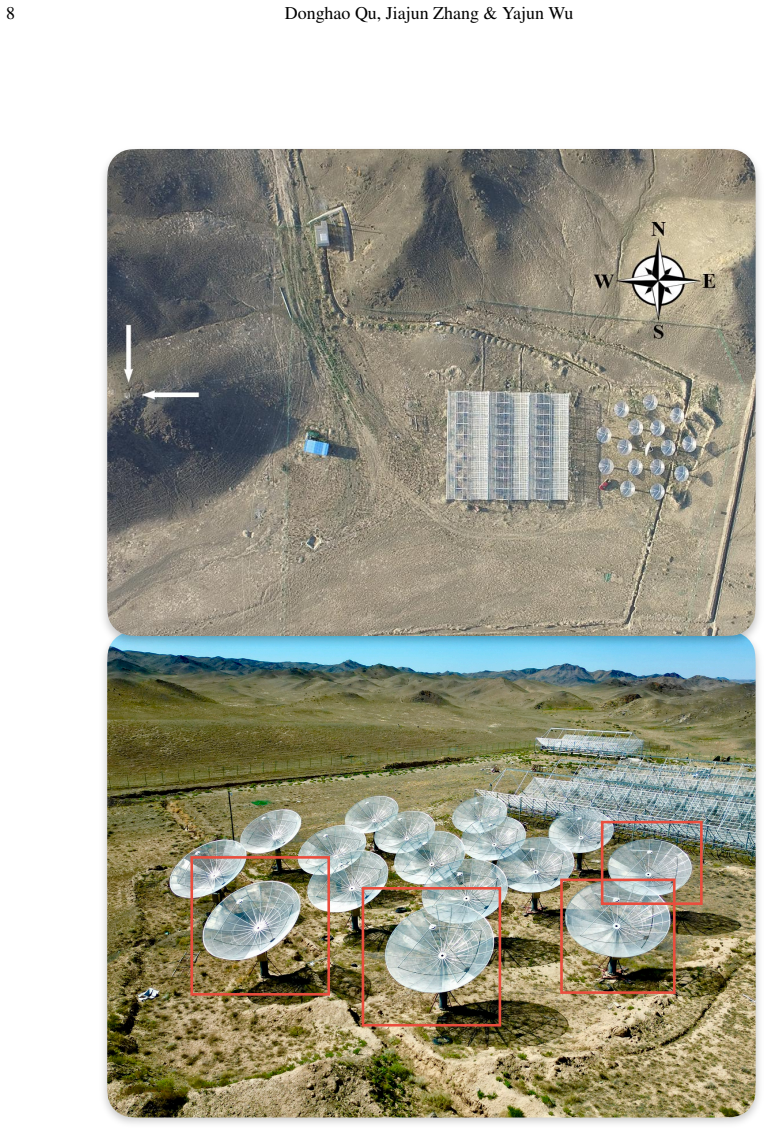
Summary. The manuscript describes DH1, an FPGA-based eight-channel digital receiver developed for the BINGO-ABDUS interferometric platform. The receiver digitizes at up to 4 GHz with 12-bit ADCs, performs polyphase filter bank channelization, and outputs VDIF frames over 100 Gbps Ethernet. Field observations were made with the Xi'an 13 m and 16 m antennas (satellite beacon, Sun) and with four Tianlai dishes (Cassiopeia A). The paper reports detection of interference fringes, estimation of relative time delays by a geometric model and by Gaussian Process Regression (GPR) fits to cross-correlation phase slopes, and two-stage integer plus fractional delay compensation. The central claim is that the geometric and GPR delays agree to sub-nanosecond accuracy, with residuals of 0.18, -0.33, and -0.06 ns across three baselines, validating the receiver for BINGO-ABDUS.
Significance. If the delay-calibration result is robust, DH1 is a useful hardware contribution for the upcoming BINGO-ABDUS phased-array and outrigger systems. The paper's strengths are that it presents a working instrument with real on-sky fringes, uses an independent geometric cross-check that is not circular, and describes a concrete signal-processing pipeline. The main weakness is that the GPR-based delay estimator is not characterized in terms of bias or variance, and the geometric comparison lacks an uncertainty budget; consequently the sub-nanosecond claim is plausible but not yet established. The validation also rests on a small number of baselines, though that is acceptable for a first hardware test.
major comments (3)
- [§4.2.2, Eq. (8)] The GPR delay estimate is presented as the 'actual' delay, but the estimator's bias and variance are never characterized. Steps 4 and 5 of the pipeline select frequency points by an amplitude percentile and exclude RFI bands; these data-dependent selections can bias the fitted phase slope if the surviving phase-frequency relation is nonlinear or the frequency samples are unevenly distributed. No sensitivity analysis is given for the kernel hyperparameters (C, l = 10 MHz, σ² = 0.1), and no error bars are quoted for the delays in Table 3. Since the residuals 0.18, -0.33, and -0.06 ns could easily lie within the estimator's scatter, the 'sub-nanosecond consistency' claim requires either a delay-injection test on synthetic data run through the identical pipeline, or bootstrap/resampling over frequency channels to report confidence intervals.
- [§4.4, Fig. 11] The phase flattening after delay compensation is not independent validation. The delay used for compensation is fitted from the same cross-correlation phase data whose slope it is meant to remove, so a residual slope near zero is expected by construction for any fitted delay, biased or not. The non-circular evidence is the comparison to the geometric delay, not the flattened fringes in Fig. 11. Please validate the compensation by applying a delay estimated from one observation (or from the geometric model) to another dataset, or by withholding a portion of the band during fitting and checking that the held-out portion also flattens.
- [§4.3.3, Table 3] The agreement between geometric and GPR delays is quoted without an uncertainty budget for either side. The geometric delays inherit errors from antenna coordinates, baseline angles, cable/analog-chain lengths, and source direction, none of which are propagated. The phrase 'excellent agreement within 5%' is not statistically meaningful unless the uncertainties are quantified. Please provide error bars on the GPR estimates and an error budget for the geometric delays, including contributions from antenna position surveys and the assumed source direction.
minor comments (5)
- [§3.1] The text says three channels carry effective signals, but the cross-correlation panel of Fig. 2 lists CrossSpec 0-1, 0-2, and 0-3; please clarify the channel numbering and which channels correspond to the 13 m and 16 m antennas.
- [§3.2.2, Fig. 8] The waterfall plots are labeled Channels 2, 4, 6, and 8, while Section 3.2 describes channels 0 through 7; state whether one-indexed labels are being used.
- [§4.2.2, Eq. (8)] The value of the kernel amplitude C is not given, and no rationale is provided for the chosen length scale and noise level; a brief sensitivity check (e.g., varying l by a factor of two) would increase confidence in the slope estimate.
- [§4.3.1] The phrase 'At our sampling rate of 128 MHz' is confusing because Table 1 lists a 4096 MHz ADC; clarify that 128 MHz is the channel bandwidth after the polyphase filter bank, and explain how the fractional delays are implemented at that rate.
- [References] Reference formatting is inconsistent (for example, 'SEEGER 2004' versus sentence-cased author names, and 'V .' with a stray space in dos Santos et al.); the journal style should be applied uniformly.
Circularity Check
Minor self-consistency check presented as validation; central sub-ns claim rests on independent geometric-vs-GPR comparison.
-
fitted input called prediction
[Section 4.4, Implementation of Delay Compensation; echoed in Section 5 Conclusion]
"Using the GPR-estimated delays, we applied corresponding integer and fractional delay compensation to the signal streams. The resulting interference fringes, shown in Fig. 11, demonstrate significant phase flattening and enhanced coherence between antennas."
The GPR 'actual delays' in Section 4.2.2 are obtained by fitting the slope of the unwrapped cross-correlation phase spectrum (Eqs. 5-8). Section 4.4 then removes exactly those fitted delays from the same cross-correlation data. Because applying a compensation ramp with the fitted slope flattens the phase by construction, the Fig. 11 'phase flattening' and the conclusion's statement that 'improved phase alignment ... confirmed the effectiveness' restate the fit rather than independently validate it. The non-circular evidence for the central sub-nanosecond claim is the comparison of the GPR-fitted delays with the geometric delays of Eq. (4), which are derived from independent baseline coordinates.
full rationale
The paper's central sub-nanosecond consistency claim compares geometric time delays (Eq. 4: tau = b cos(theta)/c) with signal-based GPR delays (Eqs. 5-8: phase-slope fitting of the cross-correlation spectrum). These two estimators are structurally independent: the geometric result uses antenna baseline coordinates and the source direction, while the GPR result uses the measured cross-correlation phase. The agreement within 5% is therefore a genuine cross-check, not a tautology. There is no load-bearing self-citation chain; the GPR references (SEEGER 2004; Mukangango et al. 2024) and array references (Wu et al. 2021) are external or acknowledgment-level. The main circular element is the delay-compensation demonstration: the fringes are flattened by removing the same fitted delays from the same data, so the improved phase alignment in Fig. 11 is a self-consistency check rather than an independent validation. The absence of error bars on the three delay comparisons in Table 3 is a statistical-correctness concern, not circularity. On balance, one minor forced validation appears, but the central claim retains independent content, so the circularity score is low.
Assumptions & free parameters
free parameters (5)
- GPR kernel amplitude C =
not reported
- GPR length scale l =
10 MHz (fixed)
- WhiteKernel noise sigma =
0.1
- Amplitude threshold for GPR points =
70th percentile
- RFI frequency masks =
878-897 MHz and 944-960 MHz
assumptions (4)
- standard math Standard interferometric phase-delay relation: phase difference equals 2π times baseline projection divided by wavelength (Eq. 3).
- domain assumption The phase slope of the cross-correlation spectrum is dominated by the geometric delay, with instrumental and atmospheric phases negligible or absorbed.
- domain assumption The observed sources (satellite, Sun, Cassiopeia A) are effectively point sources over the baselines and frequency range used for delay estimation.
- ad hoc to paper The RFI masks and amplitude threshold do not bias the fitted phase slope.
Cite this review
Pith. "Pith review of Design and Validation of the Digital Receiver System for the next-generation radio interferometer." pith.science (2026). https://pith.science/paper/VYVYEMRH
@misc{pith2026250600464,
  author       = {Pith},
  title        = {Pith review of: Design and Validation of the Digital Receiver System for the next-generation radio interferometer},
  year         = {2026},
  howpublished = {\url{https://pith.science/paper/VYVYEMRH}},
  note         = {Machine review of arXiv:2506.00464}
}
read the original abstract
This paper presents the design and validation of a digital receiver system developed for the next-generation radio interferometer projects. The receiver supports 8 analog inputs with 12-bit, 4GHz sampling and performs real-time signal processing using FPGA-based channelization. Field experiments were conducted to observe the Sun, a satellite beacon, and Cassiopeia A. Interference fringes were analyzed and modeled. Time delay compensation was implemented in two ways: theoretical calculation and Gaussian Process Regression (GPR) fitting. Results show sub-nanosecond consistency between the two methods. The field experiments demonstrate the receiver's suitability for future radio telescopes such as the BINGO-ABDUS project.
Figures


Figures from the paper (9 more)


Reference graph
Works this paper leans on
-
[1]
Abdalla, E., Ferreira, E. G. M., Landim, R. G., et al. 2022, Astronomy &; Astrophysics, 664, A14
work page 2022
-
[2]
2023, arXiv e-prints, arXiv:2309.05099
Abdalla, E., Marins, A., Abdalla, F., et al. 2023, arXiv e-prints, arXiv:2309.05099
arXiv 2023
-
[3]
Bandura, K., Addison, G. E., Amiri, M., et al. 2014, in Society of Photo-Optical Instrumentation Engineers (SPIE) Conference Series, V ol. 9145, Ground-based and Airborne Telescopes V , ed. L. M. Stepp, R. Gilmozzi, & H. J. Hall, 914522 dos Santos, Marcelo V ., Landim, Ricardo G., Hoerning, Gabriel A., et al. 2024, A&A, 681, A120
work page 2014
-
[4]
Square Kilometre Array: a concept design for Phase 1
Garrett, M. A., Cordes, J. M., Deboer, D. R., et al. 2010, arXiv e-prints, arXiv:1008.2871
work page Pith review arXiv 2010
- [5]
-
[6]
2024, Journal of Astronomical Instrumentation, 13, 2450008
Melis, A., Cabras, A., Comoretto, G., et al. 2024, Journal of Astronomical Instrumentation, 13, 2450008
work page 2024
-
[7]
Motta, P., Prinsloo, D., Witvers, R., et al. 2024, in 2024 International Conference on Electromagnetics in Advanced Applications (ICEAA), 244 18 Donghao Qu, Jiajun Zhang & Yajun Wu
work page 2024
-
[8]
Mukangango, J., Muyskens, A., & Priest, B. W. 2024, Advances in Statistical Climatology, Meteorology and Oceanography, 10, 143
work page 2024
Show all 17 references
-
[9]
Petroff, E., Hessels, J. W. T., & Lorimer, D. R. 2019, A&A Rev., 27, 4
2019
-
[10]
Rogers, A. E. E. 1970, Radio Science, 5, 1239
1970
-
[11]
2004, International Journal of Neural Systems, 14, 69, pMID: 15112367
SEEGER, M. 2004, International Journal of Neural Systems, 14, 69, pMID: 15112367
2004
-
[12]
J., Montenbruck, O., et al
Teunissen, P. J., Montenbruck, O., et al. 2017, Springer handbook of global navigation satellite systems, V ol. 10 (Springer)
2017
-
[13]
R., Moran, J
Thompson, A. R., Moran, J. M., & Swenson, Jr., G. W. 2017, Interferometry and Synthesis in Radio Astronomy, 3rd Edition van Haarlem, M. P., Wise, M. W., Gunst, A. W., et al. 2013, A&A, 556, A2
2017
-
[14]
2024, Frontiers in Astronomy and Space Sciences, 11, 1407870
Wang, Z., Li, J.-X., Zhang, K., et al. 2024, Frontiers in Astronomy and Space Sciences, 11, 1407870
2024
-
[15]
2011, in American Astronomical Society Meeting Abstracts, V ol
Whitney, A., Booler, T., Bowman, J., et al. 2011, in American Astronomical Society Meeting Abstracts, V ol. 218, American Astronomical Society Meeting Abstracts #218, 132.07
2011
-
[16]
2021, MNRAS, 506, 3455
Wu, F., Li, J., Zuo, S., et al. 2021, MNRAS, 506, 3455
2021
-
[17]
2024, AJ, 168, 222
Zhang, H.-l., Zhang, Y .-z., Guo, S.-c., et al. 2024, AJ, 168, 222
2024
Reviewed August 7, 2026 · model on record in the stance chip above.
Discussion (0). Continue with ORCID to comment.