REVIEW 4 major objections 3 minor 26 references
A New Scaling Function for QAOA Tensor Network Simulations
T0 review · 4 major / 3 minor · reviewed 2026-08-07 · deepseek-v4-flash
Pith's one-line read For one-layer QAOA on complete-graph MAXCUT, the ratio of summed entanglement entropy with versus without MPS truncation is a universal function of $2\log_2\chi/N$, independent of the number of qubits, and the paper proposes an analytic…
desk verdict Fig. 2's empirical entropy-sum scaling collapse is plausible; Eq. (27) is a calibrated heuristic that the paper's own data contradict. read the letter →
The pith
A machine-rendered reading of the paper's core claim, the machinery that carries it, and where it could break.
The reading
What carries the argument
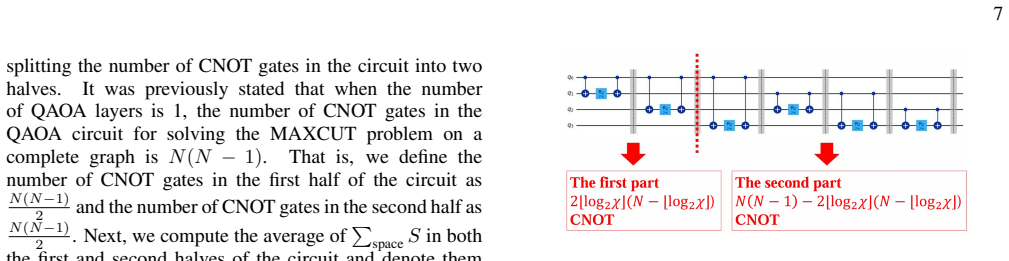
The central object is the space-time summed entanglement entropy, $\sum_{\text{space\&time}} S$, obtained by summing the bipartite entanglement entropy over every bond of every matrix product state immediately after each CNOT gate in the one-layer QAOA circuit. The carrying mechanism is the chain of proportionality $(\sum_{\text{space}} S)_{\text{first}} : (\sum_{\text{space}} S)_{\text{second}} : (\sum_{\text{space}} S)_{\text{max}} \sim \alpha/2 : \alpha : 1$ and its truncated analogue, which lets the ratio in Eq. (16) be replaced by ratios of closed-form maxima, $N^2/4$ (Eq. (17)) and Eq. (19). Dividing the resulting expressions for the truncated and untruncated sums yields the proposed function $H(2\log_2\chi/N)$ in Eq. (27).
What would settle it
Run the same one-layer complete-graph MAXCUT simulation at fixed $2\log_2\chi/N$ for system sizes beyond the fitted range (say $N=14,16,20$) with fresh random edge weights, and check whether the measured $PS_\chi/PS$ points land on the curve defined by the second line of Eq. (27) within the scatter seen in Fig. 5; if they systematically drift away as $N$ grows, the claimed $N$-independence and the analytic function are falsified.
Extended reading notes
Core claim
On its own terms, the paper's discovery is that the effect of MPS bond-dimension truncation on one-layer QAOA for complete-graph MAXCUT is governed by a universal curve. With $PS_\chi/PS$ defined as the ratio of the summed entanglement entropy over all bonds and all CNOT steps with and without truncation, the data collapse according to $PS_\chi/PS = G(2\log_2\chi/N)$ (Eq. (16)), with the same function $G$ for every system size $N$. The paper then proposes an explicit analytic approximant, the second line of Eq. (27), built from the theoretical maxima of the summed entropy in Eqs. (17) and (19) and from three empirical ratio assumptions, Eqs. (18), (20), and (22). The claim is that this gives the first theoretical analysis of the previously noted scaling relations, and that the universality traces to an $N$-independent pattern in how entanglement entropy grows along the QAOA circuit.
Load-bearing premise
The derivation depends on treating the numerical ratios in Tables I–III as exact equalities — first-half to second-half summed entropy of 1:2 and truncation-invariance of the normalized second-half sum — even though the same tables show deviations (about 0.42–0.44 and 0.84–1.03) that exceed the stated error bars in some rows.
Editorial extensions
If this is right
- At fixed $2\log_2\chi/N$, doubling the number of qubits requires doubling the bond dimension to keep the same entanglement-entropy ratio, so the MPS cost of a fixed-fidelity one-layer QAOA simulation grows only linearly in $N$.
- The analytic approximant Eq. (27) makes a concrete numerical prediction for truncation error, so deviations between simulation and Eq. (27) can be used to test whether the 1:2 and truncation-invariance assumptions are the correct mechanism.
- Because the ratio saturates near 1 as $2\log_2\chi/N \to 1$, the curve identifies a threshold bond dimension $\chi \sim 2^{N/2}$ beyond which truncation causes almost no entanglement loss.
- The paper argues that any quantum algorithm whose summed entanglement entropy grows linearly and then saturates with circuit depth would show an analogous scaling relation, making the phenomenon a candidate fingerprint of QAOA-like optimized circuits.
Reading between the lines
- The authors do not test whether the collapse persists for more than one QAOA layer; a natural extension is to check whether the scaling variable becomes $p(2\log_2\chi/N)$ or $(2\log_2\chi/N)/p$, which would turn the curve into a resource-estimation tool for deeper circuits.
- Because the assumed ratios in Tables I–III deviate from the ideal values (first/second around 0.42–0.44 rather than 0.5, and Eq. (22) ratios between 0.84 and 1.03 rather than 1), the proposed function is best read as an interpolation anchored to the numerics rather than a fully predictive derivation.
- If the universal curve is confirmed at larger $N$, a classical simulator could choose the bond dimension $\chi$ in advance from a target entanglement fidelity by inverting $H(2\log_2\chi/N)$, making the scaling relation a practical preconditioning step for QAOA simulations.
Editorial analysis
A structured set of objections, weighed in public.
Referee Report
Summary. This paper investigates entanglement entropy (EE) in one-layer QAOA on complete-graph MAXCUT simulated with matrix product states (MPS). The main empirical claim, Eq. (16), is that the ratio of the summed entanglement entropy over all bonds and time steps with truncation to that without truncation, P Sχ/P S, collapses onto a single curve as a function of 2 log2 χ/N. The paper further proposes Eq. (27) as an analytic approximation to this curve, derived from the assumed ratio relations Eqs. (18), (20), and (22) and from the theoretical maxima in Eqs. (17) and (19). Numerical results are shown in Figs. 2 and 5; the latter displays a visible discrepancy between Eq. (27) and the numerical data.
Significance. The empirical scaling collapse, if it persists under a proper statistical test, is a noteworthy extension of the scaling relations found in [19,21], and the use of entanglement entropy as the vertical axis makes the quantity amenable to further theoretical study. The observation in Fig. 7 that the spatial sum of EE grows approximately linearly and then saturates is also interesting. However, the paper's analytic scaling function is not validated: Eq. (27) is calibrated to the same data from which Tables I–III are drawn, and the mismatches shown in Fig. 5 are acknowledged by the authors. The contribution is therefore primarily an empirical scaling law; the theoretical claim needs substantial revision.
major comments (4)
- [Section IV] Eqs. (18), (20), and (22) are load-bearing inputs to the derivation of Eq. (27), but they are inferred from the same numerical data to which Eq. (27) is compared. Eq. (18) assumes a 1:2 ratio, yet Table I reports 0.417, 0.430, and 0.436 for N=8,10,12, each at least two standard deviations from 1/2; Table II supports Eq. (20) with values 0.436–0.550; and Table III gives 0.844–1.031 instead of 1 for Eq. (22). Because the final x-dependence in Eq. (27) is built from these assumed ratios, the function is not a parameter-free prediction but a curve calibrated to the dataset. Fig. 5 confirms a clear mismatch. The authors should either provide a first-principles derivation of Eq. (27), show that the deviations in Tables I–III do not affect the functional form within statistical error, or reframe Eq. (27) as an empirical fit and test it on independent data.
- [Fig. 2 and Eq. (16)] The claimed scaling collapse is the central empirical result, but no error bars or quantitative collapse metric are provided. With only N=8,10,12 and a small set of χ values, the visual collapse in Fig. 2 cannot be evaluated rigorously. The authors should report uncertainties over the 100 weight samples, provide a quantitative measure such as the maximum deviation from a single curve, and address the discreteness of the horizontal axis for small χ.
- [Appendix C] The 'theoretical basis' of Eqs. (18), (20), and (22) is presented as the observation that the spatial sum of EE increases linearly in the early part of the circuit and saturates afterward. This observation is made from the same numerical data and does not constitute an independent derivation; the three proportionality assumptions remain empirical calibration assumptions. The authors should state this explicitly or derive the ratios from a concrete model of EE growth, otherwise the phrase 'theoretical analysis' overstates what Eqs. (18), (20), and (22) provide.
- [Table II] The row 'N = 12, χ = 8' in Table II is listed as 0.43605110 ± 0.02234253, which is identical to the N=12 row of Table I. This is almost certainly a transcription error. Because Table II is used to motivate Eq. (20), the authors must correct or explain this entry.
minor comments (3)
- [Eq. (16)] The display 'P Sχ P S' should be formatted as a ratio with a slash or fraction bar, and the denominator contains a typo: 'λ2 i,j,,k' has a double comma.
- [Section IV and Fig. 5] The text says Fig. 5 plots the 'theoretical approximation given by the second line of Eq. (27)', while the caption says Eq. (27); please clarify which form is plotted, since the final line of Eq. (27) uses the additional approximation ⌊log2 χ⌋ ≈ log2 χ.
- [Section IV, Eqs. (25)-(26)] The approximations N(N−1)/2 ≈ N²/2 and N(N−1) ≈ N² introduce errors of roughly 8–14% for N=8–12, which are comparable to the discrepancies in Fig. 5; the discussion should quantify the contribution of these approximations to the observed mismatch.
Circularity Check
Eq. (27) is presented as a theoretical scaling function, but its functional form is fixed by 1:2 and 1 ratio assumptions read off the same 100-instance simulations (Tables I–III) to which it is compared in Fig. 5; the paper's own tables contradict those assumed values.
-
fitted input called prediction
[Section IV (Analysis), Eqs. (18), (20), (22) and the derivation of Eq. (27); Tables I–III; Fig. 5]
"From this result, we assume that the following relationship holds: (Σ_space S)_first : (Σ_space S)_second ∼ 1 : 2 (18) ... From the numerical calculation results with truncation ... it was found that a ratio similar to the one in Table I is obtained. ... (Σ_space Sχ)_first : (Σ_space Sχ)_second ∼ 1 : 2 (20) ... Using the previous discussion, an analytical calculation of Eq. (16) becomes possible. ... Possible reasons for the discrepancy include: (1) the errors in the relationships in Tables I, II and III were too large"
Tables I–III and Fig. 5 are averages over the same 100 random-weight instances (Appendix A). Eq. (27) is Eq. (16) rewritten: Eqs. (25)–(26) split the sums into first/second halves and substitute the assumed constants 1:2 (Eqs. 18, 20) and equal normalized second-half ratios (Eq. 22). Had these ratios been exact, Eq. (27) would reproduce the Fig. 5 curve by construction (up to the paper's own N(N−1) ≈ N² approximations), so the comparison would not test an independent prediction. They are not exact: Table I gives 0.4166–0.4361, 2–3σ from 0.5; Table III gives 0.844–1.031, not 1. The paper itself attributes the Fig.
-
other
[Appendix C, justification of Eqs. (18), (20), (22); Fig. 7]
"The theoretical basis of Eqs. (18) and (20) is presumed to be related to the development of EE within the circuit. As seen in Fig. 7, the sum of EE in the space direction increases linearly at the beginning of the QAOA circuit, regardless of N, and gradually approaches a constant value when the number of CNOT gates exceeds half ... From this fact, Eqs. (18) and (20) can be explained."
The “theoretical basis” is itself an appeal to the same numerics: Fig. 7 is generated from the same 100-instance simulations that produce Tables I–III and Fig. 5, and the linear-then-saturating picture would imply the 1:2 area ratio only if the ramp reached the maximum exactly at the half-way point, which Table I contradicts (0.4166–0.4361). The basis for Eq. (22) is likewise a heuristic proportionality remark (“both become smaller in proportion to χ ... the result remains the same”), not a derivation from an independent source. The load-bearing inputs of Eq. (27) are therefore justified circularly by the very numerical calculations the proposed function is meant to describe.
full rationale
The empirical data-collapse of Eq. (16) and Fig. 2 is an honest observation and is not itself circular, and the maximum identities Eqs. (17) and (19) are exact combinatorics (sums of log2 of ladder bond dimensions). The circularity is localized to the status of Eq. (27) as a “theoretical” scaling function: its functional form is fixed by the constants 1:2 and 1 in Eqs. (18), (20), and (22), which the paper adopts directly after inspecting Tables I–III of the same 100-instance simulations whose ratio curve (Fig. 5) it is then compared against. The paper's own tables contradict the idealizations (Table I: 0.417–0.436 vs 0.5; Table III: 0.844–1.031 vs 1), so Eq. (27) is neither an independent first-principles prediction nor a faithful calibrated fit to its stated inputs; the authors concede the Fig. 5 discrepancy and attribute it to “errors in the relationships in Tables I, II and III”. Notably, Table II's N=12, χ=8 row (0.43605110±0.02234253) is identical to Table I's N=12 row to all eight digits, indicating a duplicated entry that further weakens the empirical support for Eq. (20). There is no author-overlapping self-citation chain (Refs. [19] and [21] are by other groups) and no imported uniqueness theorem, so the score reflects the fitted-input-as-prediction circularity of the central analytic claim, not citation practice. Overall: partial circularity—the scaling relation itself rests on its numerical collapse, but the proposed scaling function is data-conditioned rather than independently derived.
Assumptions & free parameters
free parameters (2)
- half-circuit EE ratio (assumed 1:2) =
~0.5 (numerical values 0.416-0.436 for N=8,10,12 in Table I; 0.44-0.55 in Table II)
- truncation-invariance constant α =
~1 (values 0.84-1.03 in Table III)
assumptions (3)
- domain assumption Maximum space-summed EE occurs when bond dimensions grow as 2,4,8,...,2^{N/2} toward the center, yielding (Σ_space S)_max = N^2/4.
- ad hoc to paper Entanglement entropy grows approximately linearly in the first part of the circuit and then stabilizes.
- ad hoc to paper The ratio relations Eqs. (18), (20), (22) hold exactly enough for large N.
Cite this review
Pith. "Pith review of A New Scaling Function for QAOA Tensor Network Simulations." pith.science (2026). https://pith.science/paper/W6UWJUTD
@misc{pith2026250523256,
  author       = {Pith},
  title        = {Pith review of: A New Scaling Function for QAOA Tensor Network Simulations},
  year         = {2026},
  howpublished = {\url{https://pith.science/paper/W6UWJUTD}},
  note         = {Machine review of arXiv:2505.23256}
}
read the original abstract
With the rapid development of quantum computers in recent years, the importance of performance evaluation in quantum algorithms has been increasing. One method that has gained attention for performing this evaluation on classical computers is tensor networks. Tensor networks not only reduce the computational cost required for simulations by using approximations but are also deeply connected to entanglement. Entanglement is one of the most important elements for the quantum advantages of quantum algorithms, but the direct relationship between quantum advantages and entanglement remains largely unexplored. Tensor networks are promising as a means to address this question. In this study, we focus on the entanglement in the Quantum Approximate Optimization Algorithm (QAOA). This study aims to investigate entanglement in QAOA by examining the relationship between the approximation rates of tensor networks and the performance of QAOA. Specifically, we actually perform tensor network simulations of QAOA on a classical computer and extend the study of the scaling relations presented in previous research. We have discovered that scaling relations hold even when entanglement entropy is used as the vertical axis. Furthermore, by analyzing the results of the numerical calculations, we propose a new function for the scaling relation. Additionally, we discovered interesting relationships regarding the behavior of entanglement in QAOA during our analysis. This research is expected to provide new insights into the theoretical foundation of the scaling relations presented in previous studies.
Figures


Figures from the paper (3 more)


Reference graph
Works this paper leans on
-
[1]
in Eq. (2) correspond to the amount of information that can be stored in the MPS and indicate the amount of entanglement in the MPS. In the following discussion, we mathematically confirm this point. First, we consider a Hilbert space that is divided into two parts as H = HL⊗HR, with the boundary between then-th tensor and the (n+1)-th tensor. Here, HL(HR...
-
[2]
S. K. Sood, and Pooja, Quantum Computing Review: A Decade of Research, IEEE Transactions on Engineering Management (V olume: 71) (2023). 11
work page 2023
-
[3]
Promoting the application of advanced quantum technology platforms to social issues
is unclear, but it will likely help clarify the theoretical foundation of the scaling relation in [19]. V . CONCLUSION AND OUTLOOK In this study, we developed the scaling relations presented in previous research [19] and discovered that a new scaling relation based on the entanglement entropy (EE) holds. Moreover, since this scaling relation is based on t...
-
[4]
R. P. Feynman, Simulating physics with computers, in Feynman and Computation (CRC Press, Boca Raton, FL, 2018), pp. 133-153
work page 2018
-
[5]
IBM Quantum (2025), https://quantum.ibm.com/
work page 2025
-
[6]
M. A. Shafique, A. Munir, I. Latif, Quantum Computing: Cir- cuits, Algorithms, and Applications, IEEE Access (V olume: 12). (2024)
work page 2024
-
[7]
A. W. Harrowand and A. Montanaro, Quantum computational supremacy, Nature 549, 203 (2017)
work page 2017
-
[8]
Google Quantum AI and Collaborators, Quantum error correction below the surface code threshold, Nature, volume 638, p. 920–926 (2025)
work page 2025
Show all 26 references
-
[9]
Gottesman, The Heisenberg Representation of Quantum Computers, arXiv:quant-ph/9807006
D. Gottesman, The Heisenberg Representation of Quantum Computers, arXiv:quant-ph/9807006
-
[10]
Roffe, Quantum error correction: an introductory guide, Taylor & Francis, Contemporary Physics 2019, VOL
J. Roffe, Quantum error correction: an introductory guide, Taylor & Francis, Contemporary Physics 2019, VOL. 60, NO. 3, 226–245 (2019)
2019
-
[11]
M. A. Nielsen and I. L. Chuang, Quantum Computation and Quantum Information 10th Anniversary Edition , Cambridge University Press, Cambridge, 2012
2012
-
[12]
Preskill, Quantum Computing in the NISQ era and beyond, Quantum 2, 79 (2018)
J. Preskill, Quantum Computing in the NISQ era and beyond, Quantum 2, 79 (2018)
2018
-
[13]
L. K. Grover, A fast quantum mechanical algorithm for database search, Proceedings, 28th Annual ACM Symposium on the Theory of Computing, p. 212 (1996)
1996
-
[14]
T. L. Patti, J. Kossaifi, A. Anandkumar, and S. F. Yelin, Variational quantum optimization with multibasis encodings, Physical Review Research 4, 033142 (2022)
2022
-
[15]
P. W. Shor, Polynomial-Time Algorithms for Prime Factoriza- tion and Discrete Logarithms on a Quantum Computer, SIAM Journal on Computing. 26 , 1484 (1997)
1997
-
[16]
Okunishi, T
K. Okunishi, T. Nishino and H. Ueda, Developments in the Tensor Network — from Statistical Mechanics to Quantum Entanglement, Phys. Soc. Jpn. 91, 062001 (2022)
2022
-
[17]
Farhi, J
E. Farhi, J. Goldstone, S. Gutmann, A Quantum Approximate Optimization Algorithm, arXiv:1411.4028
-
[18]
B. A. Martin, T. Ayral, F. Jamet, M. J. Ran ˇci´c, and P. Simon, Combining matrix product states and noisy quantum computers for quantum simulation, PRA 109, 062437 (2024)
2024
-
[19]
scaling relation
reported the following scaling relation by comparing the energy expectation values of QAOA circuits with and without truncation: ⟨Ψχ p (⃗ γopt, ⃗βopt)|HC|Ψχ p (⃗ γopt, ⃗βopt)⟩ ⟨Ψp(⃗ γopt, ⃗βopt)|HC|Ψp(⃗ γopt, ⃗βopt)⟩ = F ln χ N (15) Here, F is an undetermined function, χ is th...
-
[20]
Bisgard, Analysis and Linear Algebra: The Singular V alue Decomposition and Applications
J. Bisgard, Analysis and Linear Algebra: The Singular V alue Decomposition and Applications. Student Mathematical Li- brary, AMS. ISBN 978-1-4704-6332-8 (2021)
2021
-
[21]
L. Zhou, S. Wang, S. Choi, H. Pichler and M. D. Lukin, Quan- tum Approximate Optimization Algorithm, Performance, Mechanism, and Implementation on Near-Term Devices, PRX 10, 021067 (2020)
2020
-
[22]
Dupont , N
M. Dupont , N. Didier, M. J. Hodson, J. E. Moore, M. J. Reagor, Calibrating the Classical Hardness of the Quantum Approximate Optimization Algorithm, PRX QUANTUM 3, 040339 (2022)
2022
-
[23]
Perez-Garcia, F
D. Perez-Garcia, F. Verstraete, M.M. Wolf, J.I. Cirac, Matrix Product State Representations, arXiv:0608197v2
-
[24]
A. C. Nakhl, T. Quella, M. Usman, Calibrating the role of en- tanglement in variational quantum circuits, PRA 109,032413 (2024)
2024
-
[25]
Abraham et al., Qiskit: An Open-source Framework for Quantum Computing, (2019), https://github.com/Qiskit
H. Abraham et al., Qiskit: An Open-source Framework for Quantum Computing, (2019), https://github.com/Qiskit
2019
-
[26]
Gray, quimb: A python package for quantum information and many-body calculations, J
J. Gray, quimb: A python package for quantum information and many-body calculations, J. Open Source Softw. 3, 819 (2018)
2018
Reviewed August 7, 2026 · model on record in the stance chip above.
Discussion (0). Sign in to comment.