REVIEW 3 major objections 4 minor 22 references
Determination of the properties of a superconducting single crystal FeSe using an EPR spectroscopy
T0 review · 3 major / 4 minor · reviewed 2026-08-10 · deepseek-v4-flash
Pith's one-line read This paper claims that a 180-degree phase jump in the non-resonant EPR signal of a FeSe single crystal marks vortex entry and yields a contactless estimate of the first critical field.
desk verdict Real EPR data on FeSe with a plausible but unproven phase-jump assignment for Hc1. read the letter →
The pith
A machine-rendered reading of the paper's core claim, the machinery that carries it, and where it could break.
The reading
What carries the argument
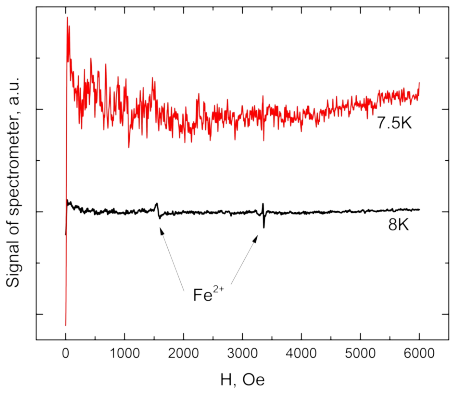
The central object is the non-resonant EPR signal: the spectrometer output recorded when no spin resonance is excited, which the paper treats as proportional to the derivative of microwave power absorbed in the resonator. The load-bearing feature is a 180-degree phase jump between negative and positive signal branches, interpreted as the signature of the crystal switching from reflecting microwaves in the Meissner state to absorbing them in the vortex state. Two quantitative relations carry the analysis: the resonance condition $\nu = g\mu_0\mu_B H/h$, which converts the 1400 Oe and 3400 Oe resonances into Fe$^{2+}$ assignments, and the demagnetization identity $H_p\simeq H_{c1}(d/w)^{0.5}$, which corrects the measured jump field for the sample's flat geometry.
What would settle it
A decisive test would be to record the EPR phase while monitoring the local magnetic induction on the same FeSe crystal; if the first vortex penetration, seen as the first deviation of local induction from the Meissner value, does not occur at the applied field of the 180-degree phase jump, the identification of that jump with $H_{c1}$ is wrong.
Extended reading notes
Core claim
On the authors' account, the non-resonant EPR signal of a superconducting FeSe platelet is proportional to the field derivative of the microwave power absorbed in the resonator, so in zero and weak fields its temperature dependence traces the superconducting transition. They observe that the signal is negative below about 12 Oe and positive above about 14 Oe, with a 180-degree phase change at the crossover, and they identify this phase jump, seen near 6 K, as the transition from the Meissner state to the mixed state in which Abrikosov vortices (quantized flux tubes) enter the crystal. Taking the measured jump field $H_p=12$ Oe as the shape-dependent entry field and applying the relation $H_p\simeq H_{c1}(d/w)^{0.5}$ with $d/w=0.4/2$ gives $H_{c1}\approx 27$ Oe, matching the magnetization value of about 25 Oe from the literature. The paper also finds ordinary EPR resonances at 1400 Oe and 3400 Oe, assigns them to Fe$^{2+}$ ($3d^6$, $S=2$) ions with $g\approx 4.8$ and $2.0$, and shows that the non-resonant signal is field-independent above $T_c$ but strongly nonlinear once vortices are present.
Load-bearing premise
The $H_{c1}$ determination rests on the unproven interpretive step that the 180-degree phase jump of the non-resonant EPR signal is caused by vortex entry into the mixed state, rather than by some other resonator or sample effect.
Editorial extensions
If this is right
- If the phase-jump assignment is correct, a single weak-field EPR sweep gives a contactless estimate of $H_{c1}$ for FeSe without electrical contacts.
- The same non-resonant signal shape yields $T_c^{\rm onset}\approx 8$ K and a transition width of about 4 K, matching the resistive transition picture based on the two-fluid model.
- Because the method senses the mixed state through vortex-induced microwave absorption, it could be extended to other iron-based superconductors where $H_{c1}$ is awkward to measure resistively.
- The normal-state resonances at 1400 Oe and 3400 Oe provide an EPR fingerprint of Fe$^{2+}$ in FeSe, which may help monitor stoichiometry or doping in iron chalcogenides.
Reading between the lines
- We infer that tracking the phase-jump field as a function of temperature, which the paper does not do, would yield a continuous $H_{c1}(T)$ curve and a direct test of whether the jump field stays proportional to $H_{c1}$ throughout the superconducting range.
- We infer that the demagnetization correction $H_p\simeq H_{c1}(d/w)^{0.5}$ is a simplified shape factor; measuring crystals with different aspect ratios would show whether the relation captures the geometry or needs revision.
- We infer that a control experiment on a normal metal or a type-I superconductor in the same resonator would reveal whether the 180-degree phase flip is unique to vortex penetration or is partly a generic cavity response.
- We infer that simultaneous magnetization and EPR phase measurements on the same crystal would give the cleanest quantitative check of the paper's identification of the phase jump with $H_{c1}$.
Signed reviews
Editorial analysis
A structured set of objections, weighed in public.
Referee Report
Summary. The manuscript reports EPR measurements on a FeSe single crystal (2.5 x 2 x 0.4 mm3) in magnetic fields up to 6000 Oe at temperatures from 3.5 K to 25 K, supplemented by MPMS magnetization used to determine the onset of superconductivity. The authors claim that non-resonant EPR signals in zero and weak fields can determine Tc, the superconducting transition width, and Hc1. The central Hc1 value is obtained by interpreting a 180-degree phase jump of the EPR signal near H = 12 Oe as the onset of Abrikosov-vortex penetration, then applying the demagnetization relation Hp approximately Hc1(d/w)^0.5 to obtain Hc1 ~ 27 Oe, which is compared with ~25 Oe from the literature. Resonant features at 1400 and 3400 Oe are assigned to Fe2+ ions with g-factors of about 4.8 and 2.0.
Significance. If the phase-jump identification were quantitatively established, the paper would offer a contactless, all-EPR route to Tc, transition width, and Hc1 in small superconducting single crystals, which would be of practical interest to the FeSe and iron-chalcogenide community. The reported Fe2+ EPR resonances and g-factor values are also a useful addition. The manuscript is, however, exploratory and largely qualitative: the central Hc1 conclusion rests on an unproven interpretation of the phase jump, the Tc and transition-width values are extracted by visual comparison with model curves, and the data are given in arbitrary units without error bars. The use of MPMS magnetization to anchor Tconset is a strength, as is the clear presentation of the raw field and temperature dependences.
major comments (3)
- [§3, paragraph on the 180-degree phase jump (around Fig. 4)] The central claim that the phase jump at H ~ 12 Oe equals the first critical field is not established. The text states that vortex formation 'can lead' to a 180-degree phase change, but it provides no cavity-perturbation model relating the resonator Q-factor and phase to vortex density, no phase calibration, and no control experiment on the same crystal. The observed sign change between 11.72 and 14 Oe could also arise from Meissner screening currents changing the cavity detuning, from surface-impedance changes at the onset of flux penetration, or from field-modulation artifacts; notably, the modulation amplitude of 20 Oe is larger than the claimed Hp = 12 Oe. A same-sample magnetization measurement of Hc1 using the already available MPMS-XL5, or a quantitative model, is required to support the assignment.
- [§3, interpretation of Fig. 4 as temperature derivatives] The paper correctly states that an EPR signal is proportional to the first field derivative of the absorbed microwave power, but then asserts that the temperature dependences in Fig. 4 'represent a family of temperature derivatives of this transition'. This step is unjustified: at fixed field, the lock-in output is the field derivative evaluated as a function of temperature, not the temperature derivative. The relation between dP/dH at fixed H and dR*/dT must be derived or demonstrated before the extracted values Tc ~ 8 K, transition width ~ 4 K, and zero-resistance temperature 4.0 K can be accepted. The comparison with the model curves in Fig. 5 is visual and qualitative, with no fit metric or uncertainty estimate.
- [§3, Eq. (1) and comparison with ref. [11]] The closeness of Hc1 = 27 Oe to the literature value of 25 Oe is presented as confirmation of the phase-jump interpretation, but it is only a weak consistency check. Hp is quoted as '12 Oe' even though the data only bracket it between 11.72 and 14 Oe; no uncertainty is given for Hc1, and the literature value from ref. [11] is also quoted without an error bar. In addition, Eq. (1) is applied without specifying the orientation of the EPR magnetic field relative to the c axis of the crystal and without justifying the demagnetization form-factor approximation for this particular sample shape. The apparent agreement therefore does not independently validate the assignment of the phase jump to Hc1.
minor comments (4)
- [Abstract] The abstract states that non-resonant EPR signals above 8 K are field independent, while Section 3 says they are field independent 'with the exception of two local features' at 1400 and 3400 Oe; please reconcile these statements.
- [Fig. 4 caption and Section 3] Please specify whether the curves in Fig. 4 are raw data or vertically shifted, and define the sign convention used to identify a 180-degree phase change; without this, the field at which the jump occurs cannot be read off precisely.
- [Throughout] Typos such as 'Referenses' and 'trasition' should be corrected, and the inconsistent notation 'Tconset'/'Tсonset' should be unified; all symbols in Eq. (2), including nu, mu0, muB, and h, should be defined at first use.
- [§3, Fig. 5] Since the experimental EPR signals have no numerical vertical scale, please describe how the model curves in Fig. 5 were normalized before the visual comparison with the experimental curves in Fig. 4.
Circularity Check
No significant circularity: the Hc1 value is derived from an observed 12 Oe phase jump plus an external geometric formula and checked against an independent literature value.
full rationale
The derivation chain is not circular. The load-bearing Hc1 claim starts from a measured 180-degree phase change of the non-resonant EPR signal in a field of about 12 Oe, converts it to a demagnetization-corrected Hc1 ≈ 27 Oe using Eq. (1), and compares this with Hc1 ≈ 25 Oe from the independent magnetization study in ref. [11]. None of these inputs is the target result itself: the phase-jump field is an observed quantity, Eq. (1) is an external published formula, and ref. [11] is an independent measurement on another crystal. The Tc and transition-width statements are read off the measured temperature dependences and are only illustrated by model derivative curves, not fitted parameters that reappear as predictions. The paper's self-citations [7,8] are contextual and do not support any central premise. The weak point identified by a skeptical reader—the unproven mapping of the phase jump to Abrikosov-vortex entry—is a physical-interpretation or validity concern, not a circularity: even if the interpretation were wrong, the claim would be unsupported rather than reduced to its own input. Accordingly no circular step can be quoted and exhibited, and the honest finding is no significant circularity with score 0.
Assumptions & free parameters
assumptions (4)
- domain assumption The non-resonant EPR signal is the field derivative of microwave absorption, and the temperature dependence in Figure 4 is the temperature derivative of the resistive superconducting transition.
- ad hoc to paper A 180-degree phase jump of the EPR signal marks entry into the mixed state, so the field at which it occurs equals Hc1.
- domain assumption The relation Hp being approximately Hc1(d/w)^0.5 from Zeldov et al. applies to the sample geometry, allowing conversion of the measured 12 Oe jump to Hc1 of about 27 Oe.
- domain assumption The resonance fields 1400 Oe and 3400 Oe at 9.407 GHz correspond to Fe2+ (3d6, S=2) with g-factors 4.8 and 2.0, and Fe3+ is excluded as the source.
Cite this review
Pith. "Pith review of Determination of the properties of a superconducting single crystal FeSe using an EPR spectroscopy." pith.science (2026). https://pith.science/paper/WA5HWATQ
@misc{pith2026260806602,
  author       = {Pith},
  title        = {Pith review of: Determination of the properties of a superconducting single crystal FeSe using an EPR spectroscopy},
  year         = {2026},
  howpublished = {\url{https://pith.science/paper/WA5HWATQ}},
  note         = {Machine review of arXiv:2608.06602}
}
read the original abstract
Using an EPR spectrometer, the properties of single-crystal FeSe were studied in a magnetic field up to 6000 Oe at temperatures from 3.5 K to 8 K in the superconducting state and at temperatures above 8K and up to 25K in the normal state. It was shown that by measuring non-resonant spectrometer signals in zero and weak magnetic fields up to 30 Oe, it is possible to determine critical temperature Tc, the superconducting transition width, and the value of the first critical magnetic field Hc1 in FeSe single-crystal. Resonant EPR signals are observed in fields at 1400 Oe and 3400 Oe, which corresponds to the paramagnetism of doubly ionized iron atoms (Fe2+) in the FeSe crystal. Non-resonant EPR signals in a magnetic field up to 6000 Oe at temperatures from 3.5K to 8K are a nonlinear function of the field, and correspond to the superconducting mixed state of the FeSe, but at temperatures above 8K (up to 25K) they are field independent.
Figures


Figures from the paper (3 more)


Reference graph
Works this paper leans on
-
[11]
D. L. Lyfar’, D. P. Moiseev, A. A. Motuz, S. M. Ryabchenko, S. K. Tolpygo, Low Temperature Physics, 13, No. 8, pp. 503–505 (1987).https://doi.org/10.1063/10.0031770
-
[1]
Introduction Over a long period of time, EPR spectroscopy was used primarily to study dielectrics, non- superconducting metals, and metallic compounds that have paramagnetic centers [1]. The usefulness of its use for studying bulk superconductors was questioned by the work of Azbel and Lifshitz [2]. The emergence of "unusual" high-temperature superconduct...
work page 2021
-
[2]
Setting up experiments The study was conducted on a FeSe sample in the form of a flat single crystal with dimensions of approximately 2.5×2×0.4 mm3. The measurements consisted of recording the EPR signal from the crystal at magnetic fieldH in the range of 0–6000 Oe for temperatures from 3.5 K to 25 K using a Bruker X-/Q-band E580 FT/CW ELEXSYS spectromete...
-
[3]
Results of measurements of FeSe characteristics and their discussion Before the EPR measurements, the superconducting transition temperatureTconset of the FeSe single-crystal sample was determined using MPMS-XL5. Figure 1 shows the dependence of the magnetic moment m of the studied single crystal on temperature in the superconducting phase transition regi...
work page 2000
-
[4]
Non-resonant EPR signals in FeSe single crystal vary versus magnetic field and temperature in the rangeH = 0–6000 Oe andT = 3.5–25 K, while EPR resonances exist only atH = 1400 Oe and 3400 Oe
-
[5]
Temperature dependences of non-resonant EPR signals from FeSe single crystal at temperatures of 3.5–8 K in zero and weak magnetic fields allow contactless determination of the temperature and magnetic parameters of its superconducting transition, in particular, the magnitude of the first critical magnetic field (Hc1) at the transition
-
[6]
The emergence of a mixed superconducting state in a FeSe single crystal in magnetic field is accompanied by a previously unknown sharp change in the phase of the non-resonant EPR signal by 180 degrees
-
[7]
The nonlinear magnetic dependence of the nonresonant EPR signal of the superconducting FeSe single crystal at temperatures from 3.5 K to 8 K in a magnetic field fromHc1 to 6000 Oe can be explained by the existence of a mixed state of the crystal as a type II superconductor
Show all 22 references
-
[8]
Fundamental research on the most important problems of natural sciences
The resonance EPR signals made it possible to establish the values of theg-factors of the FeSe single crystal (4.8 and 2), at which its iron ions have a charge of +2 (Fe+2). The authors express their gratitude to D. A. Chareev for preparing FeSe single crystals, M. I. Kobets a...
2025
-
[9]
S. A. Altshuler and B. M. Kozyrev, Electron Paramagnetic Resonance, State Publishing House of Physical and Mathematical Literature, M., 1961
1961
-
[10]
M. Ya. Azbel, I.M. Lifshitz, JETP,33,792 (1957)
1957
-
[12]
Khasanov, Yu.M
R.I. Khasanov, Yu.M. Vashakidze and Yu.I. Talanov, Physica C,218, 51-58(1993). https://doi.org/10.1016/0921-4534(93)90264-Q
1993 doi
-
[13]
Salakhutdinov, Y
L. Salakhutdinov, Y. Talanov, E. Giannini, R. Khasanov,Appl.Mag.Res.,70, № 1, P. 37–46. (2011).https://doi.org/10.1007/s00723-010-0176-2
2011 doi
-
[14]
Aliev, Ya
M.K. Aliev, Ya. Vavryshchuk, S.P. Volosyanyj, T.M. Muminov, B.A. Olimov, I. Kholbaev, Fizika Tverdogo Tela,31(9), 254-257 (1989)
1989
-
[15]
Prokhvatilov, V.V
A.I. Prokhvatilov, V.V. Meleshko, S.I. Bondarenko, V.P. Koverya, A. Wisniewski, Low. Temp.Phys., 46, 181–186 (2020).https://doi.org/10.1063/10.0000538
2020 doi
-
[16]
Bondarenko, A.I
S.I. Bondarenko, A.I. Prokhvatilov, R. Puzniak, J. Pietosa, A.A. Prokhorov, V.V. Meleshko, V.P. Timofeev, V.P. Koverya, D.J. Gawryluk, A. Wisniewski, Materials,14, 7900 (2021). https://doi.org/10.3390/ma14247900
2021 doi
-
[17]
Poole, Electron spin resonance, Interscience Publishers, N.Y., 1967
C.P. Poole, Electron spin resonance, Interscience Publishers, N.Y., 1967
1967
-
[18]
Nazarova, N
E. Nazarova, N. Balchev, K. Nenkov, K. Buchkov, D. Kolacheva, A. Zachariev and G. Fuchs, Supercond. Sci. Technol.,28, 025013 (2015).https://doi.org/10.1088/0953-2048/28/2/025013
2015 doi
-
[19]
Abdel-Hafiez, J
M. Abdel-Hafiez, J. Ge, A. N. Vasiliev, D. A. Chareev, J. Van de Vondel, V. V. Moshchalkov, and A. V. Silhanek, Phys.Rev.B88, 174512 (2013).https://doi.org/10.1103/PhysRevB.88.174512
2013 doi
-
[20]
Zeldov, J
E. Zeldov, J. R. Clem, M. McElfresh, and M. Darwin, Phys. Rev. B 49, 9802 (1994). https://journals.aps.org/prb/abstract/10.1103/PhysRevB.49.9802
1994 doi
-
[21]
Superconductivity,
E. A. Lynton, “Superconductivity,” Methuen, London, 1962
1962
-
[22]
Saint-James, G
D. Saint-James, G. Sarma, E.J. Thomas, Type II superconductivity, Pergamon Press, 1969
1969
Reviewed August 10, 2026 · model on record in the stance chip above.
Discussion (0). Continue with ORCID to comment.