Heads, Not Backbones: Output Heads Dominate Architectures on Fat-Tailed Returns
Pith reviewed 2026-06-30 07:19 UTC · model grok-4.3
The pith
The output head dominates the backbone architecture when forecasting fat-tailed financial returns at short horizons.
A machine-rendered reading of the paper's core claim, the machinery that carries it, and where it could break.
Core claim
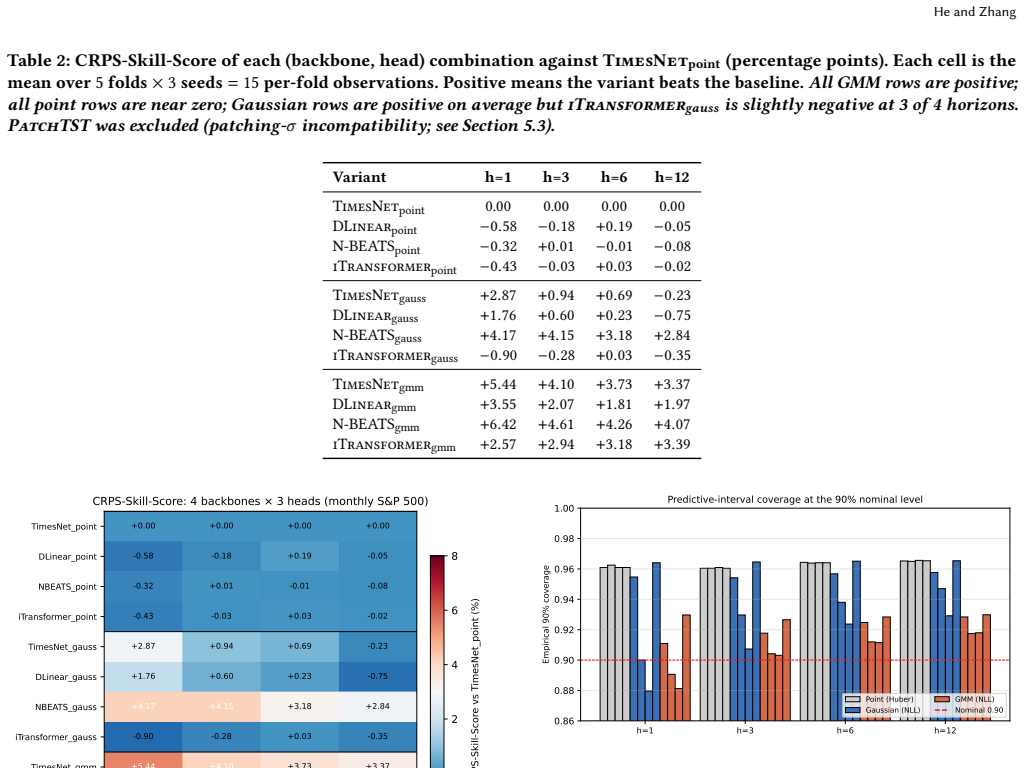
On S&P 500 monthly log-returns, switching among point, Gaussian, and mixture heads produces a consistent CRPS gradient of roughly 3.7 percentage points that exceeds the spread across backbones, with the mixture head delivering its largest gains in the highest-volatility periods.
What carries the argument
The three output heads (point estimator, single Gaussian density, and four-component Gaussian mixture density) evaluated under anchored walk-forward validation.
If this is right
- Switching from point head to Gaussian improves CRPS by about 1.3 percent.
- Switching from single Gaussian to mixture adds a further 2.4 percent.
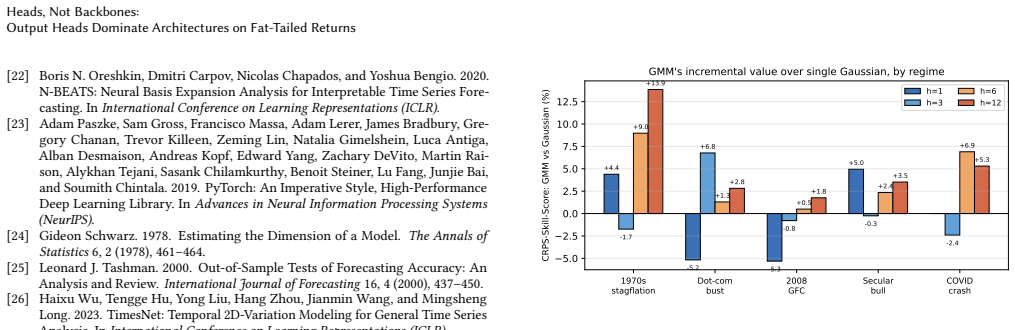
- The mixture advantage reaches 13.9 percent in high-volatility regimes at longer short-horizons.
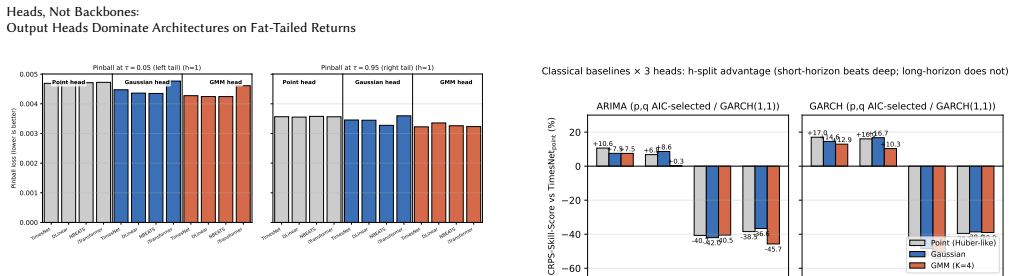
- At horizons of six months and beyond the backbone regains dominance over the head.
Where Pith is reading between the lines
- Model developers may achieve better tail-risk forecasts by investing in head architecture rather than deeper backbones.
- Similar head dominance could appear in other domains with fat-tailed outcomes such as energy or insurance.
- Risk managers should test mixture heads specifically during identified crisis windows.
Load-bearing premise
The selected backbones and heads form a representative sample whose relative performance rankings remain stable across other datasets and time periods.
What would settle it
A replication on an independent financial series or with different backbones where the backbone CRPS spread exceeds the head spread would falsify the head-dominance result.
Figures
read the original abstract
In a deep forecasting pipeline for fat-tailed financial returns at short horizons, which matters more - the backbone architecture or the output head? We compare four modern backbones (TimesNet, DLinear, N-BEATS, iTransformer) under three output heads: a point head, a single-Gaussian density head, and a Gaussian mixture density head with K=4 components. On S and P 500 monthly log-returns (1871-2023) under anchored walk-forward validation, the three heads form a strict gradient: switching from point to Gaussian improves CRPS by about 1.3 percent; switching from Gaussian to mixture adds a further about 2.4 percent. Switching between backbones, in contrast, changes CRPS by less than 1.5 percent on the point-head row and on the backbone-mean axis; density-head backbone spread is larger (up to 5.1 percent on the h=1 Gaussian row, driven by N-BEATS) but the head gradient (3.7 percentage points) still dominates. The Model Confidence Set on squared errors does not exclude any of the 12 variants at the 5 percent level: the head separates them only on distributional metrics (CRPS, pinball, coverage), not on squared error. The mixture head incremental value over a single Gaussian is largest in the highest-volatility regimes (13.9 percent in 1970s stagflation at h=12), confirming the mixture captures tail risk beyond what a unimodal Gaussian can express. The picture is horizon-dependent: the head dominates at short horizons, but at long horizons (h >= 6) the backbone re-takes the lead - an h-split we document against classical baselines (section 5.1). We conclude that on fat-tailed returns at short horizons, the head dominates the backbone, and the mixture distribution adds genuine value over a single Gaussian during crisis periods when risk-management decisions actually matter.
Editorial analysis
A structured set of objections, weighed in public.
Referee Report
Summary. The manuscript empirically compares four backbones (TimesNet, DLinear, N-BEATS, iTransformer) paired with three output heads (point, single-Gaussian, K=4 Gaussian mixture) for forecasting S&P 500 monthly log-returns (1871-2023) under anchored walk-forward validation. It reports a strict head gradient on CRPS (~1.3pp from point to Gaussian, +2.4pp to mixture) that exceeds backbone spread (<1.5pp on point-head row), with mixture gains largest in high-vol regimes, while backbones dominate at longer horizons (h>=6); the MCS excludes no model on squared error but separates variants on distributional metrics.
Significance. If robust, the result would indicate that for short-horizon density forecasting of fat-tailed returns, output-head design (particularly mixtures for tails) matters more than backbone choice, with potential implications for risk-management pipelines. The anchored walk-forward protocol on a long sample and the use of MCS plus regime splits provide concrete, falsifiable metrics.
major comments (4)
- [Abstract] Abstract / experimental setup: the headline claim that 'the head dominates the backbone' on fat-tailed returns is presented as a general property, yet all evidence is from a single series (S&P 500); this single-dataset limitation is load-bearing for generalization and requires either cross-market replication or explicit scope restrictions.
- [Abstract] Abstract: no information is given on the hyperparameter search protocol, the statistical significance of the reported head gradient (3.7pp), or sensitivity of results to the fixed choice K=4; these omissions directly affect assessment of whether the head dominance is robust.
- [section 5.1] section 5.1: the horizon-dependent reversal (head at short h, backbone at h>=6) and the regime-specific gains (13.9% in 1970s stagflation) are documented post-hoc without pre-specified criteria or multiple-testing adjustment, weakening the claim that the mixture 'adds genuine value ... during crisis periods'.
- [Abstract] MCS result (Abstract): while the paper correctly notes that MCS does not exclude any variant on squared error, the separation on CRPS/pinball is used to support 'heads dominate'; this metric-specific separation needs explicit discussion of whether it suffices for the architecture recommendation when point-forecast performance is statistically equivalent.
minor comments (2)
- [Abstract] Abstract contains the typo 'S and P 500' (should read 'S&P 500').
- [section 5.1] The abstract refers to 'classical baselines' in section 5.1 without naming them; adding the names would improve clarity.
Simulated Author's Rebuttal
We thank the referee for the constructive and detailed comments. Below we respond point-by-point to the major comments, indicating the revisions we will make.
read point-by-point responses
-
Referee: [Abstract] Abstract / experimental setup: the headline claim that 'the head dominates the backbone' on fat-tailed returns is presented as a general property, yet all evidence is from a single series (S&P 500); this single-dataset limitation is load-bearing for generalization and requires either cross-market replication or explicit scope restrictions.
Authors: We agree that the single-series design limits generalization. We will revise the abstract and introduction to explicitly restrict all claims to S&P 500 monthly log-returns (1871-2023) and state that extension to other assets or markets is left for future work. This implements the scope-restriction option suggested by the referee. revision: partial
-
Referee: [Abstract] Abstract: no information is given on the hyperparameter search protocol, the statistical significance of the reported head gradient (3.7pp), or sensitivity of results to the fixed choice K=4; these omissions directly affect assessment of whether the head dominance is robust.
Authors: We will add a new subsection in the experimental setup describing the hyperparameter search protocol (grid/random search ranges, validation procedure). We will also report bootstrap or Diebold-Mariano tests for the CRPS differences that constitute the head gradient. Finally, we will include a sensitivity table or figure for K=2, K=4, and K=8 in the supplement and discuss the rationale for the primary choice of K=4. revision: yes
-
Referee: [section 5.1] section 5.1: the horizon-dependent reversal (head at short h, backbone at h>=6) and the regime-specific gains (13.9% in 1970s stagflation) are documented post-hoc without pre-specified criteria or multiple-testing adjustment, weakening the claim that the mixture 'adds genuine value ... during crisis periods'.
Authors: We accept the criticism that these splits and regime comparisons are post-hoc. In the revision we will (i) label the horizon split and regime analysis as exploratory, (ii) remove language implying pre-specification, and (iii) add an explicit limitations paragraph noting the lack of multiple-testing correction. The claim about mixture value in crisis periods will be rephrased to reflect the exploratory nature of the evidence. revision: yes
-
Referee: [Abstract] MCS result (Abstract): while the paper correctly notes that MCS does not exclude any variant on squared error, the separation on CRPS/pinball is used to support 'heads dominate'; this metric-specific separation needs explicit discussion of whether it suffices for the architecture recommendation when point-forecast performance is statistically equivalent.
Authors: We will expand the abstract, results, and conclusion sections to explicitly discuss the MCS outcome. We will state that the models are statistically equivalent on squared-error point forecasts, yet separate on proper scoring rules for densities, and clarify that the architecture recommendation is intended for settings where distributional accuracy (risk management, tail risk) matters more than point accuracy alone. revision: yes
Circularity Check
No circularity: purely empirical architecture comparison on fixed dataset
full rationale
The paper reports results from training and evaluating 12 model variants (4 backbones × 3 heads) on monthly S&P 500 log-returns under anchored walk-forward validation. All performance numbers (CRPS gradients, MCS tests, regime-specific improvements) are direct empirical outputs; no equations, uniqueness theorems, or predictions are claimed to derive from prior results by construction. No self-citations appear in the provided text, and the central claim is framed as an observation on this specific series rather than a general derivation.
Axiom & Free-Parameter Ledger
free parameters (1)
- K=4
Reference graph
Works this paper leans on
-
[1]
Tim Bollerslev. 1986. Generalized Autoregressive Conditional Heteroskedasticity. Journal of Econometrics31, 3 (1986), 307–327
1986
-
[2]
Campbell and Robert J
John Y. Campbell and Robert J. Shiller. 1988. Stock Prices, Earnings, and Expected Dividends.The Journal of Finance43, 3 (1988), 661–676
1988
-
[3]
Campbell and Samuel B
John Y. Campbell and Samuel B. Thompson. 2008. Predicting Excess Stock Returns Out of Sample: Can Anything Beat the Historical Average?Review of Financial Studies21, 4 (2008), 1509–1531
2008
-
[4]
Christoffersen
Peter F. Christoffersen. 1998. Evaluating Interval Forecasts.International Eco- nomic Review39, 4 (1998), 841–862
1998
-
[5]
Rama Cont. 2001. Empirical Properties of Asset Returns: Stylized Facts and Statistical Issues.Quantitative Finance1, 2 (2001), 223–236
2001
-
[6]
Creal, Siem Jan Koopman, and André Lucas
Drew D. Creal, Siem Jan Koopman, and André Lucas. 2013. Generalized Autore- gressive Score Models with Applications.Journal of Applied Econometrics28, 5 (2013), 777–795
2013
-
[7]
Diebold and Roberto S
Francis X. Diebold and Roberto S. Mariano. 1995. Comparing Predictive Accuracy. Journal of Business & Economic Statistics13, 3 (1995), 253–263
1995
-
[8]
Robert F. Engle. 1982. Autoregressive Conditional Heteroscedasticity with Esti- mates of the Variance of United Kingdom Inflation.Econometrica50, 4 (1982), 987–1007
1982
-
[9]
Engle and Simone Manganelli
Robert F. Engle and Simone Manganelli. 2004. CAViaR: Conditional Autore- gressive Value at Risk by Regression Quantiles.Journal of Business & Economic Statistics22, 4 (2004), 367–381
2004
-
[10]
Glosten, Ravi Jagannathan, and David E
Lawrence R. Glosten, Ravi Jagannathan, and David E. Runkle. 1993. On the Relation between the Expected Value and the Volatility of the Nominal Excess Return on Stocks.Journal of Finance48, 5 (1993), 1779–1801
1993
-
[11]
Tilmann Gneiting and Adrian E. Raftery. 2007. Strictly Proper Scoring Rules, Prediction, and Estimation.J. Amer. Statist. Assoc.102, 477 (2007), 359–378
2007
-
[12]
Hansen, Asger Lunde, and James M
Peter R. Hansen, Asger Lunde, and James M. Nason. 2011. The Model Confidence Set.Econometrica79, 2 (2011), 453–497
2011
-
[13]
Peter J. Huber. 1964. Robust Estimation of a Location Parameter.The Annals of Mathematical Statistics35, 1 (1964), 73–101
1964
-
[14]
Hyndman and George Athanasopoulos
Rob J. Hyndman and George Athanasopoulos. 2018.Forecasting: Principles and Practice(3rd ed.). OTexts, Melbourne, Australia
2018
-
[15]
Roger Koenker and Gilbert Bassett. 1978. Regression Quantiles.Econometrica46, 1 (1978), 33–50
1978
-
[16]
Paul Kupiec. 1995. Techniques for Verifying the Accuracy of Risk Management Models.Journal of Derivatives3, 2 (1995), 73–84
1995
-
[17]
Yong Liu, Tengge Hu, Haoran Zhang, Haixu Wu, Shiyu Wang, Lintao Ma, and Mingsheng Long. 2024. iTransformer: Inverted Transformers Are Effective for Time Series Forecasting. InInternational Conference on Learning Representations (ICLR). Spotlight
2024
-
[18]
Lo and A
Andrew W. Lo and A. Craig MacKinlay. 1990. When Are Contrarian Profits Due to Stock Market Overreaction?Review of Financial Studies3, 2 (1990), 175–205
1990
-
[19]
Daniel B. Nelson. 1991. Conditional Heteroskedasticity in Asset Returns: A New Approach.Econometrica59, 2 (1991), 347–370
1991
-
[20]
Nguyen, Phanwadee Sinthong, and Jayant Kalagnanam
Yuqi Nie, Nam H. Nguyen, Phanwadee Sinthong, and Jayant Kalagnanam. 2023. A Time Series is Worth 64 Words: Long-term Forecasting with Transformers. In International Conference on Learning Representations (ICLR)
2023
-
[21]
2019.Minimum Capital Requirements for Market Risk
Basel Committee on Banking Supervision. 2019.Minimum Capital Requirements for Market Risk. Technical Report. Bank for International Settlements. Available at https://www.bis.org/bcbs/publ/d457.pdf. Heads, Not Backbones: Output Heads Dominate Architectures on Fat-Tailed Returns
2019
-
[22]
Oreshkin, Dmitri Carpov, Nicolas Chapados, and Yoshua Bengio
Boris N. Oreshkin, Dmitri Carpov, Nicolas Chapados, and Yoshua Bengio. 2020. N-BEATS: Neural Basis Expansion Analysis for Interpretable Time Series Fore- casting. InInternational Conference on Learning Representations (ICLR)
2020
-
[23]
Adam Paszke, Sam Gross, Francisco Massa, Adam Lerer, James Bradbury, Gre- gory Chanan, Trevor Killeen, Zeming Lin, Natalia Gimelshein, Luca Antiga, Alban Desmaison, Andreas Kopf, Edward Yang, Zachary DeVito, Martin Rai- son, Alykhan Tejani, Sasank Chilamkurthy, Benoit Steiner, Lu Fang, Junjie Bai, and Soumith Chintala. 2019. PyTorch: An Imperative Style, ...
2019
-
[24]
Gideon Schwarz. 1978. Estimating the Dimension of a Model.The Annals of Statistics6, 2 (1978), 461–464
1978
-
[25]
Leonard J. Tashman. 2000. Out-of-Sample Tests of Forecasting Accuracy: An Analysis and Review.International Journal of Forecasting16, 4 (2000), 437–450
2000
-
[26]
Haixu Wu, Tengge Hu, Yong Liu, Hang Zhou, Jianmin Wang, and Mingsheng Long. 2023. TimesNet: Temporal 2D-Variation Modeling for General Time Series Analysis. InInternational Conference on Learning Representations (ICLR)
2023
-
[27]
ARIMA beats TimesNetpoint at every horizon
Ailing Zeng, Minghao Chen, Lei Zhang, and Qiang Xu. 2023. Are Transformers Effective for Time Series Forecasting?. InAAAI Conference on Artificial Intelli- gence. A Per-regime stress test detail Table 6 reports the per-regime CRPS-Skill-Score forTimesNet point, TimesNetgauss, andTimesNet gmm over each named crisis period. The mixture’s incremental value (...
2023
discussion (0)
Sign in with ORCID, Apple, or X to comment. Anyone can read and Pith papers without signing in.