REVIEW 4 major objections 5 minor 83 references
Advancing Marine Heatwave Forecasts: An Integrated Deep Learning Approach
T0 review · 4 major / 5 minor · reviewed 2026-08-12 · deepseek-v4-flash
Pith's one-line read An integrated deep-learning framework combining graph representation, imbalanced regression, and temporal diffusion can forecast marine heatwaves up to six months ahead and outperform numerical models in several ocean regions.
desk verdict Test-set early stopping bakes the headline scores, so the six-month claim is unreliable; the framework and dataset are still worth a re-run. read the letter →
The pith
A machine-rendered reading of the paper's core claim, the machinery that carries it, and where it could break.
The reading
What carries the argument
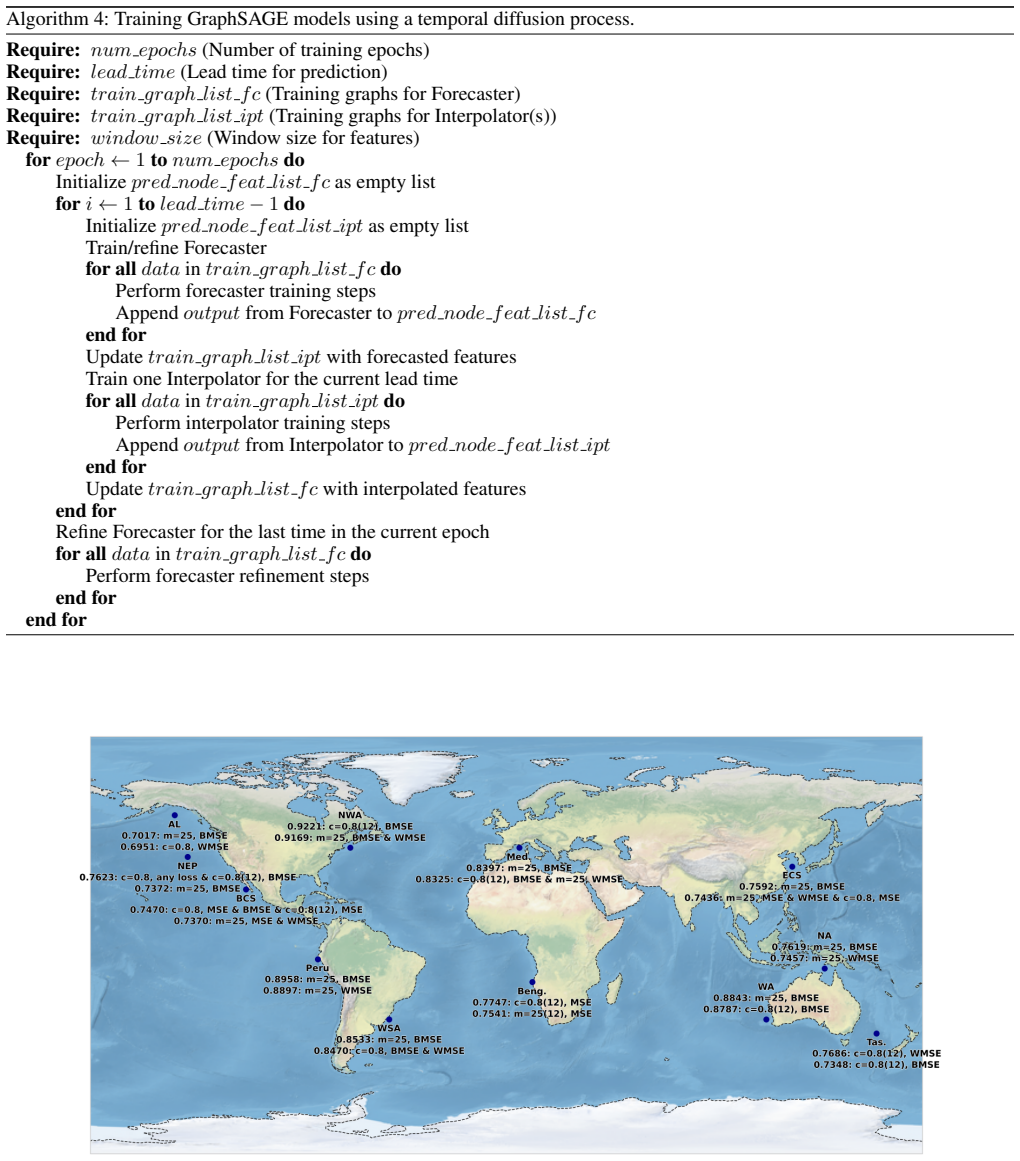
The central object is a graph whose nodes are grid locations and whose edges keep the top $m$ Kendall rank correlations between each location's sea surface temperature anomaly time series; ranking the correlations instead of thresholding them guarantees every node has at least $m$ edges and eliminates isolated nodes. The predictor is a two-layer GraphSAGE network (with mean, pooling, or LSTM aggregation) trained by standard MSE, balanced MSE, or a custom weighted MSE that up-weights errors above the 90th percentile. For long leads, the paper adapts temporal diffusion: a forecaster predicts the target month, interpolator networks reconstruct intermediate months, and the forecaster is then refined using the interpolated fields, so that the model can advance one step at a time without a long input window.
What would settle it
Re-run the same experiments on the same ERA5-derived data with the $m=25$ graph, the same losses, and the same diffusion procedure, but choose all hyperparameters and the early-stopping epoch using a validation period disjoint from the test period (for example, validate on 2000–2012 and test on 2013–2022). If the one-month SEDI falls below roughly 0.6 or the six-month critical success index drops to zero, the paper's claimed skill and its comparison with numerical models would not stand.
Extended reading notes
Core claim
The paper's central claim is that a graph neural network (GraphSAGE) trained on rank-correlation graphs of monthly sea surface temperature anomalies, with balanced or weighted mean-squared-error losses and temporal diffusion, produces marine heatwave forecasts whose average symmetric extremal dependence index (SEDI) is about 0.68 at one-month leads and remains above chance at six-month leads (SEDI around 0.14, CSI around 0.14 when a single input time step is used). Spatially, the model shares the strongest skill regions with numerical models—equatorial Pacific, northwest Pacific near North America, south Pacific near South America, and equatorial Atlantic near South America—but additionally shows higher SEDI than the numerical ensemble in the middle south Pacific, equatorial Atlantic near Africa, south Atlantic, and high-latitude Indian Ocean. The authors further claim that temporal diffusion makes a conventional 12-month sliding window unnecessary, reducing input requirements while improving the critical success index for long leads.
Load-bearing premise
The reported skill depends on treating the test set as untouched: the paper says 'the model configuration with the largest overall SEDI over the test data was saved,' meaning the test data guided model selection; if that guidance is not honest, the headline SEDI values and the six-month skill claim are inflated.
Editorial extensions
If this is right
- A purely data-driven model can match or beat dynamical model skill in specific ocean regions at three-to-four-month leads, suggesting machine learning is a viable alternative for global marine heatwave outlooks.
- Temporal diffusion plus a single time step input produces similar or better long-lead skill than the conventional 12-month sliding window, cutting input data requirements.
- Imbalanced regression losses (BMSE and WMSE) improve detection of marine heatwave events at the cost of some precision, giving a useful lever for forecast users who prioritize recall.
- The minimum-degree graph construction removes isolated nodes and yields a reusable public SSTA graph dataset for other climate forecasting problems.
- Skill degrades with lead time and is marginal at six months; forecasts beyond six months are not usable, so the practical horizon of this system is about half a year.
Reading between the lines
- If the six-month skill survives a clean validation protocol, a global data-driven early-warning system could run on a single GPU in minutes, making seasonal marine heatwave outlooks accessible to regions without operational dynamical forecast centers.
- The guarantee that every node has at least $m$ edges is likely transferable to other gridded geophysical prediction tasks where correlation-based graphs with fixed thresholds suffer from isolated nodes.
- Because the reported models were selected using the test data's SEDI as the early-stopping criterion, the numerical-model comparison should be re-run with a held-out validation set before operational use; that re-run is a direct test the paper leaves implicit.
Signed reviews
Editorial analysis
A structured set of objections, weighed in public.
Referee Report
Summary. The paper presents a global monthly marine heatwave (MHW) forecasting framework that combines GraphSAGE graph representation with imbalanced regression losses (BMSE, WMSE) and a temporal-diffusion training process. The authors introduce a sorted Kendall-correlation graph construction that guarantees no isolated nodes, release a new public SSTA graph dataset, and evaluate one- to six-month-ahead forecasts using precision, recall, CSI, and SEDI, comparing qualitatively with the numerical-model forecasts of Jacox et al. (2022). The central claims are that the integrated DL approach outperforms numerical models in several ocean regions and that temporal diffusion enables useful forecasts up to six months ahead.
Significance. If the evaluation were unbiased, the paper would make a useful contribution: a novel graph-construction method, a public dataset, and a comparison of imbalanced losses and diffusion for a high-impact climate extreme. The framework is original in combining these three threads, and the authors provide code and data for reproducibility. However, the quantitative evidence for these claims is currently undermined by the test-set-based early stopping and by internal inconsistencies in the long-lead results, so the significance cannot be assessed from the reported numbers.
major comments (4)
- [Appendix: Experiment Details] The early stopping protocol selects the model checkpoint with the largest SEDI on the test data: 'After each training epoch, the model configuration with the largest overall SEDI over the test data was saved.' Because the same test data (2010-2022, 156 months) is then used for all reported SEDI/CSI values in Tables 2-4 and Figure 2, the scores are selection maxima over up to 200 training epochs rather than unbiased estimates of generalization. With rare-event metrics and patience 40, this can substantially inflate skill, so the comparison with Jacox et al. (2022) and the six-month claim are not supported. A separate validation split must be used for early stopping and hyperparameter selection, with the test set used only once for final evaluation.
- [Experiments: Prediction for Longer Terms (vs. Abstract)] The abstract claims 'achieving improved prediction up to six months in advance,' but the body states that six-month-ahead forecasts had average SEDIs around 0.14 and average CSIs 'almost zero, implying the unpredictability for six-month-ahead MHW forecasts so far.' This is a direct contradiction. The abstract should be revised to match the actual results, and the authors should clarify what 'improved prediction' means when the CSI is near zero.
- [Methodology: Imbalanced loss functions] The loss hyperparameters alpha=2, w=2, and sigma=0.02 are stated to be selected via a Friedman test in 'earlier experiments (not included in this manuscript).' This makes the loss-function comparison non-reproducible and the claim of 'optimized' losses unverifiable. The evidence for these choices should be included in the paper or the hyperparameters should be treated as exploratory, with a sensitivity analysis reported.
- [Experiments: Prediction for Longer Terms, Tables 3 and 4] The evidence that temporal diffusion improves long-lead forecasts is mixed and often within one standard deviation. For example, in Table 3 at lead 6, the mean CSI with diffusion (0.0102) is lower than without (0.0424), while in Table 4 at lead 6 diffusion increases CSI (0.14 vs 0.091) but decreases SEDI (0.1555 vs 0.1681). The claim that diffusion 'achieves improved prediction up to six months' is therefore not clearly supported by the reported metrics. The authors should provide a consistent, statistically grounded comparison (e.g., confidence intervals or significance tests) and temper the conclusion accordingly.
minor comments (5)
- [Author line] The second author's name appears as 'Varvara V etrova' with a stray space; it should be 'Varvara Vetrova.'
- [Algorithm 1] In Algorithm 1, line 10 uses the variable tau_ij in 'sort(correlations, by -|tau_ij|)' without defining it in the pseudocode; tau_ij should be defined as the Kendall rank correlation coefficient computed in line 7.
- [Equation (3)] The SEDI formula is written as a single fraction without parentheses around the numerator and denominator; adding parentheses would remove ambiguity about the order of operations.
- [Figure 2 caption] The caption states 'All used them = 25graph construction method,' which has a missing space and should read 'the m = 25 graph construction method.'
- [Appendix: Additional Experiment Results] The 12 hotspot locations are identified only by abbreviations in the appendix; providing coordinates or a reference map in the main text would improve reproducibility.
Circularity Check
Reported test SEDI is inflated: the Appendix states the model configuration with the largest SEDI over the test data was saved, so the headline skill values are selection maxima on the same data used for evaluation.
-
fitted input called prediction
[Appendix, Experiment Details (early-stopping protocol)]
"In our preliminary experiments ... we used the SEDI as the metric to control early stopping. After each training epoch, the model configuration with the largest overall SEDI over the test data was saved and the training process continued for the number of epochs equal to the patience, until the next configuration with the largest test SEDI was found."
The model checkpoint is selected by maximizing SEDI computed on the test data, and the same test data then supplies every reported SEDI/CSI value (Tables 2-4 and 17; Figures 2-3) used for the central claims: regional superiority over the Jacox et al. (2022) numerical ensemble, diffusion advantages, and skill up to six months. With patience 40 and up to 200 epochs, each reported test SEDI is (approximately) the maximum over epochs of that same test SEDI, a selection maximum rather than an unbiased held-out estimate, and no separate validation split is reported. The reported skill values are therefore statistically forced upward by the selection procedure, so the 'predictions' partially reduce by construction to the quantity being reported.
full rationale
The paper is an empirical ML study whose derivation chain is mostly self-contained: the graph-construction method, imbalanced losses, and temporal-diffusion adaptation are stated as design choices, and the comparisons use external benchmarks (Cachay et al. 2023; Jacox et al. 2022). Citations to the authors' own Ning et al. (2024) are method adaptations (graph construction, preprocessing, hotspot list) rather than load-bearing 'uniqueness' arguments, and no result is forced by a self-citation chain. The one genuine circular pattern is the early-stopping protocol in the Appendix: 'the model configuration with the largest overall SEDI over the test data was saved,' with the body confirming 'The SEDI was the primary metric used to control early stops during model training.' Because the same test data is used for all reported evaluation, the central quantitative claims rest on test-selected maxima and are partially fitted to the evaluation metric. The manuscript itself concedes that six-month-ahead CSIs are 'almost zero,' contradicting the abstract's six-month claim; that self-asserted limitation tempers the headline but does not change this assessment, which is driven by the test-data checkpoint selection. A score of 6 rather than higher reflects that network weights are still trained only on the training split, so the circularity is partial rather than total.
Assumptions & free parameters
free parameters (5)
- m (minimum edges per node in graph) =
25 or 50
- alpha (WMSE exponent) =
2
- w (WMSE MHW weight) =
2
- sigma (BMSE noise level) =
0.02
- Window size =
12 (default)
assumptions (4)
- domain assumption MHWs are defined as SSTA exceeding the 90th percentile of the monthly climatology (Hobday et al. 2016).
- domain assumption ERA5 reanalysis SSTAs are treated as ground truth.
- domain assumption Kendall rank correlation between node SSTA time series captures meaningful spatial dependencies for forecasting.
- domain assumption DYffusion-style temporal diffusion training transfers to GraphSAGE on monthly SSTA data.
Cite this review
Pith. "Pith review of Advancing Marine Heatwave Forecasts: An Integrated Deep Learning Approach." pith.science (2026). https://pith.science/paper/WAUWXMIA
@misc{pith2026241204475,
  author       = {Pith},
  title        = {Pith review of: Advancing Marine Heatwave Forecasts: An Integrated Deep Learning Approach},
  year         = {2026},
  howpublished = {\url{https://pith.science/paper/WAUWXMIA}},
  note         = {Machine review of arXiv:2412.04475}
}
read the original abstract
Marine heatwaves (MHWs), an extreme climate phenomenon, pose significant challenges to marine ecosystems and industries, with their frequency and intensity increasing due to climate change. This study introduces an integrated deep learning approach to forecast short-to-long-term MHWs on a global scale. The approach combines graph representation for modeling spatial properties in climate data, imbalanced regression to handle skewed data distributions, and temporal diffusion to enhance forecast accuracy across various lead times. To the best of our knowledge, this is the first study that synthesizes three spatiotemporal anomaly methodologies to predict MHWs. Additionally, we introduce a method for constructing graphs that avoids isolated nodes and provide a new publicly available sea surface temperature anomaly graph dataset. We examine the trade-offs in the selection of loss functions and evaluation metrics for MHWs. We analyze spatial patterns in global MHW predictability by focusing on historical hotspots, and our approach demonstrates better performance compared to traditional numerical models in regions such as the middle south Pacific, equatorial Atlantic near Africa, south Atlantic, and high-latitude Indian Ocean. We highlight the potential of temporal diffusion to replace the conventional sliding window approach for long-term forecasts, achieving improved prediction up to six months in advance. These insights not only establish benchmarks for machine learning applications in MHW forecasting but also enhance understanding of general climate forecasting methodologies.
Figures


Reference graph
Works this paper leans on
-
[1]
M., Chin, T
Banzon, V., Smith, T. M., Chin, T. M., Liu, C., and Hankins, W. A long-term record of blended satellite and in situ sea-surface temperature for climate monitoring, modeling and environmental studies. Earth System Science Data, 8 0 (1): 0 165--176, 2016
2016
-
[2]
R., Hobday, A
Boschetti, F., Feng, M., Hartog, J. R., Hobday, A. J., and Zhang, X. Sea surface temperature predictability at the interface between oceanographic modelling and machine learning. 2022
2022
-
[3]
Branco, P., Torgo, L., and Ribeiro, R. P. Smogn: a pre-processing approach for imbalanced regression. In First International Workshop on Learning with Imbalanced Domains: Theory and Applications, pp.\ 36--50. PMLR, 2017
2017
-
[5]
R., Zhao, B., James, H., and Yu, R
Cachay, S. R., Zhao, B., James, H., and Yu, R. Dyffusion: A dynamics-informed diffusion model for spatiotemporal forecasting. arXiv preprint arXiv:2306.01984, 2023
arXiv 2023
-
[6]
Croitoru, F.-A., Hondru, V., Ionescu, R. T., and Shah, M. Diffusion models in vision: A survey. IEEE Transactions on Pattern Analysis and Machine Intelligence, 2023
work page 2023
-
[8]
Structure and content-guided video synthesis with diffusion models
Esser, P., Chiu, J., Atighehchian, P., Granskog, J., and Germanidis, A. Structure and content-guided video synthesis with diffusion models. In Proceedings of the IEEE/CVF International Conference on Computer Vision, pp.\ 7346--7356, 2023
2023
-
[9]
R., Akhtar, M., Shi, L., Luo, J.-J., and Hobday, A
Feng, M., Boschetti, F., Ling, F., Zhang, X., Hartog, J. R., Akhtar, M., Shi, L., Luo, J.-J., and Hobday, A. J. Predictability of sea surface temperature anomalies at the eastern pole of the indian ocean dipole-using a convolutional neural network model. Frontiers in Climate, pp.\ 143, 2022
work page 2022
-
[10]
Ferro, C. A. and Stephenson, D. B. Extremal dependence indices: Improved verification measures for deterministic forecasts of rare binary events. Weather and Forecasting, 26 0 (5): 0 699--713, 2011
work page 2011
Show all 83 references
-
[12]
Deep learning for multi-year enso forecasts
Ham, Y.-G., Kim, J.-H., and Luo, J.-J. Deep learning for multi-year enso forecasts. Nature, 573 0 (7775): 0 568--572, 2019
2019
-
[13]
Unified deep learning model for el ni \ n o/southern oscillation forecasts by incorporating seasonality in climate data
Ham, Y.-G., Kim, J.-H., Kim, E.-S., and On, K.-W. Unified deep learning model for el ni \ n o/southern oscillation forecasts by incorporating seasonality in climate data. Science Bulletin, 66 0 (13): 0 1358--1366, 2021
2021
-
[14]
Inductive representation learning on large graphs
Hamilton, W., Ying, Z., and Leskovec, J. Inductive representation learning on large graphs. In Proceedings of the 30th Advances in Neural Information Processing Systems, 2017
2017
-
[15]
The ERA5 global reanalysis
Hersbach, H., Bell, B., Berrisford, P., Hirahara, S., Hor \'a nyi, A., Mu \ n oz-Sabater, J., Nicolas, J., Peubey, C., Radu, R., Schepers, D., et al. The ERA5 global reanalysis. Quarterly Journal of the Royal Meteorological Society, 146 0 (730): 0 1999--2049, 2020
1999
-
[17]
J., Alexander, L
Hobday, A. J., Alexander, L. V., Perkins, S. E., Smale, D. A., Straub, S. C., Oliver, E. C., Benthuysen, J. A., Burrows, M. T., Donat, M. G., Feng, M., et al. A hierarchical approach to defining marine heatwaves. Progress in Oceanography, 141: 0 227--238, 2016
2016
-
[18]
J., Spillman, C
Hobday, A. J., Spillman, C. M., Eveson, J. P., Hartog, J. R., Zhang, X., and Brodie, S. A framework for combining seasonal forecasts and climate projections to aid risk management for fisheries and aquaculture. Frontiers in Marine Science, pp.\ 137, 2018
2018
-
[19]
J., Sen Gupta, A., Oliver, E
Holbrook, N. J., Sen Gupta, A., Oliver, E. C., Hobday, A. J., Benthuysen, J. A., Scannell, H. A., Smale, D. A., and Wernberg, T. Keeping pace with marine heatwaves. Nature Reviews Earth & Environment, 1 0 (9): 0 482--493, 2020
2020
-
[21]
G., Tommasi, D., Alexander, M
Jacox, M. G., Tommasi, D., Alexander, M. A., Hervieux, G., and Stock, C. A. Predicting the evolution of the 2014--2016 California current system marine heatwave from an ensemble of coupled global climate forecasts. Frontiers in Marine Science, 6: 0 497, 2019
2014
-
[22]
G., Alexander, M
Jacox, M. G., Alexander, M. A., Amaya, D., Becker, E., Bograd, S. J., Brodie, S., Hazen, E. L., Pozo Buil, M., and Tommasi, D. Global seasonal forecasts of marine heatwaves. Nature, 604 0 (7906): 0 486--490, 2022
2022
-
[23]
Understanding the effective receptive field in deep convolutional neural networks
Luo, W., Li, Y., Urtasun, R., and Zemel, R. Understanding the effective receptive field in deep convolutional neural networks. Advances in neural information processing systems, 29, 2016
2016
-
[24]
J., Lee, W.-S., Boer, G
Merryfield, W. J., Lee, W.-S., Boer, G. J., Kharin, V. V., Scinocca, J. F., Flato, G. M., Ajayamohan, R., Fyfe, J. C., Tang, Y., and Polavarapu, S. The canadian seasonal to interannual prediction system. part i: Models and initialization. Monthly weather review, 141 0 (8): 0 2...
2013
-
[25]
R., and Koh, Y
Ning, D., Vetrova, V., Bryan, K. R., and Koh, Y. S. Harnessing the power of graph representation in climate forecasting: Predicting global monthly mean sea surface temperatures and anomalies. Advances in Machine Learning for Earth Science: Observation, Modeling, and Applicatio...
2024
-
[26]
C., Burrows, M
Oliver, E. C., Burrows, M. T., Donat, M. G., Sen Gupta, A., Alexander, L. V., Perkins-Kirkpatrick, S. E., Benthuysen, J. A., Hobday, A. J., Holbrook, N. J., Moore, P. J., et al. Projected marine heatwaves in the 21st century and the potential for ecological impact. Frontiers i...
2019
-
[27]
C., Benthuysen, J
Oliver, E. C., Benthuysen, J. A., Darmaraki, S., Donat, M. G., Hobday, A. J., Holbrook, N. J., Schlegel, R. W., and Sen Gupta, A. Marine heatwaves. Annual Review of Marine Science, 13: 0 313--342, 2021
2021
-
[28]
PyTorch : An imperative style, high-performance deep learning library
Paszke, A., Gross, S., Massa, F., Lerer, A., Bradbury, J., Chanan, G., Killeen, T., Lin, Z., Gimelshein, N., Antiga, L., et al. PyTorch : An imperative style, high-performance deep learning library. Advances in neural information processing systems, 32, 2019
2019
-
[29]
S., Vasavi, S., and Vighneshwar, S
Pravallika, M. S., Vasavi, S., and Vighneshwar, S. Prediction of temperature anomaly in indian ocean based on autoregressive long short-term memory neural network. Neural Computing and Applications, 34 0 (10): 0 7537--7545, 2022
2022
-
[30]
Ratnam, J., Dijkstra, H., and Behera, S. K. A machine learning based prediction system for the indian ocean dipole. Scientific reports, 10 0 (1): 0 1--11, 2020
2020
-
[31]
Balanced mse for imbalanced visual regression
Ren, J., Zhang, M., Yu, C., and Liu, Z. Balanced mse for imbalanced visual regression. arXiv preprint arXiv:2203.16427, 2022
2022 arXiv
-
[32]
W., Smith, T
Reynolds, R. W., Smith, T. M., Liu, C., Chelton, D. B., Casey, K. S., and Schlax, M. G. Daily high-resolution-blended analyses for sea surface temperature. Journal of climate, 20 0 (22): 0 5473--5496, 2007
2007
-
[33]
The ncep climate forecast system version 2
Saha, S., Moorthi, S., Wu, X., Wang, J., Nadiga, S., Tripp, P., Behringer, D., Hou, Y.-T., Chuang, H.-y., Iredell, M., et al. The ncep climate forecast system version 2. Journal of climate, 27 0 (6): 0 2185--2208, 2014
2014
-
[34]
Schaefer, J. T. The critical success index as an indicator of warning skill. Weather and forecasting, 5 0 (4): 0 570--575, 1990
1990
-
[35]
and Feng, M
Taylor, J. and Feng, M. A deep learning model for forecasting global monthly mean sea surface temperature anomalies. Frontiers in Climate, 4: 0 178, 2022
2022
-
[37]
P., Pfahringer, B., and Branco, P
Torgo, L., Ribeiro, R. P., Pfahringer, B., and Branco, P. SMOTE for regression. In Proceedings of the Portuguese Conference on Artificial Intelligence, pp.\ 378--389. Springer, 2013
2013
-
[38]
A., Swanson, K
Tsonis, A. A., Swanson, K. L., and Roebber, P. J. What do networks have to do with climate? Bulletin of the American Meteorological Society, 87 0 (5): 0 585--596, 2006
2006
-
[39]
A., Delworth, T., Gudgel, R., Kapnick, S., Rosati, A., Wittenberg, A
Vecchi, G. A., Delworth, T., Gudgel, R., Kapnick, S., Rosati, A., Wittenberg, A. T., Zeng, F., Anderson, W., Balaji, V., Dixon, K., et al. On the seasonal forecasting of regional tropical cyclone activity. Journal of Climate, 27 0 (21): 0 7994--8016, 2014
2014
-
[41]
and Tang, Y
Wu, Y. and Tang, Y. Seasonal predictability of the tropical indian ocean sst in the north american multimodel ensemble. Climate Dynamics, 53 0 (5): 0 3361--3372, 2019
2019
-
[42]
Diffusion probabilistic modeling for video generation
Yang, R., Srivastava, P., and Mandt, S. Diffusion probabilistic modeling for video generation. Entropy, 25 0 (10): 0 1469, 2023
2023
-
[43]
Delving into deep imbalanced regression
Yang, Y., Zha, K., Chen, Y., Wang, H., and Katabi, D. Delving into deep imbalanced regression. In Proceedings of the 38th International Conference on Machine Learning, pp.\ 11842--11851. PMLR, 2021
2021
-
[44]
, " * write output.state after.block = add.period write newline
ENTRY address archivePrefix author booktitle chapter edition editor eid eprint howpublished institution isbn journal key month note number organization pages publisher school series title type volume year label extra.label sort.label short.list INTEGERS output.state before.all...
-
[45]
write newline
" write newline "" before.all 'output.state := FUNCTION n.dashify 't := "" t empty not t #1 #1 substring "-" = t #1 #2 substring "--" = not "--" * t #2 global.max substring 't := t #1 #1 substring "-" = "-" * t #2 global.max substring 't := while if t #1 #1 substring * t #2 gl...
-
[46]
M.; Chin, T
Banzon, V.; Smith, T. M.; Chin, T. M.; Liu, C.; and Hankins, W. 2016. A long-term record of blended satellite and in situ sea-surface temperature for climate monitoring, modeling and environmental studies. Earth System Science Data, 8(1): 165--176
2016
-
[47]
R.; Hobday, A
Boschetti, F.; Feng, M.; Hartog, J. R.; Hobday, A. J.; and Zhang, X. 2022. Sea surface temperature predictability at the interface between oceanographic modelling and machine learning
2022
-
[48]
Branco, P.; Torgo, L.; and Ribeiro, R. P. 2017. SMOGN: A pre-processing approach for imbalanced regression. In First International Workshop on Learning with Imbalanced Domains: Theory and Applications, 36--50. PMLR
2017
-
[49]
R.; Erickson, E.; Bucker, A
Cachay, S. R.; Erickson, E.; Bucker, A. F. C.; Pokropek, E.; Potosnak, W.; Bire, S.; Osei, S.; and L \"u tjens, B. 2021. The World as a Graph: Improving El Niño Forecasts with Graph Neural Networks. arXiv preprint arXiv:2104.05089
2021 arXiv
-
[50]
R.; Zhao, B.; James, H.; and Yu, R
Cachay, S. R.; Zhao, B.; James, H.; and Yu, R. 2023. DYffusion: A Dynamics-informed Diffusion Model for Spatiotemporal Forecasting. In Thirty-seventh Conference on Neural Information Processing Systems
2023
-
[51]
T.; and Shah, M
Croitoru, F.-A.; Hondru, V.; Ionescu, R. T.; and Shah, M. 2023. Diffusion models in vision: A survey. IEEE Transactions on Pattern Analysis and Machine Intelligence
2023
-
[52]
Defferrard, M.; Perraudin, N.; Kacprzak, T.; and Sgier, R. 2019. DeepSphere : towards an equivariant graph-based spherical cnn. arXiv preprint arXiv:1904.05146
2019 arXiv
-
[53]
Esser, P.; Chiu, J.; Atighehchian, P.; Granskog, J.; and Germanidis, A. 2023. Structure and content-guided video synthesis with diffusion models. In Proceedings of the IEEE/CVF International Conference on Computer Vision, 7346--7356
2023
-
[54]
R.; Akhtar, M.; Shi, L.; Luo, J.-J.; and Hobday, A
Feng, M.; Boschetti, F.; Ling, F.; Zhang, X.; Hartog, J. R.; Akhtar, M.; Shi, L.; Luo, J.-J.; and Hobday, A. J. 2022. Predictability of sea surface temperature anomalies at the eastern pole of the Indian Ocean Dipole-Using a convolutional neural network model. Frontiers in Cli...
2022
-
[55]
A.; and Stephenson, D
Ferro, C. A.; and Stephenson, D. B. 2011. Extremal dependence indices: Improved verification measures for deterministic forecasts of rare binary events. Weather and Forecasting, 26(5): 699--713
2011
-
[56]
Fey, M.; and Lenssen, J. E. 2019. Fast graph representation learning with PyTorch Geometric . arXiv preprint arXiv:1903.02428
2019 arXiv
-
[57]
Friedman, M. 1937. The use of ranks to avoid the assumption of normality implicit in the analysis of variance. Journal of the american statistical association, 32(200): 675--701
1937
-
[58]
Friedman, M. 1940. A comparison of alternative tests of significance for the problem of m rankings. The Annals of Mathematical Statistics, 11(1): 86--92
1940
-
[59]
Ham, Y.-G.; Kim, J.-H.; Kim, E.-S.; and On, K.-W. 2021. Unified deep learning model for El Ni \ n o/Southern Oscillation forecasts by incorporating seasonality in climate data. Science Bulletin, 66(13): 1358--1366
2021
-
[60]
Ham, Y.-G.; Kim, J.-H.; and Luo, J.-J. 2019. Deep learning for multi-year ENSO forecasts. Nature, 573(7775): 568--572
2019
-
[61]
Hamilton, W.; Ying, Z.; and Leskovec, J. 2017. Inductive representation learning on large graphs. In Proceedings of the 30th Advances in Neural Information Processing Systems
2017
-
[62]
Hersbach, H.; Bell, B.; Berrisford, P.; Hirahara, S.; Hor \'a nyi, A.; Mu \ n oz-Sabater, J.; Nicolas, J.; Peubey, C.; Radu, R.; Schepers, D.; et al. 2020. The ERA5 global reanalysis. Quarterly Journal of the Royal Meteorological Society, 146(730): 1999--2049
2020
-
[63]
P.; Poole, B.; Norouzi, M.; Fleet, D
Ho, J.; Chan, W.; Saharia, C.; Whang, J.; Gao, R.; Gritsenko, A.; Kingma, D. P.; Poole, B.; Norouzi, M.; Fleet, D. J.; et al. 2022. Imagen video: High definition video generation with diffusion models. arXiv preprint arXiv:2210.02303
2022 arXiv
-
[64]
J.; Alexander, L
Hobday, A. J.; Alexander, L. V.; Perkins, S. E.; Smale, D. A.; Straub, S. C.; Oliver, E. C.; Benthuysen, J. A.; Burrows, M. T.; Donat, M. G.; Feng, M.; et al. 2016. A hierarchical approach to defining marine heatwaves. Progress in Oceanography, 141: 227--238
2016
-
[65]
J.; Spillman, C
Hobday, A. J.; Spillman, C. M.; Eveson, J. P.; Hartog, J. R.; Zhang, X.; and Brodie, S. 2018. A framework for combining seasonal forecasts and climate projections to aid risk management for fisheries and aquaculture. Frontiers in Marine Science, 137
2018
-
[66]
J.; Sen Gupta, A.; Oliver, E
Holbrook, N. J.; Sen Gupta, A.; Oliver, E. C.; Hobday, A. J.; Benthuysen, J. A.; Scannell, H. A.; Smale, D. A.; and Wernberg, T. 2020. Keeping pace with marine heatwaves. Nature Reviews Earth & Environment, 1(9): 482--493
2020
-
[67]
Hua, Z.; He, Y.; Ma, C.; and Anderson-Frey, A. 2024. Weather Prediction with Diffusion Guided by Realistic Forecast Processes. arXiv preprint arXiv:2402.06666
2024 arXiv
-
[68]
G.; Alexander, M
Jacox, M. G.; Alexander, M. A.; Amaya, D.; Becker, E.; Bograd, S. J.; Brodie, S.; Hazen, E. L.; Pozo Buil, M.; and Tommasi, D. 2022. Global seasonal forecasts of marine heatwaves. Nature, 604(7906): 486--490
2022
-
[69]
G.; Tommasi, D.; Alexander, M
Jacox, M. G.; Tommasi, D.; Alexander, M. A.; Hervieux, G.; and Stock, C. A. 2019. Predicting the evolution of the 2014--2016 California Current System marine heatwave from an ensemble of coupled global climate forecasts. Frontiers in Marine Science, 6: 497
2019
-
[70]
Luo, W.; Li, Y.; Urtasun, R.; and Zemel, R. 2016. Understanding the effective receptive field in deep convolutional neural networks. Advances in neural information processing systems, 29
2016
-
[71]
J.; Lee, W.-S.; Boer, G
Merryfield, W. J.; Lee, W.-S.; Boer, G. J.; Kharin, V. V.; Scinocca, J. F.; Flato, G. M.; Ajayamohan, R.; Fyfe, J. C.; Tang, Y.; and Polavarapu, S. 2013. The Canadian seasonal to interannual prediction system. Part I: Models and initialization. Monthly weather review, 141(8): ...
2013
-
[72]
R.; and Koh, Y
Ning, D.; Vetrova, V.; Bryan, K. R.; and Koh, Y. S. 2024. Harnessing the Power of Graph Representation in Climate Forecasting: Predicting Global Monthly Mean Sea Surface Temperatures and Anomalies. Advances in Machine Learning for Earth Science: Observation, Modeling, and Appl...
2024
-
[73]
C.; Benthuysen, J
Oliver, E. C.; Benthuysen, J. A.; Darmaraki, S.; Donat, M. G.; Hobday, A. J.; Holbrook, N. J.; Schlegel, R. W.; and Sen Gupta, A. 2021. Marine heatwaves. Annual Review of Marine Science, 13: 313--342
2021
-
[74]
C.; Burrows, M
Oliver, E. C.; Burrows, M. T.; Donat, M. G.; Sen Gupta, A.; Alexander, L. V.; Perkins-Kirkpatrick, S. E.; Benthuysen, J. A.; Hobday, A. J.; Holbrook, N. J.; Moore, P. J.; et al. 2019. Projected marine heatwaves in the 21st century and the potential for ecological impact. Front...
2019
-
[75]
Paszke, A.; Gross, S.; Massa, F.; Lerer, A.; Bradbury, J.; Chanan, G.; Killeen, T.; Lin, Z.; Gimelshein, N.; Antiga, L.; et al. 2019. PyTorch : An imperative style, high-performance deep learning library. Advances in neural information processing systems, 32
2019
-
[76]
S.; Vasavi, S.; and Vighneshwar, S
Pravallika, M. S.; Vasavi, S.; and Vighneshwar, S. 2022. Prediction of temperature anomaly in Indian Ocean based on autoregressive long short-term memory neural network. Neural Computing and Applications, 34(10): 7537--7545
2022
-
[77]
Ratnam, J.; Dijkstra, H.; and Behera, S. K. 2020. A machine learning based prediction system for the Indian Ocean Dipole. Scientific reports, 10(1): 1--11
2020
-
[78]
Ren, J.; Zhang, M.; Yu, C.; and Liu, Z. 2022. Balanced mse for imbalanced visual regression. In Proceedings of the IEEE/CVF Conference on Computer Vision and Pattern Recognition, 7926--7935
2022
-
[79]
W.; Smith, T
Reynolds, R. W.; Smith, T. M.; Liu, C.; Chelton, D. B.; Casey, K. S.; and Schlax, M. G. 2007. Daily high-resolution-blended analyses for sea surface temperature. Journal of climate, 20(22): 5473--5496
2007
-
[80]
Saha, S.; Moorthi, S.; Wu, X.; Wang, J.; Nadiga, S.; Tripp, P.; Behringer, D.; Hou, Y.-T.; Chuang, H.-y.; Iredell, M.; et al. 2014. The NCEP climate forecast system version 2. Journal of climate, 27(6): 2185--2208
2014
-
[81]
Schaefer, J. T. 1990. The critical success index as an indicator of warning skill. Weather and forecasting, 5(4): 570--575
1990
-
[82]
Taylor, J.; and Feng, M. 2022. A deep learning model for forecasting global monthly mean sea surface temperature anomalies. Frontiers in Climate, 4: 178
2022
-
[83]
K.; Jayakumar, M.; and De Alwis, K
Terry, J. K.; Jayakumar, M.; and De Alwis, K. 2021. Statistically significant stopping of neural network training. arXiv preprint arXiv:2103.01205
2021 arXiv
-
[84]
P.; Pfahringer, B.; and Branco, P
Torgo, L.; Ribeiro, R. P.; Pfahringer, B.; and Branco, P. 2013. SMOTE for regression. In Proceedings of the Portuguese Conference on Artificial Intelligence, 378--389. Springer
2013
-
[85]
A.; Swanson, K
Tsonis, A. A.; Swanson, K. L.; and Roebber, P. J. 2006. What do networks have to do with climate? Bulletin of the American Meteorological Society, 87(5): 585--596
2006
-
[86]
A.; Delworth, T.; Gudgel, R.; Kapnick, S.; Rosati, A.; Wittenberg, A
Vecchi, G. A.; Delworth, T.; Gudgel, R.; Kapnick, S.; Rosati, A.; Wittenberg, A. T.; Zeng, F.; Anderson, W.; Balaji, V.; Dixon, K.; et al. 2014. On the seasonal forecasting of regional tropical cyclone activity. Journal of Climate, 27(21): 7994--8016
2014
-
[87]
A.; and Mansfield, L
Watt, R. A.; and Mansfield, L. A. 2024. Generative Diffusion-based Downscaling for Climate. arXiv preprint arXiv:2404.17752
2024 arXiv
-
[88]
Wu, Y.; and Tang, Y. 2019. Seasonal predictability of the tropical Indian Ocean SST in the North American multimodel ensemble. Climate Dynamics, 53(5): 3361--3372
2019
-
[89]
Yang, R.; Srivastava, P.; and Mandt, S. 2023. Diffusion probabilistic modeling for video generation. Entropy, 25(10): 1469
2023
-
[90]
Yang, Y.; Zha, K.; Chen, Y.; Wang, H.; and Katabi, D. 2021. Delving into deep imbalanced regression. In Proceedings of the 38th International Conference on Machine Learning, 11842--11851. PMLR
2021
Reviewed August 12, 2026 · model on record in the stance chip above.
Discussion (0). Continue with ORCID to comment.