REVIEW 3 major objections 5 minor 54 references
Mesoscale Turbulence in Type Ia Supernova Deflagrations: Buoyancy-Driven Fuel Heating and Prospects for Delayed-Detonations
T0 review · 3 major / 5 minor · reviewed 2026-08-07 · deepseek-v4-flash
Pith's one-line read In simulated Type Ia supernova flames, buoyancy compresses and heats nearby fuel, cutting its ignition time by two to more than five orders of magnitude.
desk verdict A serious flame-in-a-box study with a plausible but not yet established claim about buoyancy preconditioning fuel for DDT; worth refereeing, but the headline number rests on a 4-8 cell layer with no convergence check. read the letter →
The pith
A machine-rendered reading of the paper's core claim, the machinery that carries it, and where it could break.
The reading
What carries the argument
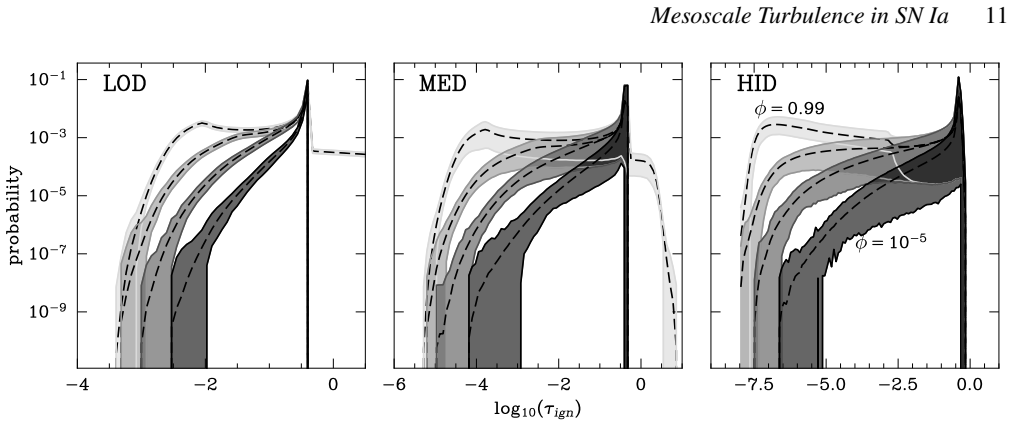
The mechanism carrying the argument is adiabatic compression of fuel by buoyancy-driven flame motion, diagnosed through the carbon ignition time as a function of the flame progress variable and a flame-surface orientation factor $n_{f,g}=\nabla\phi\cdot\mathbf{g}/(\|\nabla\phi\|\|\mathbf{g}\|)$. Joint probability distributions of ignition time against this orientation factor show the shortest ignition times where $n_{f,g}\approx+1$, at the tops of rising flame bubbles, and longer times in sinking spikes; this correlation is the signature that ties the ignition-time reduction to buoyancy rather than to the flame's thermal structure alone. The numerical machinery is a thickened-flame advection-diffusion-reaction model with adaptive mesh refinement at an effective resolution of 62.5 m, evolved to a quasi-steady state and analyzed in a frame co-moving with the turbulent post-flame region.
What would settle it
Repeat the highest-density (HID) model at twice the effective resolution ($\approx$31 m) or with a thinner flame profile: if the more-than-five-order-of-magnitude reduction in fuel ignition times does not persist, the buoyant heating is a numerical artifact of the thickened flame's diffusive precursor rather than a physical effect. A complementary check is to enable fuel-restricted self-heating in the same model and determine whether the predicted early ignition actually occurs ahead of the flame front.
Extended reading notes
Core claim
The paper's central finding is that fuel in the turbulent post-flame region of a Rayleigh-Taylor-driven deflagration is not inert: as the flame front approaches a fuel parcel, the flame's thermal expansion and buoyant acceleration compress the fuel adiabatically, and this compression is strongest where the flame surface's normal is aligned with gravity, namely at the tops of rising Rayleigh-Taylor bubbles. Using a flame progress variable to tag distance from the front, the authors measure carbon ignition times in the compressed fuel layers and find reductions of about two orders of magnitude in the lowest-density model, three in the intermediate model, and more than five in the highest-density model, with the ignition-time distribution broadened into a tail of strongly preheated parcels. They argue that such heated layers, up to several hundred meters wide, are plausible sites for the Zel'dovich mechanism, especially in cusps where rising bubbles collide and in Rayleigh-Taylor spikes that resemble the fuel channels in which their earlier spectrally-driven turbulence models produced detonations. The paper is explicit, however, that pure Rayleigh-Taylor forcing alone did not reproduce that earlier preconditioning, and that demonstrating an actual transition will require higher-resolution simulations with fuel self-heating included.
Load-bearing premise
The load-bearing premise is that the simulations' 62.5-meter effective resolution, refinement criteria, and prescribed subgrid flame speed faithfully capture the physical compressive heating of fuel by the flame, rather than an artifact of the artificially thickened flame; the paper reports no resolution-convergence study to confirm this.
Editorial extensions
If this is right
- If the buoyant heating is physical, fuel ahead of the flame in Type Ia deflagrations can ignite far sooner than cold-fuel burn rates imply, so burning should begin ahead of the front and possibly in isolated pockets inside the warm fuel layer.
- The preconditioning required by the Zel'dovich DDT mechanism can develop in buoyancy-driven flame brushes at fuel densities of roughly $5\times10^6$ to $6\times10^7$ g cm$^{-3}$, most plausibly in fuel at bubble tops and in cusps and spikes that resemble the fuel channels of the earlier spectrally-driven models.
- Turbulent velocity fluctuations on detonation-relevant scales are about 60 to 200 km/s, far below the roughly 1000 km/s assumed by distributed-burning DDT models, so mechanisms requiring high turbulence intensity on 10 km scales are disfavored while low-fluctuation ZDDT models are consistent with the data.
- Under the turbulence-induced DDT picture, the most likely transition density shifts above the earlier estimate of $3\times10^7$ g cm$^{-3}$, because the measured intensities are higher than assumed at the high-density end and lower at the low-density end.
- Next-generation Rayleigh-Taylor deflagration simulations must include fuel-restricted nuclear self-heating, since the heated fuel layers may release energy before the front arrives and feed back into the flow.
Reading between the lines
- The trend in the paper's own numbers — ignition-time reduction growing from about two to more than five orders of magnitude as density increases — implies that if a delayed detonation occurs through this channel, it should be most favored at the high-density end of the DDT window, possibly above the canonical $2\times10^7$ g cm$^{-3}$.
- A natural next calculation, which the paper notes would be comparatively cheap, is to switch on fuel self-heating in the highest-density model and watch whether preheated fuel actually ignites ahead of the front; if it does, the ignition-time reductions correspond to real precursor burning rather than to a diagnostic artifact.
- Because no resolution-convergence study is reported, the stronger heating seen at higher density could in principle be amplified by the thickened flame's wider diffusive precursor; repeating the highest-density model at about 31 m resolution would test whether the more-than-five-order reduction survives.
- If buoyant preheating operates in real explosions, carbon would burn at lower density than standard deflagration models assume, which would shift the nucleosynthetic yields and the early light curve of delayed-detonation models; this is an observational consequence the paper does not address.
Editorial analysis
A structured set of objections, weighed in public.
Referee Report
Summary. The paper presents three-dimensional AMR simulations of Rayleigh-Taylor-unstable thermonuclear deflagrations in a flame-in-a-box setup, at three fuel densities spanning approximately 5e6 to 6e7 g/cm^3, using a thickened-flame ADR model with a subgrid flame speed based on the RTI growth rate. The authors analyze a co-moving 'turbulent post-flame' (TPF) region and report that fuel near the flame front is adiabatically compressed by buoyancy, reducing carbon ignition times by about two to more than five orders of magnitude (Section 3.4, Figs. 9-11), with stronger reduction at higher density. They also characterize turbulence spectra, intermittency, velocity statistics, and flame fractal dimension, and compare their results with previous SN Ia DDT studies.
Significance. If the central heating claim is correct, it identifies a new fuel-preconditioning mechanism relevant to the Zel'dovich DDT scenario in SNe Ia, with quantitative estimates at densities where DDT is thought to occur. The paper is careful in several respects: ignition times are computed with an external formula (Dursi & Timmes 2006) rather than fitted to the result, PDFs are time-averaged over several eddy turnovers, and limitations (no self-heating, need for better resolution) are explicitly acknowledged in Section 5. However, because the claim depends on resolving a thin fuel layer with a thickened-flame model and no resolution-convergence study is reported, the present evidence is suggestive rather than definitive.
major comments (3)
- [Section 3.4 / Figs. 9-10] The central claim that fuel ignition times are reduced by two to five orders of magnitude rests on resolving the thermodynamic state in fuel layers that the authors themselves state are only up to several hundred meters wide (Abstract; Section 5). With the effective mesh resolution Delta_x = 62.5 m (Section 2), this layer spans only about 4-8 cells, and the compensated spectrum in Fig. 6 shows a flat inertial-range segment only for k approximately 4-12, i.e., scales of 3-8 km. No resolution-convergence study is reported; all quoted statistics come from a single finest resolution. Because the carbon ignition time is exponentially sensitive to temperature, a modest numerical error in the preheated layer could account for the entire quoted reduction. I request at least a systematic comparison of the ignition-time PDFs at 256-cell and 512-cell lateral resolution, and ideally a higher-resolution run for one density, such as the HID model.
- [Section 2 / Section 3.4] The ADR thickened-flame model intentionally adds diffusion to the progress variables (Model B of Zhiglo 2009), and the paper explicitly states that a diffusive precursor relates the progress variable to physical distance from the flame front (Section 3.4). The AMR refinement criteria (phi in [0.01,0.99] and delta p/p > 1e-3) do not specifically refine the pure-fuel region phi <= 1e-5 where the heating is diagnosed. The anti-correlation with negative divergence shown in Fig. 9 is suggestive, but a numerical diffusive precursor with its associated artificial compression could produce qualitatively similar signatures. The authors should demonstrate that the elevated temperature ahead of the front follows an adiabatic compression relation tied to the resolved velocity field, and that the result is insensitive to the flame-model diffusion parameters.
- [Section 4.1 / Section 5] The manuscript presents ignition-time reductions computed post hoc from the simulated temperature and density fields while explicitly omitting fuel self-heating (conclusions iii and x). Since the claim is that ignition times are reduced to values comparable to or shorter than advection times, the absence of self-heating feedback is potentially load-bearing: if the shortest-ignition-time parcels actually ignite during the simulation, the flame structure and the very statistics being measured would change. The authors appropriately call for 'better resolved numerical simulations with self-consistent fuel state', but as it stands the paper's conclusion (ii), that adiabatic heating 'may result in fuel burning ahead of the flame front', is a projection rather than a demonstrated outcome of the simulations.
minor comments (5)
- [Section 3.3 / Fig. 6] The caption of Fig. 6 describes the flat region as 'k approximately 8 +/- 4', while the text says the inertial subrange starts at k approximately 4; please clarify which wavenumber range is used for the inertial-range estimate.
- [Table 4] The header of Table 4 appears to contain duplicated superscript labels ('b' and 'b' for v8 and vRMS), which is likely a typesetting error; the column labels should be corrected to match the text.
- [Section 3.1] The TPF region is defined using a super-Gaussian fit with exponent p=10 and a fixed 32 km cube (Eq. 1); please report the sensitivity of the main ignition-time PDFs to these somewhat ad hoc choices, or justify the values with a convergence test over the TPF selection parameters.
- [Section 3.4 / footnote 3] The paper notes that the Dursi & Timmes (2006) formula produces numerical artifacts for nearly exhausted carbon at phi=0.99; please state explicitly whether the very short ignition-time tail in Fig. 10 contains any such artifact cells and whether excluding them changes the quoted reductions.
- [Section 4.2.1 / Fig. 12] The comparison with Ropke (2007) in Fig. 12 says the original parameter values were 'adjusted to scale up theoretical distributions to approximately match our data'; please specify exactly which parameters were changed and why, so the comparison is reproducible.
Circularity Check
No circularity: the ignition-time reduction is a post-processing diagnostic from an external nuclear formula applied to simulated fields, not a fitted or self-defined output.
full rationale
The paper's central claim—that buoyancy-driven compression near RT-unstable flame fronts shortens fuel ignition times by 2-5 orders of magnitude—is derived from simulated density and temperature fields processed through the external carbon ignition-time formula of Dursi & Timmes (2006). No parameter is fitted to the reported shortening: the initial fuel temperature is chosen a priori to give a burning timescale near 330 ms, and the subgrid flame speed is prescribed from the RTI growth rate rather than tuned to the ignition-time outcome. The self-citations to Brooker et al. (2021) are motivational and comparative, and the paper explicitly reports that the present RTI-driven models do not reproduce the preconditioning found in those spectrally driven models (conclusion iii), so the argument is not forced by the prior work. The resolution and thickened-flame concerns raised in the skeptical view are legitimate correctness risks, but they concern numerical fidelity rather than logical circularity: nothing in the derivation defines the result in terms of its own conclusion or renames an input as a prediction. Hence no specific circular step can be exhibited, and the appropriate score is 0.
Assumptions & free parameters
free parameters (3)
- Subgrid-scale flame speed vf,SGS =
LOD 0.420, MED 0.425, HID 0.330 km/s
- Initial fuel temperature =
LOD 1.5e9 K, MED 1.3e9 K, HID 1.2e9 K
- Super-Gaussian exponent p =
10
assumptions (5)
- standard math Conservation equations plus the Helmholtz equation of state describe the stellar plasma in this regime.
- domain assumption The thickened ADR flame model with prescribed vf,SGS reproduces the leading-order behavior of a carbon deflagration on unresolved scales.
- domain assumption Initial conditions extracted from a 2D centrally ignited pure-deflagration explosion model are representative of DDT-relevant conditions in a Chandrasekhar-mass white dwarf.
- domain assumption The Dursi and Timmes (2006) ignition-time formula is valid for the fuel states produced in the simulations.
- ad hoc to paper The TPF region, defined by a super-Gaussian fit with p=10 and a 32 km cube, captures the region most relevant to DDT preconditioning.
Cite this review
Pith. "Pith review of Mesoscale Turbulence in Type Ia Supernova Deflagrations: Buoyancy-Driven Fuel Heating and Prospects for Delayed-Detonations." pith.science (2026). https://pith.science/paper/X7PGDZGJ
@misc{pith2026250518482,
  author       = {Pith},
  title        = {Pith review of: Mesoscale Turbulence in Type Ia Supernova Deflagrations: Buoyancy-Driven Fuel Heating and Prospects for Delayed-Detonations},
  year         = {2026},
  howpublished = {\url{https://pith.science/paper/X7PGDZGJ}},
  note         = {Machine review of arXiv:2505.18482}
}
abstract
The aim of this work is to characterize the thermodynamic state of fuel mixed into the turbulent flame brush in the context of the Zel'dovich deflagration-to-detonation transition (ZDDT) mechanism of Type Ia supernovae (SNe Ia). We perform a series of three-dimensional computer simulations of thermonuclear deflagrations subject to the Rayleigh-Taylor instability (RTI) for conditions found in model explosions of centrally ignited realistic, Chandrasekhar mass white dwarf progenitors. These conditions correspond to explosion times when the flame reaches low density progenitor regions where DDT is expected to occur. The flame database is constructed using a thickened flame model. High numerical resolution is achieved with the help of the adaptive mesh refinement (AMR) approach allowing, for the first time, to resolve mesoscale buoyancy-driven flame turbulence. The system is evolved to a quasi-steady state, and flow properties in the turbulent region, where turbulence is most isotropic, is analyzed in a co-moving frame of reference. We find evidence for strong buoyancy-driven adiabatic heating of fuel layers adjacent to the flame front. The heating results in a dramatic reduction of fuel ignition times by between $\approx$2 and more than about 5 orders of magnitude. The heating increases with the RTI forcing. The observed shortening of fuel burning timescales suggests a new source of energy is important inside fuel penetrating the flame brush. These regions are up to several hundred meters wide. On the basis of the previous results of turbulent combustion in SNe Ia, preconditioning required by the ZDDT mechanism can occur there.
Figures


Figures from the paper (7 more)




Reference graph
Works this paper leans on
-
[1]
Aspden A. J., Bell J. B., Day M. S., Woosley S. E., Zingale M., 2008, @doi [ ] 10.1086/592726 , https://ui.adsabs.harvard.edu/abs/2008ApJ...689.1173A 689, 1173
-
[2]
Aspden A. J., Bell J. B., Woosley S. E., 2010, @doi [ ] 10.1088/0004-637X/710/2/1654 , https://ui.adsabs.harvard.edu/abs/2010ApJ...710.1654A 710, 1654
-
[3]
Bell J. B., Day M. S., Rendleman C. A., Woosley S. E., Zingale M., 2004, @doi [ ] 10.1086/420841 , https://ui.adsabs.harvard.edu/abs/2004ApJ...608..883B 608, 883
-
[4]
Fluid Mech.] 10.1017/jfm.2024.700 , 1004, A12
Bentkamp L., Wilczek M., 2025, @doi [J. Fluid Mech.] 10.1017/jfm.2024.700 , 1004, A12
-
[5]
Benzi R., Biferale L., Fisher R., Lamb D. Q., Toschi F., 2010, @doi [J. Fluid Mech.] 10.1017/S002211201000056X , https://ui.adsabs.harvard.edu/abs/2010JFM...653..221B 653, 221
-
[6]
Boldyrev S., Nordlund A ., Padoan P., 2002, @doi [ ] 10.1086/340758 , https://doi.org/10.48550/arXiv.astro-ph/0111345 573, 678
work page Pith review arXiv doi:10.48550/arxiv.astro-ph/0111345 2002
-
[7]
Brooker E., Plewa T., Fenn D., 2021, @doi [ ] 10.1093/mnrasl/slaa141 , https://ui.adsabs.harvard.edu/abs/2021MNRAS.501L..23B 501, L23
-
[8]
Calder A. C., et al., 2007, @doi [ ] 10.1086/510709 , https://ui.adsabs.harvard.edu/abs/2007ApJ...656..313C 656, 313
doi:10.1086/510709 2007
Show all 54 references
-
[9]
W., Childs H., Hansen C., eds, , High Performance Visualization--Enabling Extreme-Scale Scientific Insight
Childs H., et al., 2012, in Bethel E. W., Childs H., Hansen C., eds, , High Performance Visualization--Enabling Extreme-Scale Scientific Insight. CRC Press/Francis--Taylor Group, Boca Raton, p. 357
2012
-
[10]
C., R \"o pke F
Ciaraldi-Schoolmann F., Schmidt W., Niemeyer J. C., R \"o pke F. K., Hillebrandt W., 2009, @doi [ ] 10.1088/0004-637X/696/2/1491 , https://ui.adsabs.harvard.edu/abs/2009ApJ...696.1491C 696, 1491
2009 doi
-
[11]
R., R \"o pke F
Ciaraldi-Schoolmann F., Seitenzahl I. R., R \"o pke F. K., 2013, @doi [ ] 10.1051/0004-6361/201321480 , https://ui.adsabs.harvard.edu/abs/2013A&A...559A.117C 559, A117
2013 doi
-
[12]
Fluids] 10.1063/1.870436 , https://ui.adsabs.harvard.edu/abs/2000PhFl...12.1843C 12, 1843
Colin O., Ducros F., Veynante D., Poinsot T., 2000, @doi [Phys. Fluids] 10.1063/1.870436 , https://ui.adsabs.harvard.edu/abs/2000PhFl...12.1843C 12, 1843
2000 doi
-
[13]
J., Timmes F
Dursi L. J., Timmes F. X., 2006, @doi [ ] 10.1086/500638 , https://ui.adsabs.harvard.edu/abs/2006ApJ...641.1071D 641, 1071
2006 doi
-
[14]
Fenn D., Plewa T., 2017, @doi [ ] 10.1093/mnras/stx524 , 468, 1361
2017 doi
-
[15]
Fryxell B., et al., 2000, , 131, 273
2000
-
[16]
V., Kagan L., Sivashinsky G., 2021, @doi [ ] 10.1103/PhysRevE.103.033106 , https://ui.adsabs.harvard.edu/abs/2021PhRvE.103c3106G 103, 033106
Gordon P. V., Kagan L., Sivashinsky G., 2021, @doi [ ] 10.1103/PhysRevE.103.033106 , https://ui.adsabs.harvard.edu/abs/2021PhRvE.103c3106G 103, 033106
2021 doi
-
[17]
P., 2019, @doi [ ] 10.1093/mnras/stz2080 , https://ui.adsabs.harvard.edu/abs/2019MNRAS.489...36H 489, 36
Hicks E. P., 2019, @doi [ ] 10.1093/mnras/stz2080 , https://ui.adsabs.harvard.edu/abs/2019MNRAS.489...36H 489, 36
2019 doi
-
[18]
M., Wheeler J
H\"oflich P., Khokhlov A. M., Wheeler J. C., 1995, @doi [ ] 10.1086/175656 , https://ui.adsabs.harvard.edu/abs/1995ApJ...444..831H 444, 831
1995 doi
-
[19]
M., 1991a, , https://ui.adsabs.harvard.edu/abs/1991A&A...245..114K 245, 114
Khokhlov A. M., 1991a, , https://ui.adsabs.harvard.edu/abs/1991A&A...245..114K 245, 114
-
[20]
M., 1991b, , https://ui.adsabs.harvard.edu/abs/1991A&A...246..383K 246, 383
Khokhlov A. M., 1991b, , https://ui.adsabs.harvard.edu/abs/1991A&A...246..383K 246, 383
-
[21]
Khokhlov A., 1993, @doi [ ] 10.1086/187141 , https://ui.adsabs.harvard.edu/abs/1993ApJ...419L..77K 419, L77
1993 doi
-
[22]
M., 1995, @doi [ ] 10.1086/176091 , https://ui.adsabs.harvard.edu/abs/1995ApJ...449..695K 449, 695
Khokhlov A. M., 1995, @doi [ ] 10.1086/176091 , https://ui.adsabs.harvard.edu/abs/1995ApJ...449..695K 449, 695
1995 doi
-
[23]
M., Oran E
Khokhlov A. M., Oran E. S., Wheeler J. C., 1997, @doi [ ] 10.1086/303815 , https://ui.adsabs.harvard.edu/abs/1997ApJ...478..678K 478, 678
1997 doi
-
[24]
N., 1941, in Dokl
Kolmogorov A. N., 1941, in Dokl. Akad. Nauk SSSR. pp 301--305
1941
-
[25]
D., Lifshitz E
Landau L. D., Lifshitz E. M., 1987, Fluid Mechanics. Butterworth-Heinemann, http://www.worldcat.org/isbn/0750627670
1987
-
[26]
E., 2009, @doi [J
Lee D., Deane A. E., 2009, @doi [J. Comput. Phys.] 10.1016/j.jcp.2008.08.026 , https://ui.adsabs.harvard.edu/abs/2009JCoPh.228..952L 228, 952
2009 doi
-
[27]
M., Hillebrandt W., Woosley S
Lisewski A. M., Hillebrandt W., Woosley S. E., 2000, @doi [ ] 10.1086/309158 , https://ui.adsabs.harvard.edu/abs/2000ApJ...538..831L 538, 831
2000 doi
-
[28]
Livne E., Arnett D., 1993, @doi [ ] 10.1086/187044 , https://ui.adsabs.harvard.edu/abs/1993ApJ...415L.107L 415, L107
1993 doi
-
[29]
Fluids] 10.1063/1.2166455 , 18, 015103
Mouri H., Takaoka M., Hori A., Kawashima Y., 2006, @doi [Phys. Fluids] 10.1063/1.2166455 , 18, 015103
2006 doi
-
[30]
C., Woosley S
Niemeyer J. C., Woosley S. E., 1997, @doi [ ] 10.1086/303544 , https://ui.adsabs.harvard.edu/abs/1997ApJ...475..740N 475, 740
1997 doi
-
[31]
S., Gamezo V
Oran E. S., Gamezo V. N., 2007, @doi [Combust. Flame] https://doi.org/10.1016/j.combustflame.2006.07.010 , 148, 4
2007 doi
-
[32]
C., Scalo J., 2008, @doi [ ] 10.1086/588575 , https://ui.adsabs.harvard.edu/abs/2008ApJ...681..470P 681, 470
Pan L., Wheeler J. C., Scalo J., 2008, @doi [ ] 10.1086/588575 , https://ui.adsabs.harvard.edu/abs/2008ApJ...681..470P 681, 470
2008 doi
-
[33]
Plewa T., 2007, @doi [ ] 10.1086/511412 , https://ui.adsabs.harvard.edu/abs/2007ApJ...657..942P 657, 942
2007 doi
-
[34]
Y., Chambers J., Ahmed K., Gamezo V
Poludnenko A. Y., Chambers J., Ahmed K., Gamezo V. N., Taylor B. D., 2019, @doi [ ] 10.1126/science.aau7365 , 366, eaau7365
2019 doi
-
[35]
M., 1993, @doi [Nucl
Polyakov A. M., 1993, @doi [Nucl. Phys. B] 10.1016/0550-3213(93)90656-A , https://ui.adsabs.harvard.edu/abs/1993NuPhB.396..367P 396, 367
1993 doi
-
[36]
K., 2007, @doi [ ] 10.1086/520830 , https://ui.adsabs.harvard.edu/abs/2007ApJ...668.1103R 668, 1103
R \"o pke F. K., 2007, @doi [ ] 10.1086/520830 , https://ui.adsabs.harvard.edu/abs/2007ApJ...668.1103R 668, 1103
2007 doi
-
[37]
C., R \"o pke F
Schmidt W., Ciaraldi-Schoolmann F., Niemeyer J. C., R \"o pke F. K., Hillebrandt W., 2010, @doi [ ] 10.1088/0004-637X/710/2/1683 , https://ui.adsabs.harvard.edu/abs/2010ApJ...710.1683S 710, 1683
2010 doi
-
[38]
She Z.-S., Leveque E., 1994, @doi [ ] 10.1103/PhysRevLett.72.336 , https://ui.adsabs.harvard.edu/abs/1994PhRvL..72..336S 72, 336
1994 doi
-
[39]
L., 1985, @doi [Phys
Takabe H., Mima K., Montierth L., Morse R. L., 1985, @doi [Phys. Fluids] 10.1063/1.865099 , https://ui.adsabs.harvard.edu/abs/1985PhFl...28.3676T 28, 3676
1985 doi
-
[40]
X., Swesty F
Timmes F. X., Swesty F. D., 2000, @doi [ ] 10.1086/313304 , https://ui.adsabs.harvard.edu/abs/2000ApJS..126..501T 126, 501
2000 doi
-
[41]
X., Hoffman R
Timmes F. X., Hoffman R. D., Woosley S. E., 2000, @doi [ ] 10.1086/313407 , https://ui.adsabs.harvard.edu/abs/2000ApJS..129..377T 129, 377
2000 doi
-
[42]
K., 2018, Physics of Buoyant Flows
Verma M. K., 2018, Physics of Buoyant Flows. World Scientific, @doi 10.1142/10928 , https://doi.org/10.1142/10928
2018 doi
-
[43]
Methods] 10.1038/s41592-019-0686-2 , https://rdcu.be/b08Wh 17, 261
Virtanen P., et al., 2020, @doi [Nat. Methods] 10.1038/s41592-019-0686-2 , https://rdcu.be/b08Wh 17, 261
2020 doi
-
[44]
Wong T. L. S., Schwab J., 2019, @doi [ ] 10.3847/1538-4357/ab1b49 , https://ui.adsabs.harvard.edu/abs/2019ApJ...878..100W 878, 100
2019 doi
-
[45]
E., 2007, @doi [ ] 10.1086/520835 , https://ui.adsabs.harvard.edu/abs/2007ApJ...668.1109W 668, 1109
Woosley S. E., 2007, @doi [ ] 10.1086/520835 , https://ui.adsabs.harvard.edu/abs/2007ApJ...668.1109W 668, 1109
2007 doi
-
[46]
E., Kerstein A
Woosley S. E., Kerstein A. R., Sankaran V., Aspden A. J., R \"o pke F. K., 2009, @doi [ ] 10.1088/0004-637X/704/1/255 , https://ui.adsabs.harvard.edu/abs/2009ApJ...704..255W 704, 255
2009 doi
-
[47]
E., Kerstein A
Woosley S. E., Kerstein A. R., Aspden A. J., 2011, @doi [ ] 10.1088/0004-637X/734/1/37 , https://ui.adsabs.harvard.edu/abs/2011ApJ...734...37W 734, 37
2011 doi
-
[48]
Yakhot V., 1998, @doi [ ] 10.1103/PhysRevE.57.1737 , https://ui.adsabs.harvard.edu/abs/1998PhRvE..57.1737Y 57, 1737
1998 doi
-
[49]
B., Librovich V
Zel'dovich Y. B., Librovich V. B., Makhviladze G. M., Sivashinskil G. I., 1970, @doi [J. Appl. Mech. Tech. Phys.] 10.1007/BF00908106 , 11, 264
1970 doi
-
[50]
Zhang J., Messer O. E. B., Khokhlov A. M., Plewa T., 2007, @doi [ ] 10.1086/510145 , https://ui.adsabs.harvard.edu/abs/2007ApJ...656..347Z 656, 347
2007 doi
-
[51]
V., 2007, @doi [ ] 10.1086/511525 , https://ui.adsabs.harvard.edu/abs/2007ApJS..169..386Z 169, 386
Zhiglo A. V., 2007, @doi [ ] 10.1086/511525 , https://ui.adsabs.harvard.edu/abs/2007ApJS..169..386Z 169, 386
2007 doi
- [52]
-
[53]
E., Rendleman C
Zingale M., Woosley S. E., Rendleman C. A., Day M. S., Bell J. B., 2005, @doi [ ] 10.1086/433164 , 632, 1021
2005 doi
-
[54]
write newline
" write newline "" before.all 'output.state := FUNCTION fin.entry write newline FUNCTION new.block output.state before.all = 'skip after.block 'output.state := if FUNCTION new.sentence output.state after.block = 'skip output.state before.all = 'skip after.sentence 'output.stat...
Reviewed August 7, 2026 · model on record in the stance chip above.
Discussion (0). Continue with ORCID to comment.