REVIEW 5 major objections 5 minor 46 references
Association between built environment characteristics and school run traffic congestion in Beijing, China
T0 review · 5 major / 5 minor · reviewed 2026-08-12 · deepseek-v4-flash
Pith's one-line read School-escorted trips lower the probability of free-flowing traffic around Beijing schools by 8.34 percentage points during pick-up and drop-off hours.
desk verdict The paper's descriptive analysis of school-neighborhood congestion is solid and the street-view scenescape approach is a real contribution, but the headline 8.34% school-run effect is misidentified and likely misreported; the actual contrast is about half that and rests on one Thursday with no control roads. read the letter →
The pith
A machine-rendered reading of the paper's core claim, the machinery that carries it, and where it could break.
The reading
What carries the argument
The temporal argument runs through a generalized ordered logit model for the ordinal congestion index (smooth, slow, congested, severely congested), $P(Y>j)=\exp(\alpha_j+X\beta_j)/(1+\exp(\alpha_j+X\beta_j))$, with dummy variables for workday hours, school-run hours, and national-exam hours. Its marginal effects, computed from Equation (3), translate estimated coefficients into percentage-point changes in the probability of each congestion level, which lets the authors subtract a commute-without-school baseline from a commute-with-school baseline. The spatial argument runs through a multiple linear regression of each school neighborhood's congestion frequency on Z-scored built-environment variables, with K-means clustering of street-view scene probabilities producing ten scenescapes, and Shapley values used to rank contributions and interactions.
What would settle it
Find a normal workday in Beijing on which schools close for a reason unrelated to traffic (such as a teacher in-service day), rerun Model 1 comparing that day with ordinary school mornings, and check whether the smooth-traffic marginal effect is near $-8.34$ percentage points; if it is not, the Gaokao-week Thursday, not school runs, is the source of the effect.
Extended reading notes
Core claim
The paper's central discovery is that school runs are a distinct congestion shock that can be separated from ordinary commute congestion. In the generalized ordered logit model, the marginal effect of the Monday/Tuesday school-run hours relative to the Thursday morning no-school commute baseline shows that smooth traffic probability falls by 8.34 percentage points, with slow traffic up 3.08, congested up 4.20, and severely congested up 1.05 percentage points. The paper further claims that the spatial distribution of this congestion is explained by the built environment: the multiple linear regression (adjusted $R^2 = 0.4524$) and Shapley explanations identify neighboring schools, bus stops, road betweenness centrality, average building height, and scenescapes tied to financial, business, and educational/highway functions as congestion-increasing, while distance from the city center and certain residential or well-organized urban scenescapes are congestion-reducing.
Load-bearing premise
The counterfactual comparison treats Thursday morning of the national college entrance examination week as a school-free version of an ordinary workday; if exam-week traffic management, school closures at exam sites, or citywide conditions make that Thursday unlike Monday and Tuesday morning, the 8.34-point effect is misattributed to school runs.
Editorial extensions
If this is right
- School-escorted trips add a congestion burden on roads within 500 m of schools that is separable from ordinary commuting: smooth traffic probability drops by 8.34 percentage points during pick-up and drop-off hours.
- School-run congestion is structurally tied to local land use and transport supply: schools near other schools, bus stops, roads with high betweenness centrality, and business/financial street scenes face higher congestion risk.
- School siting can be treated as a congestion-management decision: new schools should avoid the city center and the northeast sector within the 5th Ring Road, stay outside the 500 m catchment of existing schools, and avoid high-traffic roads and bus-stop-dense blocks.
- Existing school neighborhoods can be ranked by a built-environment congestion score that explains roughly 46% of observed variation, giving an upgrade priority list for street and scenescape improvements.
- Contradictory scenescape interactions imply that a street type that reduces congestion can amplify another type's congestion-promoting effect, so area-level redesign should consider combinations rather than single features.
Reading between the lines
- The paper does not test the 8.34-point estimate against control roads or a second school-closure week; an inference is that the effect could be re-estimated as a difference-in-differences with roads beyond 500 m from any school as controls, which would remove citywide traffic shocks that the single exam-week Thursday cannot absorb.
- The scenescape interaction effects are correlational, but they suggest testable planning interventions: converting business/highway scenescapes to residential or organized-urban streetscapes should reduce congestion, and a before-after study around a street redesign or bus-stop relocation could verify this.
- Because the data cover one week and one city, an out-of-sample test in another Chinese city or in a different season would clarify which built-environment coefficients are stable; the paper's own scoring function is not validated on held-out schools.
- A direct extension of the built-environment score is to screen proposed school sites before construction by computing the congestion risk score for candidate plots, though such predictive use would require validation on sites built after the model was fit.
Signed reviews
Editorial analysis
A structured set of objections, weighed in public.
Referee Report
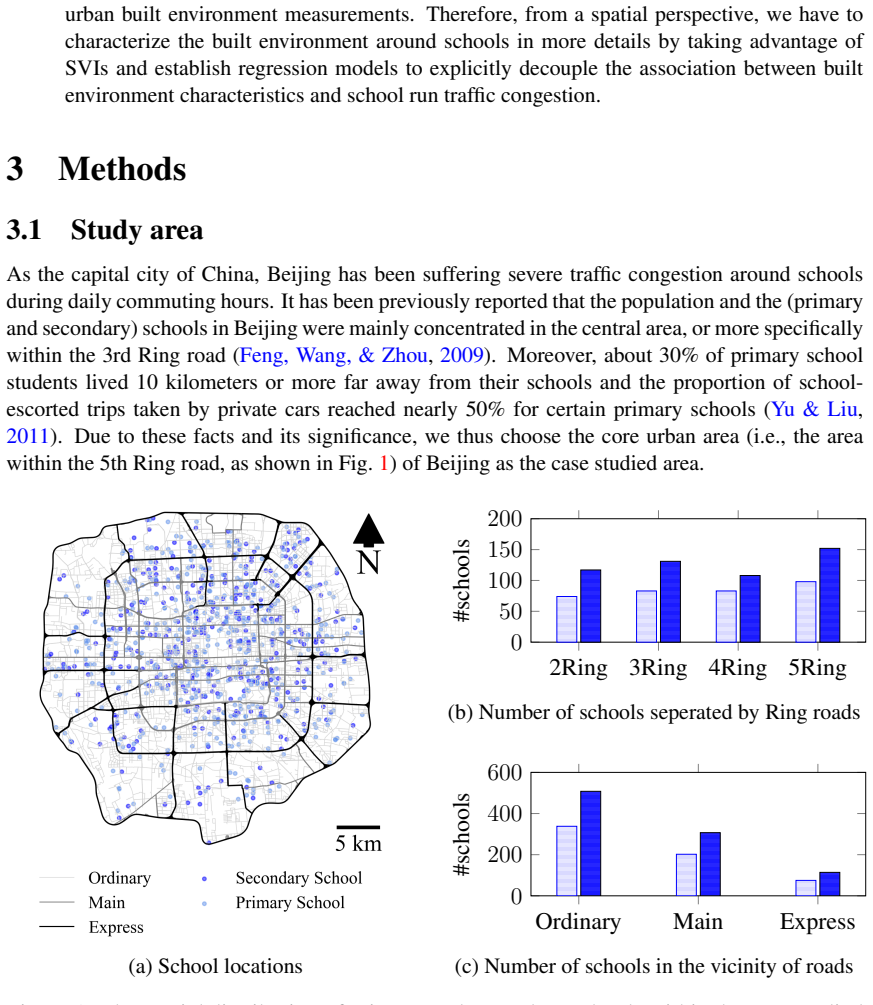
Summary. The paper studies the relationship between school-run trips and traffic congestion around 846 schools in Beijing, using one week (June 5–11, 2023) of hourly congestion indices from Baidu Map, combined with multi-source built-environment data including road topology, POIs, building footprints, mobile signaling, and street-view imagery. The authors estimate a generalized ordered logit model (Model 1) with workday, school-run, and exam-period dummies to quantify the impact of school-escorted trips on the probability of each congestion state, and a linear regression model (Model 2) with SHAP explanations to link built-environment features to school-neighborhood congestion frequency. The headline result is that school runs reduce the probability of 'smooth' traffic by 8.34 percentage points; the paper also reports that congestion is worse near multiple schools, bus stops, and certain business/financial scenescapes, and proposes a built-environment score for school siting and upgrading.
Significance. If the 8.34% estimate were credible, it would provide a spatially explicit, policy-relevant magnitude for school-run congestion and would extend existing work by linking congestion to a richer set of built-environment measures, including street-view scenescapes. The paper assembles a large multi-source dataset and its descriptive school-level model (Model 2) identifies plausible correlates with a moderate fit (adjusted R² = 0.45). However, the causal interpretation of Q1 rests on a fragile single-week, no-control-group comparison, and the reported effect size appears to be misread from the displayed marginal effects. These issues are load-bearing for the paper's central claim, although they are addressable in revision, so the current version does not support the strength of the conclusions.
major comments (5)
- [Section 4.1 (Fig. 5(b)) and Abstract] The paper's headline claim that 'school runs reduce the probability of smooth traffic by 8.34%' is not the contrast shown in Fig. 5(b). The figure reports -8.34% for the combined school-work commute state and -3.61% for the no-school work commute state; the quantity described in the text as 'adding school-escorted trips into Thursday morning commute hours' is the difference between these two states, which is -4.73 percentage points, not -8.34. The Abstract and Section 6 repeat the level as if it were the effect, so either the reported magnitude is overstated or the labels/quantities in Fig. 5(b) are mis-specified. This needs to be corrected and consistently reported.
- [Section 3.2.1 and Section 4.1] The Q1 estimate is identified from a single week (June 5–11, 2023) with one non-school weekday, Thursday morning of Gaokao week, serving as the counterfactual for Monday/Tuesday mornings. Schools are closed for the entire exam week, and Gaokao itself induces atypical traffic management, road closures, and exam-center trips; no control roads outside school neighborhoods are used to absorb citywide day-of-week or exam-week shocks. The text calls this a 'DID setting,' but there is no control group, so the estimate conflates school-run effects with any Thursday-specific or exam-week-specific changes. The authors should add control roads and multiple non-school days, or explicitly downgrade the claim to a descriptive within-week comparison.
- [Section 3.3.1 and Table 3] The coding of the temporal dummies is not precise enough to reproduce the analysis. Table 3 defines 'work' as 'Monday and Friday' (presumably a typo for Monday–Friday); 'school' is defined only as 'pick-up/drop-off hours on Monday and Tuesday' without listing the exact timestamps that enter the model; and 'exam' excludes Thursday morning but does not state how Thursday afternoon or Saturday (also listed as an exam day) are treated. Since the 8.34% result depends on the exact coding of these dummies, the supplement should provide the full set of indicators, the time slots used, and the complete regression output with standard errors.
- [Section 5.1 and Fig. 8(a)] The built-environment score in Eq. (6) is a linear combination of the coefficients βi estimated in Model 2, using the same variables and the same p<0.1 threshold that define significance in that model. The reported R²=0.461 in Fig. 8(a) is therefore an in-sample measure of Model 2's own fit, not an independent validation of the score's predictive ability. The statement that the score 'has the ability to distinguish school neighborhoods with a high risk of congestion' is circular; an out-of-sample or cross-validated assessment is needed before the score is presented as a planning tool.
- [Section 5.2 and Appendix A.1] The SHAP interaction analysis is presented as evidence that the impact of one scenescape on congestion changes sign depending on the presence of another scenescape, and the policy section draws planning recommendations from this 'contradictory effect.' However, Model 2 is a linear regression without interaction terms, so SHAP interaction values can only reflect correlations among features rather than causal moderation. The claim that converting scenescape 5 to scenescape 1 'will cancel out' the congestion-promoting effect is not supported by the estimated model and should be reframed as a hypothesis, not a model-derived conclusion.
minor comments (5)
- [Throughout] The manuscript contains numerous typographical errors, including 'trafffic', 'envionment', 'seperation', 'inplausible', 'buidings', 'occurence', 'convinience', and 'meantime'; a thorough copyedit is needed.
- [Fig. 5(b)] The axis label 'Coefficient of marginal effect (%)' is misleading because the two bars per category represent the combined work+school state and the work-only state; please provide a explicit legend and state which base category each bar refers to.
- [Section 3.2.1 and Table 3] The text says the screening period includes 'four national college entrance examination days (June 7–10; Wednesday–Saturday)' but Table 3's exam variable only includes Wednesday and Friday; please clarify which days and hours are treated as exam periods and why Thursday afternoon and Saturday are excluded.
- [Section 3.2.3 and Table 2] The K-means cluster counts (4, 3, 3 for ordinary, main, and express roads) are stated without justification or stability checks, and the scenescape labels in Table 2 are assigned by 'expert knowledge' without any validation; please describe the labeling procedure and any reliability assessment.
- [Section 4.1] The paper reports p<0.01 for all marginal-effect coefficients in Model 1 but does not provide standard errors, confidence intervals, or information about clustering of road-level observations within school neighborhoods; these should be reported.
Circularity Check
Policy scoring in Sec. 5.1 validates a score built from the same regression coefficients against the same congestion outcome, so the reported R²=0.461 is an in-sample fit; the central Q1 estimate and built-environment coefficients are otherwise independent empirical results.
-
fitted input called prediction
[Section 5.1, Eq. (6), Fig. 8(a)]
"we select a subset explanatory variables X from all the built environement characteristics by the threshodpi < 0.1 and normalize their coefficients asβ′i = βi/max(|βi|) to obtain a linear function f (X) for scoring the school neighborhood as below: env score = f (X) =α − ΣNi β′iXi (6)... we find that the R2 value between the estimated score of the risk of traffic congestion and the observed traffic congestion frequency around schools is 0.461 based on the least-square regression (see Fig. 8(a)), indicating that the scoring function (i.e., Eq."
The coefficients β′i in Eq. (6) come directly from Model 2, which was fitted by regressing the school-neighborhood congestion frequency (jam, Table 4) on the same built-environment variables. Thus env_score is an affine rescaling/reflection of Model 2's in-sample fitted values. The reported R²=0.461 is the correlation between those fitted values and the identical jam values used to estimate the coefficients; it is essentially the model's in-sample goodness-of-fit (adjusted R²=0.4524), not an independent test of a new score.
full rationale
The main Q1 result is an empirical generalized-ordered-logit marginal effect estimated directly from observed hourly congestion indices and school/workday/exam indicators; no fitted parameter is renamed as a prediction there, and the 8.34% claim, whatever its identification or interpretation problems, is not circular. The Model 2 coefficient table and SHAP explanations are also regression outputs rather than circular constructions. The only genuine circular step is the Section 5.1 scoring validation, where the 'env score' is built from the same fitted coefficients and then 'validated' against the same dependent variable used to fit them; the R²=0.461 therefore reduces to in-sample fit. This is partial circularity in a supporting policy-implication analysis, not in the core empirical derivation, so the score is 4 rather than higher. The one author-overlapping citation (Qin et al., 2020) is descriptive and not load-bearing; it does not contribute to circularity.
Assumptions & free parameters
free parameters (6)
- Bus stop threshold (5) =
>5 bus stops
- Population signaling threshold (10,000) =
>10,000 mobile signalings
- Building height threshold (6 stories) =
>6 stories
- Building mix thresholds (10% and 30%) =
new/old diff <10%; high/low diff <30%
- K-means cluster counts (4,3,3) =
10 scenescapes
- Env score intercept alpha = 14 =
14
assumptions (6)
- domain assumption 500 m buffer defines the school neighborhood and the scope of school-run congestion
- domain assumption Thursday morning of the Gaokao week is a valid counterfactual for Monday/Tuesday school mornings
- domain assumption Baidu traffic congestion index is an ordinal, comparable measure of congestion across roads and times
- domain assumption Places365-CNN scene probabilities and K-means scenescapes capture the built environment relevant to congestion
- domain assumption School neighborhoods are spatially independent observations
- ad hoc to paper The SHAP interaction model is specified (unstated)
Cite this review
Pith. "Pith review of Association between built environment characteristics and school run traffic congestion in Beijing, China." pith.science (2026). https://pith.science/paper/XAZE2WRU
@misc{pith2026241111390,
  author       = {Pith},
  title        = {Pith review of: Association between built environment characteristics and school run traffic congestion in Beijing, China},
  year         = {2026},
  howpublished = {\url{https://pith.science/paper/XAZE2WRU}},
  note         = {Machine review of arXiv:2411.11390}
}
read the original abstract
School-escorted trips are a significant contributor to traffic congestion. Existing studies mainly compare road traffic during student pick-up/drop-off hours with off-peak times, often overlooking the fact that school-run traffic congestion is unevenly distributed across areas with different built environment characteristics. We examine the relationship between the built environment and school-run traffic congestion, using Beijing, China, as a case study. First, we use multi-source geospatial data to assess the built environment characteristics around schools across five dimensions: spatial concentration, transportation infrastructure, street topology, spatial richness, and scenescapes. Second, employing a generalized ordered logit model, we analyze how traffic congestion around schools varies during peak hours on school days, regular non-school days, and national college entrance exam days. Lastly, we identify the built environment factors contributing to school-run traffic congestion through multivariable linear regression and Shapley value explanations. Our findings reveal that: (1) School runs significantly exacerbate traffic congestion around schools, reducing the likelihood of free-flow by 8.34\% during school run times; (2) School-run traffic congestion is more severe in areas with multiple schools, bus stops, and scenescapes related to business and financial functions. These insights can inform the planning of new schools and urban upgrade strategies aimed at reducing traffic congestion.
Figures


Figures from the paper (6 more)


Reference graph
Works this paper leans on
-
[1]
AnD2019 APACrefauthors An, D. , Tong, X. , Liu, K. \ Chan, E H. APACrefauthors \ 2019 . Understanding the impact of built environment on metro ridership using open source in Shanghai Understanding the impact of built environment on metro ridership using open source in shanghai . Cities 93 177-187 . APACrefURL https://www.sciencedirect.com/science/article/...
-
[2]
An2021 APACrefauthors An, F. , Liu, J. , Lu, W. \ Jareemit, D. APACrefauthors \ 2021 . A review of the effect of traffic-related air pollution around schools on student health and its mitigation A review of the effect of traffic-related air pollution around schools on student health and its mitigation . Journal of Transport & Health 23 101249 . APACrefURL...
arXiv 2021
-
[3]
AnR2022 APACrefauthors An, R. , Wu, Z. , Tong, Z. , Qin, S. , Zhu, Y. \ Liu, Y. APACrefauthors \ 2022 . How the built environment promotes public transportation in Wuhan: A multiscale geographically weighted regression analysis How the built environment promotes public transportation in Wuhan: A multiscale geographically weighted regression analysis . Tra...
-
[4]
Bao2023 APACrefauthors Bao, Z. , Ng, S T. , Yu, G. , Zhang, X. \ Ou, Y. APACrefauthors \ 2023 . The effect of the built environment on spatial-temporal pattern of traffic congestion in a satellite city in emerging economies The effect of the built environment on spatial-temporal pattern of traffic congestion in a satellite city in emerging economies . Dev...
arXiv 2023
-
[5]
Boakye2023 APACrefauthors Boakye, K. , Bovbjerg, M. , Schuna, J. , Branscum, A. , Mat-Nasir, N. , Bahonar, A. Hystad, P. APACrefauthors \ 2023 . Perceived built environment characteristics associated with walking and cycling across 355 communities in 21 countries Perceived built environment characteristics associated with walking and cycling across 355 co...
arXiv 2023
-
[6]
Cordts2016 APACrefauthors Cordts, M. , Omran, M. , Ramos, S. , Rehfeld, T. , Enzweiler, M. , Benenson, R. Schiele, B. APACrefauthors \ 2016 . The cityscapes dataset for semantic urban scene understanding The cityscapes dataset for semantic urban scene understanding . Proceedings of the IEEE conference on Computer Vision and Pattern Recognition Proceedings...
work page 2016
-
[7]
Dias2022 APACrefauthors Dias, C. , Abdullah, M. , Lovreglio, R. , Sachchithanantham, S. , Rekatheeban, M. \ Sathyaprasad, I. APACrefauthors \ 2022 . Exploring home-to-school trip mode choices in Kandy, Sri Lanka Exploring home-to-school trip mode choices in kandy, sri lanka . Journal of Transport Geography 99 103279 . APACrefURL https://www.sciencedirect....
-
[8]
Ding2023 APACrefauthors Ding, P. , Li, Y. , Feng, S. \ Pojani, D. APACrefauthors \ 2023 . Do long school commutes undermine teenagers' wellbeing? Evidence from a nation-wide survey in China Do long school commutes undermine teenagers' wellbeing? evidence from a nation-wide survey in china . Journal of Transport & Health 30 101605 . APACrefURL https://www....
arXiv 2023
Show all 46 references
-
[9]
, Naik, N
Dubey2016 APACrefauthors Dubey, A. , Naik, N. , Parikh, D. , Raskar, R. \ Hidalgo, C A. APACrefauthors \ 2016 . Deep Learning the City: Quantifying Urban Perception at a Global Scale Deep learning the city: Quantifying urban perception at a global scale . B. Leibe, J. Matas, N...
2016
-
[10]
\ Samimi, A
Ermagun2018 APACrefauthors Ermagun, A. \ Samimi, A. APACrefauthors \ 2018 . Mode choice and travel distance joint models in school trips Mode choice and travel distance joint models in school trips . Transportation 45 6 1755--1781 . APACrefDOI doi:10.1007/s11116-017-9794-y APACrefDOI
2018 doi
-
[11]
, Zhang, F
Fan2023a APACrefauthors Fan, Z. , Zhang, F. , Loo, B P Y. \ Ratti, C. APACrefauthors \ 2023 . Urban visual intelligence: Uncovering hidden city profiles with street view images Urban visual intelligence: Uncovering hidden city profiles with street view images . Proceedings of ...
2023 doi
-
[12]
, Wang, F
Feng2009 APACrefauthors Feng, J. , Wang, F. \ Zhou, Y. APACrefauthors \ 2009 . The spatial restructuring of population in metropolitan Beijing: Toward polycentricity in the post-reform era The spatial restructuring of population in metropolitan Beijing: Toward polycentricity i...
2009 doi
-
[13]
, Wang, Y
Gao2013 APACrefauthors Gao, S. , Wang, Y. , Gao, Y. \ Liu, Y. APACrefauthors \ 2013 . Understanding urban traffic-flow characteristics: a rethinking of betweenness centrality Understanding urban traffic-flow characteristics: a rethinking of betweenness centrality . Environment...
2013
-
[14]
\ Giuliano, G
He2017 APACrefauthors He, S Y. \ Giuliano, G. APACrefauthors \ 2017 . Factors affecting children's journeys to school: a joint escort-mode choice model Factors affecting children's journeys to school: a joint escort-mode choice model . Transportation 44 1 199--224 . APACrefDOI...
2017 doi
-
[15]
APACrefauthors \ 1961
Jacobs1961 APACrefauthors Jacobs, J. APACrefauthors \ 1961 . The death and life of great American cities The death and life of great american cities . New York Random House
1961
-
[16]
\ Wang, H
Jiao2023 APACrefauthors Jiao, J. \ Wang, H. APACrefauthors \ 2023 . Forecasting traffic speed during daytime from Google Street View images using deep learning Forecasting traffic speed during daytime from google street view images using deep learning . Transportation Research...
2023
-
[17]
, Sarmiento, O L
Larouche2015 APACrefauthors Larouche, R. , Sarmiento, O L. , Broyles, S T. , Denstel, K D. , Church, T S. , Barreira, T V. Katzmarzyk, P T. APACrefauthors \ 2015 . Are the correlates of active school transport context-specific? Are the correlates of active school transport con...
2015 doi
-
[18]
, Sun, C
Lu2017 APACrefauthors Lu, M. , Sun, C. \ Zheng, S. APACrefauthors \ 2017 . Congestion and pollution consequences of driving-to-school trips: A case study in Beijing Congestion and pollution consequences of driving-to-school trips: A case study in Beijing . Transportation Resea...
2017 doi
-
[19]
\ Lee, S I
Lundberg2017 APACrefauthors Lundberg, S M. \ Lee, S I. APACrefauthors \ 2017 . A Unified Approach to Interpreting Model Predictions A unified approach to interpreting model predictions . I. Guyon\ . \ ( ), Advances in Neural Information Processing Systems Advances in neural in...
2017
-
[20]
, Shi, W
Ma2024 APACrefauthors Ma, L. , Shi, W. , Huang, Y. \ Lin, J. APACrefauthors \ 2024 . Active school travel in China: Unveiling multifaceted influences for sustainable mobility Active school travel in china: Unveiling multifaceted influences for sustainable mobility . Transporta...
2024
-
[21]
, Brown, A L
Mcdonald2011 APACrefauthors McDonald, N C. , Brown, A L. , Marchetti, L M. \ Pedroso, M S. APACrefauthors \ 2011 . U.S. School travel, 2009: An assessment of trends U.S. School travel, 2009: An assessment of trends . American Journal of Preventive Medicine 41 2 146--151 . APAC...
2011 doi
-
[22]
, Tscharaktschiew, S
Muller2008 APACrefauthors M \"u ller, S. , Tscharaktschiew, S. \ Haase, K. APACrefauthors \ 2008 . Travel-to-school mode choice modelling and patterns of school choice in urban areas Travel-to-school mode choice modelling and patterns of school choice in urban areas . Journal ...
2008 doi
-
[23]
, Rosenberg, M W
Nabipour2022 APACrefauthors Nabipour, M. , Rosenberg, M W. \ Nasseri, S H. APACrefauthors \ 2022 . The built environment, networks design, and safety features: An analysis of pedestrian commuting behavior in intermediate-sized cities The built environment, networks design, and...
2022 doi
-
[24]
, Sun, J
Nian2021 APACrefauthors Nian, G. , Sun, J. \ Huang, J. APACrefauthors \ 2021 . Exploring the effects of urban built environment on road travel speed variability with a spatial panel data model Exploring the effects of urban built environment on road travel speed variability wi...
2021 doi
-
[25]
, Chen, S
Pan2020 APACrefauthors Pan, Y. , Chen, S. , Niu, S. , Ma, Y. \ Tang, K. APACrefauthors \ 2020 . Investigating the impacts of built environment on traffic states incorporating spatial heterogeneity Investigating the impacts of built environment on traffic states incorporating s...
2020
-
[26]
Qin2020 APACrefauthors Qin, K. , Xu, Y. , Kang, C. \ Kwan, M P. APACrefauthors \ 2020 . A graph convolutional network model for evaluating potential congestion spots based on local urban built environments A graph convolutional network model for evaluating potential congestion...
2020 doi
-
[27]
, Zhang, Z
Qiu2022 APACrefauthors Qiu, W. , Zhang, Z. , Liu, X. , Li, W. , Li, X. , Xu, X. \ Huang, X. APACrefauthors \ 2022 . Subjective or objective measures of street environment, which are more effective in explaining housing prices? Subjective or objective measures of street environ...
2022
-
[28]
, Buliung, R
Rothman2017 APACrefauthors Rothman, L. , Buliung, R. , Howard, A. , Macarthur, C. \ Macpherson, A. APACrefauthors \ 2017 . The school environment and student car drop-off at elementary schools The school environment and student car drop-off at elementary schools . Travel Behav...
2017 doi
-
[29]
, Macarthur, C
Rothman2014 APACrefauthors Rothman, L. , Macarthur, C. , To, T. , Buliung, R. \ Howard, A. APACrefauthors \ 2014 . Motor vehicle-pedestrian collisions and walking to school: The role of the built environment Motor vehicle-pedestrian collisions and walking to school: The role o...
2014 doi
-
[30]
APACrefauthors \ 2012
Salesses2012 APACrefauthors Salesses, M P. APACrefauthors \ 2012 . \ Place Pulse: Measuring the collaborative image of the city Place pulse: Measuring the collaborative image of the city \ . \ Massachusetts Institute of Technology
2012
-
[31]
\ Clark, T N
Silver2016 APACrefauthors Silver, D A. \ Clark, T N. APACrefauthors \ 2016 . Scenescapes: How qualities of place shape social life Scenescapes: How qualities of place shape social life . University of Chicago Press
2016
-
[32]
\ Vasudevan, V
Singh2018 APACrefauthors Singh, N. \ Vasudevan, V. APACrefauthors \ 2018 . Understanding school trip mode choice -- The case of Kanpur (India) Understanding school trip mode choice -- The case of Kanpur (India) . Journal of Transport Geography 66 May 2017 283--290 . APACrefURL...
2018 doi
-
[33]
, Zhao, C
Song2019 APACrefauthors Song, J. , Zhao, C. , Zhong, S. , Nielsen, T A S. \ Prishchepov, A V. APACrefauthors \ 2019 . Mapping spatio-temporal patterns and detecting the factors of traffic congestion with multi-source data fusion and mining techniques Mapping spatio-temporal pa...
2019
-
[34]
, Guo, D
Sun2021 APACrefauthors Sun, W. , Guo, D. , Li, Q. \ Fang, H. APACrefauthors \ 2021 . School runs and urban traffic congestion: Evidence from China School runs and urban traffic congestion: Evidence from China . Regional Science and Urban Economics 86 October 2020 103606 . APAC...
2021
-
[35]
\ Yamu, C
Van2021 APACrefauthors Van Nes, A. \ Yamu, C. APACrefauthors \ 2021 . Introduction to space syntax in urban studies Introduction to space syntax in urban studies . Springer Nature
2021
-
[36]
, Quddus, M
VanRistell2013 APACrefauthors Van Ristell, J. , Quddus, M. , Enoch, M. , Wang, C. \ Hardy, P. APACrefauthors \ 2013 . Quantifying the transport-related impacts of parental school choice in England Quantifying the transport-related impacts of parental school choice in england ....
2013 doi
-
[37]
APACrefauthors \ 2016
Williams2016 APACrefauthors Williams, R. APACrefauthors \ 2016 . Understanding and interpreting generalized ordered logit models Understanding and interpreting generalized ordered logit models . Journal of Mathematical Sociology 40 1 7--20 . APACrefDOI doi:10.1080/0022250X.201...
2016
-
[38]
\ Srinivasan, S
Yarlagadda2008 APACrefauthors Yarlagadda, A K. \ Srinivasan, S. APACrefauthors \ 2008 . Modeling children's school travel mode and parental escort decisions Modeling children's school travel mode and parental escort decisions . Transportation 35 2 201--218 . APACrefDOI doi:10....
2008 doi
-
[39]
\ Liu, Y
Yu2011 APACrefauthors Yu, L. \ Liu, Y. APACrefauthors \ 2011 oct . Traffic characteristics analysis and suggestions on school bus operation for primary school students in Beijing Traffic characteristics analysis and suggestions on school bus operation for primary school studen...
2011
-
[40]
, Zhuang, Y
Yue2017 APACrefauthors Yue, Y. , Zhuang, Y. , Yeh, A G O. , Xie, J Y. , Ma, C L. \ Li, Q Q. APACrefauthors \ 2017 . Measurements of POI-based mixed use and their relationships with neighbourhood vibrancy Measurements of poi-based mixed use and their relationships with neighbou...
2017
-
[41]
Zhang2019a APACrefauthors Zhang, F. , Wu, L. , Zhu, D. \ Liu, Y. APACrefauthors \ 2019 . Social sensing from street-level imagery: A case study in learning spatio-temporal urban mobility patterns Social sensing from street-level imagery: A case study in learning spatio-tempora...
2019 doi
-
[42]
, Yao, E
Zhang2017a APACrefauthors Zhang, R. , Yao, E. \ Liu, Z. APACrefauthors \ 2017 . School travel mode choice in Beijing, China School travel mode choice in Beijing, China . Journal of Transport Geography 62 June 98--110 . APACrefURL http://dx.doi.org/10.1016/j.jtrangeo.2017.06.00...
2017 doi
-
[43]
, Shi, J
Zhao2017 APACrefauthors Zhao, H. , Shi, J. , Qi, X. , Wang, X. \ Jia, J. APACrefauthors \ 2017 . Pyramid scene parsing network Pyramid scene parsing network . Proceedings of the IEEE conference on computer vision and pattern recognition Proceedings of the ieee conference on co...
2017
-
[44]
Zheng2016 APACrefauthors Zheng, S. , Hu, W. \ Wang, R. APACrefauthors \ 2016 . How much is a good school worth in Beijing? Identifying price premium with paired resale and rental data How much is a good school worth in Beijing? Identifying price premium with paired resale and ...
2016 doi
-
[45]
, Lapedriza, A
Zhou2018 APACrefauthors Zhou, B. , Lapedriza, A. , Khosla, A. , Oliva, A. \ Torralba, A. APACrefauthors \ 2018 . Places: A 10 million image database for scene recognition Places: A 10 million image database for scene recognition . IEEE Transactions on Pattern Analysis and Mach...
2018
-
[46]
, Zhao, H
Zhou2017 APACrefauthors Zhou, B. , Zhao, H. , Puig, X. , Fidler, S. , Barriuso, A. \ Torralba, A. APACrefauthors \ 2017 . Scene parsing through ade20k dataset Scene parsing through ade20k dataset . Proceedings of the IEEE conference on computer vision and pattern recognition P...
2017
Reviewed August 12, 2026 · model on record in the stance chip above.
Discussion (0). Continue with ORCID to comment.