REVIEW 4 major objections 5 minor 3 references
PointSSIM: A novel low dimensional resolution invariant image-to-image comparison metric
T0 review · 4 major / 5 minor · reviewed 2026-08-06 · deepseek-v4-flash
Pith's one-line read A new metric, PointSSIM, compares binary images of different resolutions by turning each image into a small set of anchor points and comparing four structural summaries, without any pixel-to-pixel matching.
desk verdict A sensible combination of known morphology and point-pattern tools, but the resolution-invariance claim is not actually tested and the metric's own redundancy is overlooked. read the letter →
The pith
A machine-rendered reading of the paper's core claim, the machinery that carries it, and where it could break.
The reading
What carries the argument
The object that carries the argument is the marked point-process representation of the image. Anchor points are the locally adaptive maxima of the minimal distance transform: grid cells whose distance to the nearest zero-valued pixel is maximal among their eight neighbors, with the extra condition that no two anchor points are closer to each other than to the edge of the object. Each anchor point carries two marks, the radius of the largest inscribed circle centered at the point and the label of the connected component it belongs to. This representation compresses the image from as many cells as the grid has to a small set of point coordinates plus marks, and all four PointSSIM measures (intensity, area coverage, heterogeneity, and spatial irregularity) are computed from it.
What would settle it
Take a binary image containing two distinct objects separated by a one-pixel gap and compare PointSSIM for the same scene rendered at 256x256 and at 1024x1024. If the gap closes at low resolution, the low-resolution version has one connected object instead of two, so V3 (anchor points per object) roughly doubles or halves, and the scatter point falls far off the identity line. A single such image pair where V1 or V3 deviates by a large margin between resolutions would falsify the resolution-invariance claim in a concrete, checkable case.
Extended reading notes
Core claim
The central claim is that the structure of a binary image can be captured by the locally adaptive maxima of its minimal distance transform, and that comparing the resulting marked point processes is a valid, resolution-invariant way to compare images. The paper argues that this representation bypasses pixel-to-pixel correspondence, which is what makes pixel-based metrics like MSE and SSIM resolution-dependent. PointSSIM is defined as the normalized inverse Euclidean distance between the four summary vectors of the two images; a value near 1 means the images have nearly identical point-process summaries, near 0 means they differ strongly. The paper reports that on five synthetic classes of binary images, PointSSIM separates the classes more sharply than SSIM, MSE, or MS-SSIM, and that its measures remain largely stable when the same scene is generated at 256x256, 512x512, and 1024x1024 resolutions.
Load-bearing premise
The whole resolution-invariance argument depends on the anchor points of an object being essentially unchanged when the image is rescaled; but low-resolution images merge nearby objects and produce fewer local maxima, so the count-based measures V1 and V3 drift.
Editorial extensions
If this is right
- Two binary images no longer need the same pixel dimensions: PointSSIM gives a similarity score for any pair of resolutions, e.g., 256x256 against 1024x1024.
- Rotation of the input image leaves the four measures essentially unchanged, so comparisons do not require alignment.
- The four-measure vector can be used as a cheap, interpretable descriptor for classification or clustering of binary images.
- PointSSIM can be plugged into generative-model training as a structural regularization term alongside pixel-level losses.
- The method extends naturally to any task where binary maps from different sources or grid spacings must be compared, such as geological realizations.
Reading between the lines
- Because the anchor points are essentially skeletal points of the distance transform, PointSSIM is measuring a scale-space skeleton summary; it could be viewed as a low-dimensional signature of the image's medial axis, a connection the paper does not draw.
- The same anchor-point machinery could be generalized to grayscale images by replacing the binary distance transform with a morphological gradient or intensity ridge detection; the paper only suggests gradients in passing, so this is an extension, not a claim.
- A likely failure mode beyond the paper's own note: images that differ only by curvature or fine texture will be conflated, since the four measures ignore local shape; a test would be PointSSIM between straight and curved objects of equal area, which the paper's own figures suggest are not separated.
- The variance-irregularity measure V4 uses 100 square subregions; the choice of grid partition is fixed, and a resolution change alters the physical size of these subregions, which may itself shift V4 even without smoothing effects.
Signed reviews
Editorial analysis
A structured set of objections, weighed in public.
Referee Report
Summary. The manuscript proposes PointSSIM, a four-dimensional summary metric for binary images. Each image is first reduced to 'anchor points' (local maxima of the Euclidean distance transform after a local-adaptivity filter) with marks for radius and object label; the proposed metric then compares images via four scalar measures: anchor count (V1), area coverage (V2), anchor points per object (V3), and spatial variance irregularity (V4). PointSSIM is claimed to be resolution and rotation invariant, and it is benchmarked against SSIM, MSE, and MS-SSIM on five simulated image families, including a three-resolution experiment. The paper argues that the point-process compression avoids pixel-to-pixel correspondence and improves between-class discrimination.
Significance. If the invariance claims could be supported, PointSSIM would be a lightweight and interpretable descriptor for comparing segmented and binary images across scales, which is relevant for geostatistical simulation and structural image analysis. The algorithmic pipeline is clearly specified and the four measures are easy to compute. However, the paper's central promise - resolution invariance - rests on an unproven and partially incorrect relationship between the distance-transform anchors across resolutions, and the rotation invariance of V4 is not established. The reported dataset comparisons are suggestive but do not yet quantify the key property.
major comments (4)
- [Section II.A/B, Eq. (8)] As currently defined, V2 is not invariant under resolution rescaling. The radius mark A^r in Eq. (5) is the raw distance-transform value in pixel units, and the denominator Lx*Ly in Eq. (8) is the size of the common base coordinate system, which for two differently sized images is the minimum of the two image dimensions. If the same scene is rendered at twice the resolution, A^r approximately doubles, the sum of squared radii quadruples, while Lx*Ly is unchanged, so V2 does not approximate the same value. Please convert the radii to physical units by multiplying by the cell size, or use each image's own area as the denominator, and rerun the resolution experiment with the corrected definition.
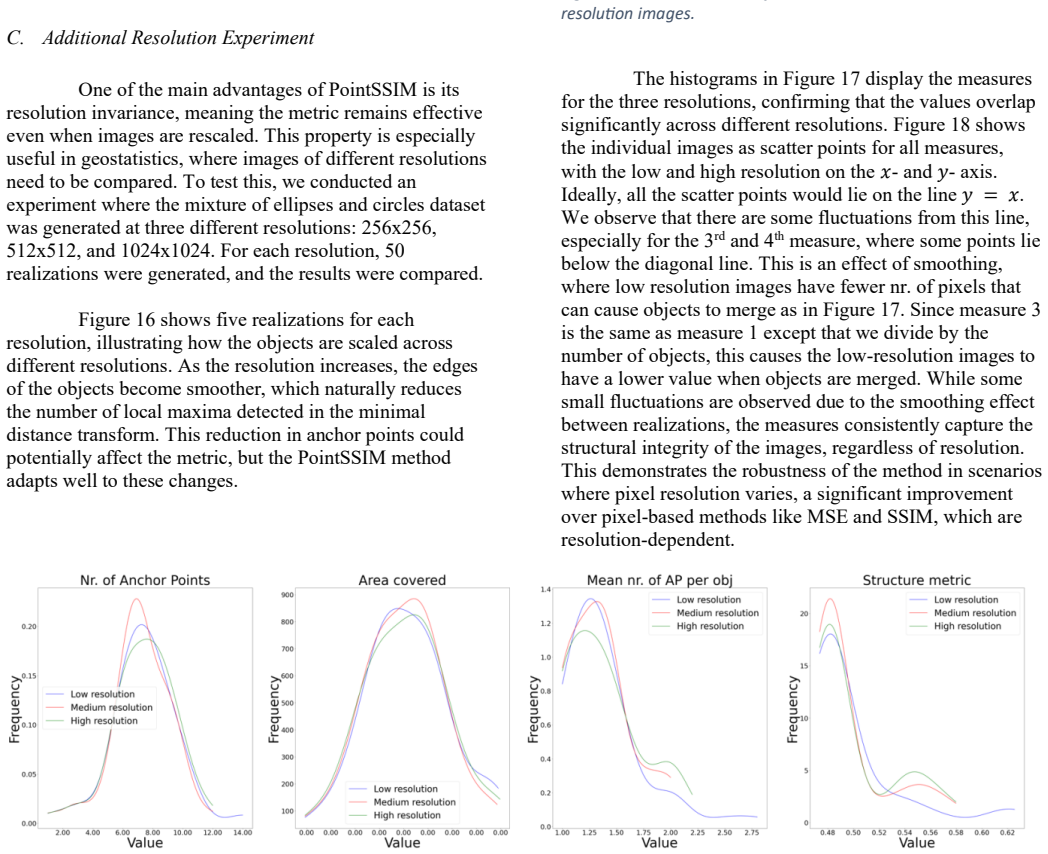
- [Section III.C, Figures 17-18] The resolution experiment compares 50 independent realizations generated at 256, 512, and 1024 pixels, not the same image downsampled or upsampled. The histograms and scatter around the identity line therefore measure distributional overlap between two ensembles, not whether the descriptor of a fixed scene is stable under rescaling. The text admits that V3 and V4 drift below the diagonal because of object merging at low resolution, and Section I concedes 'slight sensitivity to scale' without a bound. To support the headline property, report PointSSIM(x, rescaled(x)) and per-measure drift for fixed images across scale factors, together with a stated tolerance or operating range.
- [Section II.C, Eq. (10)] The fourth measure V4 is not rotation invariant as implemented. It partitions the domain into 10x10 axis-aligned quadratic subregions and counts anchor points per subregion; a rotation of the image relative to this fixed grid will generally change the counts and therefore V4. Since Section I claims that 'the measure comparison is rotation invariant', please test V4 on rotated versions of the same image or redefine the measure so that the subregions rotate with the image.
- [Section III.B and Eq. (9)] The claim in Section III.B that the four measures are 'not redundant' is contradicted by Eq. (9), which defines V3 = V1 / max(A_l), and by the paper's own statement in Section III.C that 'measure 3 is the same as measure 1 except that we divide by the number of objects'. V3 is a deterministic function of V1 and the object count, so weak correlation in the scatterplot of Figure 14 does not establish that the measures are independent. Please qualify this claim and consider reporting the object count separately if the descriptor is meant to be non-redundant.
minor comments (5)
- [Equation (11)] Equation (11) is garbled and ambiguous as typeset; please rewrite it with an explicit opening parenthesis and state how the metric behaves when max(Vi(x1), Vi(x2)) = 0.
- [Equation (10)] Equation (10) is used for both V4 and for s^2; please renumber the second equation.
- [Figure callouts] Several figure callouts do not match the displayed figure numbers, for example the text refers to Figure 14 when the displayed panel is labeled Figure 13, and to Figure 8 when the displayed panel is labeled Figure 7.
- [Section II.C, V4 subregions] The choice of 100 subregions for V4 is justified only by 'seems to work well empirically'; a short sensitivity analysis over the number of subregions would make the method more robust.
- [Reproducibility] No code or data are provided, so the numerical results in Figures 15-18 cannot be reproduced; including them would strengthen the paper.
Circularity Check
No circularity: PointSSIM's measures and metric are defined from image content without fitting, and benchmarks are external; resolution-invariance validation gap is not circularity.
full rationale
The PointSSIM derivation is self-contained. Anchor points are defined via the distance transform (Eq. 1), local maxima (Eq. 2), and adaptive pruning (Eq. 3); the marked point-process representation follows from Eqs. 4-6; the four measures are explicit functions of the image content (Eqs. 7-10); and the final metric (Eq. 11) is a normalized Euclidean distance over these measures. No parameter is fitted to a target output, and no prediction is made from a fitted subset of the data. The evaluation is comparative, against external metrics SSIM, MSE, and MS-SSIM, using independently generated realizations. The paper acknowledges tuning heuristics such as the 8-neighborhood and the 100 subregions for V4, and even admits the measure choices are 'somewhat arbitrary,' but these are design decisions, not circular reductions. The resolution-invariance claim is not fully established by the Section III.C experiment, which compares independent realizations at different resolutions rather than an image against its own rescaling, and the text concedes 'slight sensitivity to scale'; however, this is a validation gap, not a self-referential derivation. Self-citations to prior geostatistics work are background references and do not carry the load-bearing argument. Therefore no circular step is present.
Assumptions & free parameters
free parameters (2)
- number of subregions for V4 =
100 (10x10 grid)
- neighborhood template size =
8-point (with diagonals)
assumptions (4)
- domain assumption Local maxima of the distance transform form a sufficient representation of object structure for binary image comparison.
- domain assumption The four chosen summary statistics (anchor count, area coverage, anchor points per object, spatial variance irregularity) are adequate to capture the structural differences of interest.
- ad hoc to paper The Euclidean distance between images in the 4-dimensional measure space defines a meaningful similarity, with max normalization giving balanced contributions.
- domain assumption The distribution of anchor points can be compared to a homogeneous Poisson process to quantify clustering (V4).
invented entities (1)
-
Anchor points
Cite this review
Pith. "Pith review of PointSSIM: A novel low dimensional resolution invariant image-to-image comparison metric." pith.science (2026). https://pith.science/paper/XGERVMKH
@misc{pith2026250623833,
  author       = {Pith},
  title        = {Pith review of: PointSSIM: A novel low dimensional resolution invariant image-to-image comparison metric},
  year         = {2026},
  howpublished = {\url{https://pith.science/paper/XGERVMKH}},
  note         = {Machine review of arXiv:2506.23833}
}
read the original abstract
This paper presents PointSSIM, a novel low-dimensional image-to-image comparison metric that is resolution invariant. Drawing inspiration from the structural similarity index measure and mathematical morphology, PointSSIM enables robust comparison across binary images of varying resolutions by transforming them into marked point pattern representations. The key features of the image, referred to as anchor points, are extracted from binary images by identifying locally adaptive maxima from the minimal distance transform. Image comparisons are then performed using a summary vector, capturing intensity, connectivity, complexity, and structural attributes. Results show that this approach provides an efficient and reliable method for image comparison, particularly suited to applications requiring structural analysis across different resolutions.
Figures


Figures from the paper (2 more)

Reference graph
Works this paper leans on
-
[1]
Banerji, A. (2000). An introduction to image analysis using mathematical morphology. In IEEE Engineering in Medicine and Biology Magazine (Vol. 19, Issue 4). Boisvert, J. B., Pyrcz, M. J., & Deutsch, C. V. (2010). Multiple point metrics to assess categorical variable models. Natural Resources Research, 19(3). https://doi.org/10.1007/s11053-010-9120-2 Brun...
-
[2]
https://doi.org/10.1109/acssc.2003.1292216 Zuo, C., Li, Z., Dai, Z., Wang, X., & Wang, Y. (2023). A Pattern Classification Distribution Method for Geostatistical Modeling Evaluation and Uncertainty Quantification. Remote Sensing, 15(11). https://doi.org/10.3390/rs15112708 Zuo, C., Pan, Z., Gao, Z., & Gao, J. (2019). Correlation- driven direct sampling met...
arXiv 2023
-
[15]
Pyrcz and Deutsch (2014): Geostatistical Reservoir Modeling. Oxford University Press, USA. Grammer, G. M., Harris, P. M. “Mitch,” & Eberli, G. P. (2020). Multiple-point Geostatistics. In Integration of Outcrop and Modern Analogs in Reservoir Modeling. https://doi.org/10.1306/m80924c18 Honarkhah, M., & Caers, J. (2010). Stochastic simulation of patterns us...
Reviewed August 6, 2026 · model on record in the stance chip above.
Discussion (0). Continue with ORCID to comment.