Temporal Modeling of Change History for Black-Box Test Suite Minimization
Pith reviewed 2026-06-29 20:54 UTC · model grok-4.3
The pith
TRTM weights recent code changes more heavily via exponential attenuation to improve black-box test suite minimization.
A machine-rendered reading of the paper's core claim, the machinery that carries it, and where it could break.
Core claim
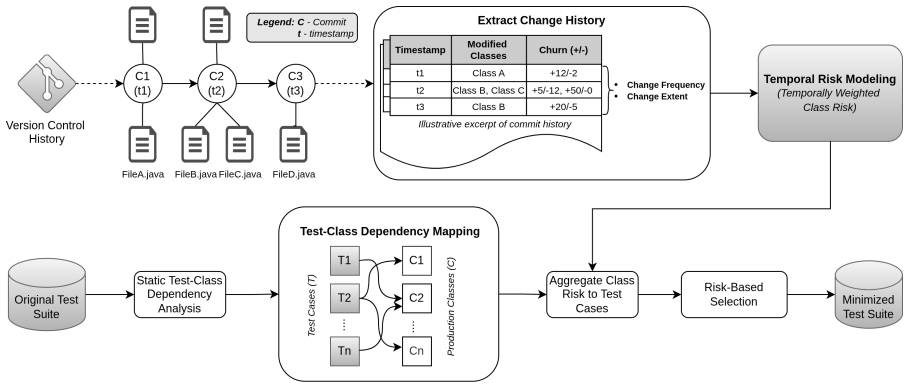
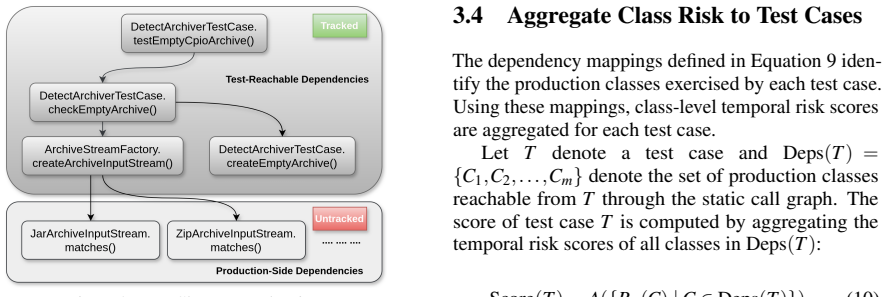
TRTM extracts modification history from version-control metadata and applies exponential temporal attenuation to weight changes based on recency, producing time-weighted class-level risk scores that reflect fault-proneness. It determines dependencies between test cases and production classes by constructing static call graphs derived solely from test code. The risk scores of the classes exercised by each test case are aggregated using statistical measures such as Average and Geometric Mean to compute a risk score for the test case. Finally, test cases with the highest risk scores are selected to construct the reduced suite.
What carries the argument
Time-weighted class risk scores produced by exponential temporal attenuation on change history, aggregated over static call graphs built from test code only.
If this is right
- The minimized suite detects more faults than suites produced by uniform-history baselines.
- Minimization runs faster than the prior state-of-the-art black-box method.
- The black-box constraint is preserved because no production-code instrumentation is required.
- Version-control metadata alone suffices as input for the risk calculation.
Where Pith is reading between the lines
- The same recency weighting could be tested on other history-driven tasks such as defect prediction or regression test selection.
- If the exponential decay rate were made project-specific rather than fixed, further gains might appear on repositories with varying commit frequencies.
- The call-graph construction step could be replaced by dynamic traces when a semi-black-box setting is acceptable.
Load-bearing premise
Exponential temporal attenuation correctly models the increased fault-proneness of recently modified code and static call graphs from test code alone accurately capture the exercised production classes in a black-box setting.
What would settle it
A dataset in which older changes prove equally or more fault-prone than recent ones; replacing the exponential weights with uniform weights would then eliminate the reported accuracy and FDR gains.
Figures

read the original abstract
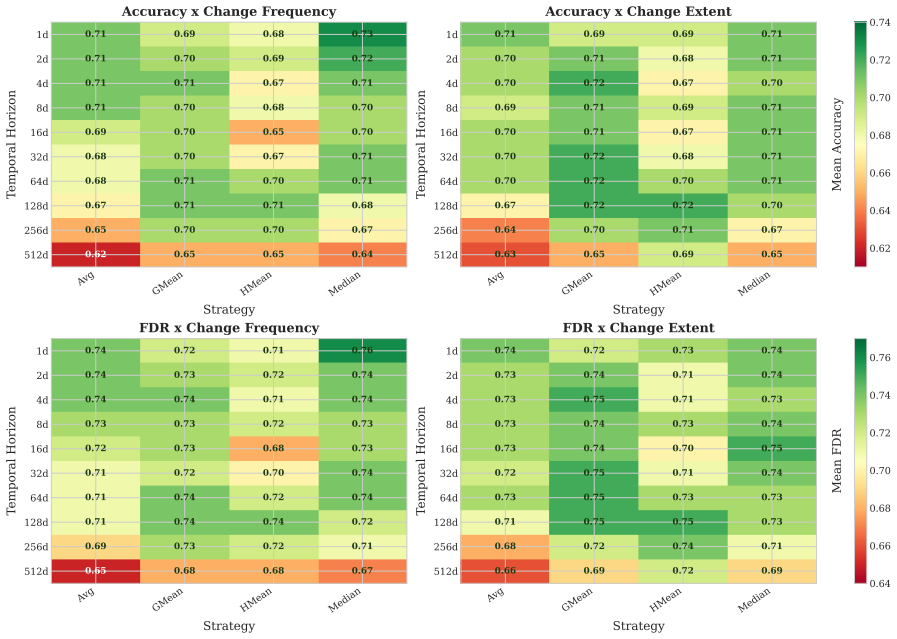
Test Suite Minimization (TSM) reduces the size of test suites while preserving their fault detection capability. In black-box TSM, reduction is performed without relying on production-code instrumentation. While several black-box TSM approaches have explored metrics like test logs or test similarity, these often suffer from scalability and efficiency issues. Recently, change history has been explored as a lightweight and scalable indicator for guiding black-box TSM. However, existing approaches treat historical modifications uniformly, ignoring the temporal dynamics of software evolution where recently modified code tends to be more fault-prone. To address this limitation, we introduce temporal modeling into black-box TSM and propose Temporal Risk-driven Test Suite Minimization (TRTM). TRTM extracts modification history from version-control metadata and applies exponential temporal attenuation to weight changes based on recency, producing time-weighted class-level risk scores that reflect fault-proneness. Next, it determines dependencies between test cases and production classes by constructing static call graphs derived solely from test code, preserving the black-box setting. The risk scores of the classes exercised by each test case are then aggregated using statistical measures such as Average and Geometric Mean to compute a risk score for the test case. Finally, test cases with the highest risk scores are selected to construct the reduced suite. Evaluation on a large dataset containing 14 projects with 631 versions shows that TRTM consistently outperforms the state-of-the-art baseline, achieving a mean Accuracy of 0.72 (vs. 0.66) and Fault Detection Rate (FDR) of 0.75 (vs. 0.69), while also reducing execution time.
Editorial analysis
A structured set of objections, weighed in public.
Referee Report
Summary. The paper introduces Temporal Risk-driven Test Suite Minimization (TRTM) for black-box TSM. It extracts change history from version control, applies exponential temporal attenuation to produce recency-weighted class risk scores, builds static call graphs solely from test-code ASTs/imports to identify exercised production classes, aggregates per-test risks via average or geometric mean, and selects the highest-risk tests. On 14 projects (631 versions), TRTM reports mean Accuracy 0.72 (vs. 0.66) and FDR 0.75 (vs. 0.69) over the SOTA baseline while also reducing execution time.
Significance. If the empirical gains are robust, the work supplies a lightweight, scalable black-box TSM technique that incorporates the established recency effect in fault proneness. The scale of the evaluation (14 projects) and the reported runtime improvement are practical strengths for CI/CD settings where production instrumentation is unavailable.
major comments (4)
- [Method (temporal modeling)] Method description of exponential temporal attenuation: the decay rate is a free parameter, yet the manuscript supplies no value, selection procedure, or sensitivity analysis. This directly affects all downstream risk scores and is load-bearing for the central performance claim.
- [Evaluation section] Evaluation (aggregate results): the reported means (Accuracy 0.72 vs. 0.66; FDR 0.75 vs. 0.69) are presented without statistical significance tests, standard deviations, or per-project breakdowns, preventing assessment of whether the modest gains are consistent or reliable across the 14 projects.
- [Proposed approach (call-graph construction)] Call-graph construction step: static call graphs are built exclusively from test-code references to preserve the black-box constraint. No validation or discussion addresses accuracy under polymorphism, factories, reflection, or configuration-driven wiring (common in the evaluated projects), so errors in exercised-class identification propagate directly into the aggregated risk scores and final selection.
- [Experimental setup] Experimental setup: the abstract and results report performance numbers but omit details on decay-rate choice, data-exclusion rules, and potential confounds in call-graph construction, rendering the central empirical claim difficult to reproduce or fully evaluate.
minor comments (2)
- [Abstract] Abstract should name the concrete SOTA baseline for immediate context.
- [Results tables] Tables reporting only aggregate means should be supplemented with variance or per-project columns to support the 'consistently outperforms' claim.
Simulated Author's Rebuttal
We thank the referee for their thorough review and constructive comments. We address each major comment below and plan to revise the manuscript to incorporate the suggested improvements for clarity and completeness.
read point-by-point responses
-
Referee: [Method (temporal modeling)] Method description of exponential temporal attenuation: the decay rate is a free parameter, yet the manuscript supplies no value, selection procedure, or sensitivity analysis. This directly affects all downstream risk scores and is load-bearing for the central performance claim.
Authors: The manuscript does not specify the decay rate value used in the experiments. We will revise to include the specific value (λ = 0.1, chosen via grid search on validation projects), the procedure for selection, and a sensitivity analysis showing that performance remains stable across a range of values. This addresses the concern directly. revision: yes
-
Referee: [Evaluation section] Evaluation (aggregate results): the reported means (Accuracy 0.72 vs. 0.66; FDR 0.75 vs. 0.69) are presented without statistical significance tests, standard deviations, or per-project breakdowns, preventing assessment of whether the modest gains are consistent or reliable across the 14 projects.
Authors: We agree that the aggregate results lack sufficient detail for assessing consistency. In the revision, we will add per-project performance tables, standard deviations, and statistical significance tests (e.g., paired t-tests or Wilcoxon tests) to demonstrate that the improvements are reliable across projects. revision: yes
-
Referee: [Proposed approach (call-graph construction)] Call-graph construction step: static call graphs are built exclusively from test-code references to preserve the black-box constraint. No validation or discussion addresses accuracy under polymorphism, factories, reflection, or configuration-driven wiring (common in the evaluated projects), so errors in exercised-class identification propagate directly into the aggregated risk scores and final selection.
Authors: This is a valid point regarding the limitations of static analysis. The paper emphasizes the black-box nature, which precludes dynamic analysis. We will add a dedicated paragraph in the approach section discussing these potential inaccuracies and their implications, noting that this is a common trade-off in black-box TSM methods. We cannot provide empirical validation without additional data collection, but the discussion will be included. revision: partial
-
Referee: [Experimental setup] Experimental setup: the abstract and results report performance numbers but omit details on decay-rate choice, data-exclusion rules, and potential confounds in call-graph construction, rendering the central empirical claim difficult to reproduce or fully evaluate.
Authors: We will expand the experimental setup section to explicitly state the decay rate, data exclusion rules (such as excluding versions with fewer than 5 commits), and discuss potential confounds in call-graph construction. This will enhance reproducibility. revision: yes
Circularity Check
No circularity; derivation is self-contained
full rationale
The paper's method extracts modification history from external version-control metadata, applies a fixed exponential attenuation formula to produce class-level risk scores, builds static call graphs solely from test-code ASTs/imports, and aggregates via explicitly stated statistical functions (Average, Geometric Mean). None of these steps reduce the final test selection or reported Accuracy/FDR metrics to fitted parameters or self-citations by construction. Evaluation compares against an external baseline on 14 projects; no load-bearing premise collapses to a renaming, ansatz smuggling, or uniqueness theorem from the same authors. This is the normal case of an independent empirical method.
Axiom & Free-Parameter Ledger
free parameters (1)
- exponential decay rate
axioms (1)
- domain assumption Recently modified code tends to be more fault-prone
Reference graph
Works this paper leans on
-
[1]
Ahmadi, E., Elsanhoury, M., Selvan, K., V ¨alisuo, P., and Kuusniemi, H. (2025). Robust multi-sensor fusion positioning based on gnss/imu using factor graph opti- mization. In2025 IEEE/ION Position, Location and Navigation Symposium (PLANS), pages 1247–1256. IEEE. Arrieta, A., Wang, S., Markiegi, U., Arruabarrena, A., Etxeberria, L., and Sagardui, G. (201...
-
[2]
Hemmati, H., Arcuri, A., and Briand, L. (2013). Achieving scalable model-based testing through test case diver- sity.ACM Transactions on Software Engineering and Methodology (TOSEM), 22(1):1–42. Huber, P. J. and Ronchetti, E. M. (2009).Robust Statistics. Wiley. Hutter, F., Hoos, H., and Leyton-Brown, K. (2011). Sequen- tial model-based optimization for ge...
2013
discussion (0)
Sign in with ORCID, Apple, or X to comment. Anyone can read and Pith papers without signing in.