REVIEW 3 major objections 7 minor 56 references
FRELLED Reloaded: Multiple techniques for astronomical data visualisation in Blender
T0 review · 3 major / 7 minor · reviewed 2026-08-10 · deepseek-v4-flash
Pith's one-line read FRELLED 5.0, a Blender FITS viewer, loads radio cubes faster and adds isosurfaces and VR.
desk verdict A solid, honest tool paper that deserves refereeing, but the printed opacity formula in Sec. 2.1 is mathematically wrong and must be fixed before publication. read the letter →
The pith
A machine-rendered reading of the paper's core claim, the machinery that carries it, and where it could break.
The reading
What carries the argument
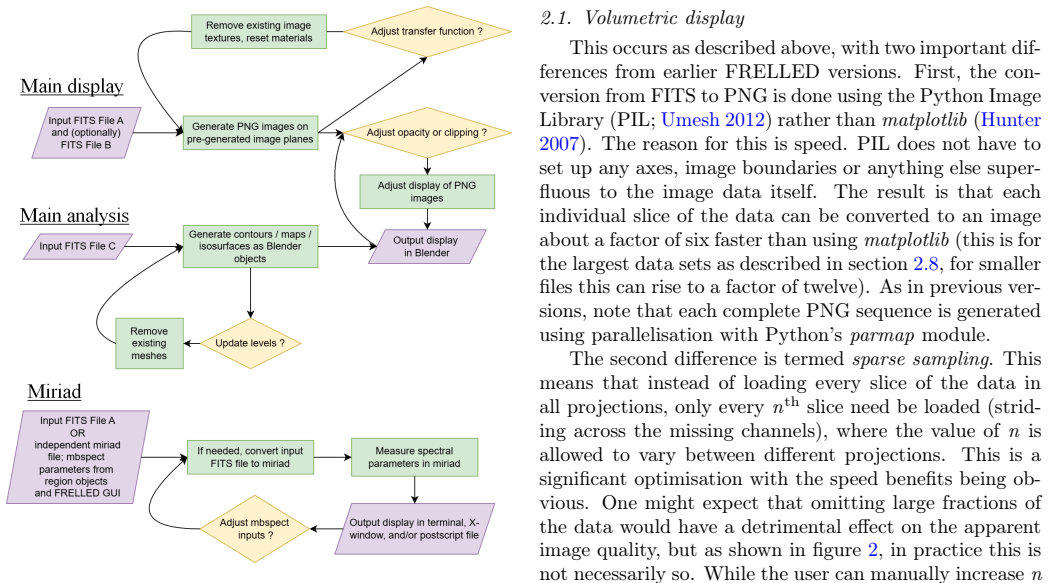
The load-bearing technique is converting FITS slices to PNG textures with PIL and stacking them as image planes in Blender, with per-plane transparency that makes the volume appear sampled along the line of sight. Sparse sampling equalizes the number of displayed planes across unequal cube axes using the rule step = n_axis / smallest_axis_size, which speeds loading while the paper claims a visually negligible quality loss, and all quantitative analysis uses astropy to read the FITS data directly rather than the displayed PNGs.
What would settle it
Load a 512-cubed voxel cube, such as the random-noise cube in the paper's table 2, on three different GPUs and repeat the load-data timing ten times per machine; if the median time substantially exceeds the quoted roughly 45 seconds, or if switching sparse sampling off changes which faint sources are detectable in the THINGS NGC 5236 cube, the general performance and default-display claims would fail.
Extended reading notes
Core claim
The central claim is that FRELLED 5.0 is a fully functional and substantially improved version of the earlier viewer: data loading is typically faster by a factor of a few and sometimes by more than an order of magnitude, cubes up to 1,500 voxels on a side can be handled, and the hard-coded assumption of 21-cm H I data has been replaced with astropy-based world-coordinate handling that works with arbitrary rest frequencies. The paper supports this with new display modes (isosurfaces, height maps, renzogram colour bars, and VR export), a simplified three-step installation, and loading-time benchmarks on several real and simulated cubes compared against two other 3D viewers.
Load-bearing premise
The claim that sparse sampling causes no appreciable loss in display quality rests on the author's visual judgement for a few selected data sets, and the stated speedups come from single-run timings on a small number of machines.
Editorial extensions
If this is right
- Astronomers can visually catalogue sources in large radio cubes without specialised hardware or code editing, since installation reduces to unpacking two files and running one command.
- The move away from a hard-coded H I rest frequency makes the tool usable for ALMA and other higher-frequency line data, not just 21-cm surveys.
- Multi-volume display and the ability to draw isosurfaces or contours from separate FITS files allow different chemical species or sensitivity levels to be overlaid in a single 3D scene.
- Saved FRELLED sessions reload in seconds, a speed comparable to the loading time of a dedicated VR viewer, making iterative transfer-function adjustments practical.
- The VR export path, though described as a prototype, gives a route for stereoscopic inspection and outreach without requiring a dedicated visualisation engine.
Reading between the lines
- If the visual-quality claim for sparse sampling generalises, the same image-plane and step-size trick could be applied in other off-the-shelf 3D engines, not just Blender.
- The paper notes that a future migration to Blender 4+ with EEVEE materials would allow real-time transfer-function updates and halve the object count, which could narrow the large loading-time gap to dedicated VR viewers.
- Because analysis reads the FITS data directly through astropy, the visualisation layer is replaceable; a user could swap Blender's real-time renderer for another without affecting quantitative accuracy.
- A testable extension is to measure source-recovery fraction under default sparse sampling on a labelled simulated cube; the paper currently relies on visual judgement rather than a quantitative sensitivity test.
Signed reviews
Editorial analysis
A structured set of objections, weighed in public.
Referee Report
Summary. The paper presents FRELLED 5.0, a major rewrite of a Python-based 3D FITS data visualisation tool built inside Blender. It describes the new architecture (Blender 2.79), the switch to PIL-based FITS-to-PNG conversion, sparse sampling, new visualisation modes (isosurfaces, height maps, VR export), multi-frequency WCS support via astropy, a new GUI with developer tools, and benchmark comparisons against GLNemo2 and iDaVIE. The manuscript is written as a software description paper aimed at Astronomy and Computing, with the main claim that FRELLED 5.0 is a functional, faster, more general, and more maintainable successor to the earlier FRELLED versions.
Significance. If the described functionality is as presented, FRELLED 5.0 is a practically useful contribution to radio-astronomy visualisation: it offers several complementary display modes in one package, simplifies installation, removes the Hi-only WCS restriction, and provides a documented GUI for operations that previously required scripting. The paper is appropriately scoped for a software paper and contains useful honest statements of limitations (VR as prototype, isosurface transparency artifacts, small-cube loading times). The manuscript supplies public code, example data, online wiki/video documentation, and external benchmarks, and the description is largely self-contained. The central technical problem is that the opacity-normalisation equation in Section 2.1 is internally inconsistent with the GUI slider description, and this must be resolved before the core volumetric display mechanism can be assessed.
major comments (3)
- [2.1, 4.1.1] The opacity-normalisation equation is internally inconsistent as printed. Section 2.1 defines material.alpha = int(GUI.alpha/n_slices), while Section 4.1.1 states that GUI.alpha is a numerical slider in the range 0.0 to 1.0. For n_slices > 1, int(GUI.alpha/n_slices) evaluates to 0 for every slider value, including GUI.alpha = 1.0 whenever n_slices >= 2. This would make every material fully transparent and would contradict the screenshots, figure captions, and benchmark timings that clearly show visible data. The text therefore does not currently specify the actual opacity mechanism: either the code uses float division (material.alpha = GUI.alpha/n_slices), or GUI.alpha is internally rescaled to a 0-100 range, or the formula is otherwise mis-stated. The authors should correct the formula and state, precisely, the units and data type of GUI.alpha, and confirm that the printed formula matches the distributed code. This is load-bearing because volumetric display is the central feature of the paper.
- [2.1, 2.8, Table 2] The performance claims are stated more strongly than the evidence supports, and one statement is self-contradictory. Section 2.1 says the new loading speed is 'always faster than in previous versions', but Section 2.8 says small data sets 'may load no more quickly than in previous versions'. In addition, Table 2 reports a single timing per configuration with no repeated trials, no error bars, and no independence of measurements, and the cross-machine list in Section 2.8 contains one measurement per machine. The authors should either add replicate timings (or explicit ranges) or weaken the wording to 'typically faster' and state that the table entries are single runs. The corrected wording should be consistent between Sections 2.1 and 2.8.
- [2.1, Figure 2] The claim that default sparse sampling causes 'no appreciable difference' in image quality is based only on the author's visual judgment. Since this claim justifies the default n setting and feeds into the headline loading-time improvements, it would benefit from a more objective basis: for example, a quantitative comparison of the rendered output (e.g., per-pixel differences between sparse and full-sampled renders) or a stated user-study protocol. Without this, the quality claim is a reasonable anecdote but not a measured result. This is a proportionality concern rather than a correctness error, and it can be addressed by adding one quantitative figure or by explicitly labelling the claim as a subjective assessment.
minor comments (7)
- [Abstract and throughout] The abstract uses 'Principle new features'; the intended word is 'Principal'. This should be corrected throughout the manuscript.
- [2.4] The module name is 'scikit-image' (or 'skimage'), not 'sckit-image'; the typo appears in the sentence describing the Lewiner marching cubes implementation.
- [2.8, Table 2 caption] The table caption contains the typo 'Obser v ational data sets'; fix the spacing.
- [4.1.1] The phrase 'all all values below the specified opacity level' contains a duplicated word; remove one 'all'.
- [4.2.2] The MIRIAD task name appears as 'msbpect' in one sentence; the correct name is 'mbspect'.
- [5.2] The sentence about 'two json files required formatplotlib' should read 'required by matplotlib'; the missing 'by' makes the sentence unclear.
- [2.8] The phrase 'a worse-case scenario' should be 'a worst-case scenario'.
Circularity Check
No circularity: FRELLED 5.0 is a software description with no fitted parameters, no predictions, and no derivation that reduces to its own inputs.
full rationale
The paper does not derive any result from fitted parameters, does not make predictions, and does not invoke any uniqueness theorem. Its central claim is a software description: FRELLED 5.0 exists, is usable, and is faster than version 4.5. Performance claims are benchmarked against independent tools (GLNemo2, iDaVIE) on public data sets (THINGS, PHANGS, AGES), which is externally falsifiable rather than circular. Self-citations to T15 (Taylor 2015) are version-history references for unchanged mechanisms, not load-bearing arguments. The one notable issue is the material.alpha = int(GUI.alpha/n_slices) expression in Section 2.1, which as printed is internally inconsistent with the stated GUI.alpha range [0.0,1.0] and with the paper's own screenshots and benchmarks. That is a correction/clarification matter, not circularity, because the opacity equation is defined by user input rather than being a predicted output derived from the data. Therefore the circularity score is 0.
Assumptions & free parameters
assumptions (3)
- domain assumption Blender 2.79's real-time rendering engine updates textures exactly as assumed in the opacity and sparse-sampling description (Section 2.1).
- domain assumption The single-run benchmarks in Table 2 are representative of typical user experience on comparable hardware.
- domain assumption The external Python libraries (astropy, spectral-cube, scikit-image, PIL) bundled with FRELLED parse FITS headers and generate isosurfaces as documented.
Cite this review
Pith. "Pith review of FRELLED Reloaded: Multiple techniques for astronomical data visualisation in Blender." pith.science (2026). https://pith.science/paper/XZUQLJR2
@misc{pith2026250102919,
  author       = {Pith},
  title        = {Pith review of: FRELLED Reloaded: Multiple techniques for astronomical data visualisation in Blender},
  year         = {2026},
  howpublished = {\url{https://pith.science/paper/XZUQLJR2}},
  note         = {Machine review of arXiv:2501.02919}
}
read the original abstract
I present version 5.0 of FRELLED, the FITS Realtime Explorer of Low Latency in Every Dimension. This is a 3D data visualisation package for the popular Blender art software, designed to allow inspection of astronomical volumetric data sets (primarily, but not exclusively, radio wavelength data cubes) in real time using a variety of visualisation techniques. The suite of Python scripts that comprise FRELLED have been almost completely recoded and many new ones added, bringing FRELLED's operating environment from Blender version 2.49 to 2.79. Principle new features include: an enormously simplified installation procedure, a more modular graphical appearance that takes advantage of Blender 2.79's improved interface, much faster loading of FITS data, support for larger data sets, options to show the data as height maps in 2D mode or isosurfaces in 3D mode, utilisation of standard astropy and other Python modules to support a greater range of FITS files (with a particular emphasis on higher-frequency radio data such as from ALMA, the Atacama Large Millimetre Array), and the capability of exporting the data to Blender 2.9+ which supports stereoscopic 3D displays in virtual reality headsets. In addition, in-built help files are accessible from each menu panel, as well as direct links to a complete wiki and set of video tutorials. Finally, the code itself is much more modular, allowing easier maintainability and, over the longer term, a far easier prospect of migrating to more recent versions of Blender.
Figures


Figures from the paper (4 more)


Reference graph
Works this paper leans on
-
[1]
Auld, R., Minchin, R. F., Davies, J. I., et al. 2006, Monthly Notices of the Royal Astronomical Society, 371, 1617
work page 2006
- [2]
-
[3]
Davies, J. I., de Blok, W. J. G., Smith, R. M., et al. 2001, Monthly Notices of the Royal Astronomical Society, 328, 1151
work page 2001
-
[4]
3D visualization of astronomy data cubes using immersive displays
Ferrand, G., English, J., & Irani, P. 2016, arXiv e-prints, arXiv:1607.08874
work page Pith review arXiv 2016
-
[5]
Ferrand, G. & Warren, D. 2018, Communicating Astronomy with the Public Journal, 24, 25
work page 2018
-
[6]
Fluke, C. J. & Barnes, D. G. 2018, Publications of the Astronomical Society of Australia, 35, e026
work page 2018
-
[7]
J., Parrington, L., Hegarty, S., et al
Fluke, C. J., Parrington, L., Hegarty, S., et al. 2017, Publications of the Astronomical Society of the Pacific, 129, 058009 Gárate, M. 2017, Publications of the Astronomical Society of the Pacific, 129, 058010 García-Benito, R. & Pérez-Montero, E. 2022, in Revista Mexicana de Astronomia y Astrofisica Conference Series, Vol. 54, Revista Mexicana de Astron...
work page 2017
-
[8]
1996, in Astronomical Society of the Pacific Conference
Gooch, R. 1996, in Astronomical Society of the Pacific Conference
work page 1996
Show all 56 references
-
[9]
Gooch, R. E. 1997, Publications of the Astronomical Society of Aus- tralia, 14, 106
1997
-
[10]
H., Fluke, C
Hassan, A. H., Fluke, C. J., & Barnes, D. G. 2012, Publications of the Astronomical Society of Australia, 29, 340
2012
-
[11]
Hunter, J. D. 2007, Computing in Science & Engineering, 9, 90
2007
-
[12]
Imara, N., Forbes, J.C., &Weaver, J.C.2021, AstrophysicalJournal Letters, 918, L3
2021
-
[13]
& Akhlaghi, M
Infante-Sainz, R. & Akhlaghi, M. 2024, Research Notes of the Amer- ican Astronomical Society, 8, 10
2024
-
[14]
H., Comrie, A., Marchetti, L., et al
Jarrett, T. H., Comrie, A., Marchetti, L., et al. 2021, Astronomy and Computing, 37, 100502
2021
-
[15]
C., Davies, J
Keenan, O. C., Davies, J. I., Taylor, R., & Minchin, R. F. 2016, Monthly Notices of the Royal Astronomical Society, 456, 951
2016
-
[16]
Kent, B. R. 2013, Publications of the Astronomical Society of the Pacific, 125, 731
2013
-
[17]
Kent, B. R. 2015, 3D Scientific Visualization with Blender (Morgan and Claypool Publishers)
2015
-
[18]
Kent, B. R. 2019, in Astronomical Society of the Pacific Conference
2019
-
[19]
Lambert, J. C. 2012, in Astronomical Society of the Pacific Confer- ence Series, Vol. 461, Astronomical Data Analysis Software and Systems XXI, ed. P. Ballester, D. Egret, & N. P. F. Lorente, 897
2012
-
[20]
2021, arXiv e-prints, arXiv:2106.00152
Lan, F., Young, M., Anderson, L., et al. 2021, arXiv e-prints, arXiv:2106.00152
2021 arXiv
-
[21]
K., Schinnerer, E., Hughes, A., et al
Leroy, A. K., Schinnerer, E., Hughes, A., et al. 2021, Astrophysical Journal Supplement, 257, 43
2021
-
[22]
W., & G., T
Lewiner, T., Lopes, H., Vieira, A. W., & G., T. 2003, Journal of Graphics Tools, 8, 1
2003
-
[23]
Liu, A. G. & Liu, C. T. 2021, Research Notes of the American As- tronomical Society, 5, 83
2021
-
[24]
H., Comrie, A., et al
Marchetti, L., Jarrett, T. H., Comrie, A., et al. 2020, arXiv e-prints, arXiv:2012.11553
2020 arXiv
-
[25]
F., Momjian, E., Auld, R., et al
Minchin, R. F., Momjian, E., Auld, R., et al. 2010, Astronomical Journal, 140, 1093
2010
-
[26]
F., Taylor, R., Köppen, J., et al
Minchin, R. F., Taylor, R., Köppen, J., et al. 2019, Astronomical Journal, 158, 121
2019
-
[27]
2017, Publications of the Astronomical Society of the Pa- cific, 129, 058003
Muna, D. 2017, Publications of the Astronomical Society of the Pa- cific, 129, 058003
2017
-
[28]
Naiman, J. P. 2016, Astronomy and Computing, 15, 50
2016
-
[29]
P., Borkiewicz, K., & Christensen, A
Naiman, J. P., Borkiewicz, K., & Christensen, A. J. 2017, Publica- tions of the Astronomical Society of the Pacific, 129, 058008
2017
-
[30]
Norris, R. P. 2017, Publications of the Astronomical Society of Aus- tralia, 34, e007
2017
-
[31]
Ott, J. A. & Carta Team. 2020, in American Astronomical Soci- ety Meeting Abstracts, Vol. 235, American Astronomical Society Meeting Abstracts #235, 364.11
2020
-
[32]
2014, Attention, Per- ception, and Psychophysics, 76, 270–279
Potter, M., Wyble, B., Hagmann, C., & et al. 2014, Attention, Per- ception, and Psychophysics, 76, 270–279
2014
-
[33]
C., & Yu, L
Punzo, D., vanderHulst, J.M., Roerdink, J.B.T.M., Fillion-Robin, J. C., & Yu, L. 2017, Astronomy and Computing, 19, 45
2017
-
[34]
E., de Heij, V., Staveley-Smith, L., et al
Putman, M. E., de Heij, V., Staveley-Smith, L., et al. 2002, Astro- nomical Journal, 123, 873
2002
-
[35]
J., Markwick-Kemper, A., & ALMA Working Group on Spectral Line Frequencies
Remijan, A. J., Markwick-Kemper, A., & ALMA Working Group on Spectral Line Frequencies. 2007, in American Astronomical Soci- ety Meeting Abstracts, Vol. 211, American Astronomical Society Meeting Abstracts, 132.11
2007
-
[36]
Rupen, M. P. 1999, in Astronomical Society of the Pacific Conference
1999
-
[37]
2007, Astronomical Journal, 133, 2087
Saintonge, A. 2007, Astronomical Journal, 133, 2087
2007
-
[38]
J., Teuben, P
Sault, R. J., Teuben, P. J., & Wright, M. C. H. 1995, in Astronomical Society of the Pacific Conference Series, Vol. 77, Astronomical Data Analysis Software and Systems IV, ed. R. A. Shaw, H. E. Payne, & J. J. E. Hayes, 433
1995
-
[39]
2015, Monthly Notices of the Royal Astronomical Society, 448, 1922 Smithsonian Astrophysical Observatory
Serra, P., Westmeier, T., Giese, N., et al. 2015, Monthly Notices of the Royal Astronomical Society, 448, 1922 Smithsonian Astrophysical Observatory. 2000, SAOImage DS9: A utility for displaying astronomical images in the X11 window envi- ronment, Astrophysics Source Code Libr...
2015
-
[40]
2022, The Messenger, 187, 25
Stoehr, F., Manning, A., McLay, S., et al. 2022, The Messenger, 187, 25
2022
-
[41]
2015, Astronomy and Computing, 13, 67
Taylor, R. 2015, Astronomy and Computing, 13, 67
2015
-
[42]
2017, Publications of the Astronomical Society of the Pacific, 129, 028002
Taylor, R. 2017, Publications of the Astronomical Society of the Pacific, 129, 028002
2017
-
[43]
I., Auld, R., & Minchin, R
Taylor, R., Davies, J. I., Auld, R., & Minchin, R. F. 2012, Monthly Notices of the Royal Astronomical Society, 423, 787
2012
-
[44]
I., Auld, R., Minchin, R
Taylor, R., Davies, J. I., Auld, R., Minchin, R. F., & Smith, R. 2013, Monthly Notices of the Royal Astronomical Society, 428, 459
2013
-
[45]
2022, Astronomical Jour- nal, 164, 233
Taylor, R., Köppen, J., Jáchym, P., et al. 2022, Astronomical Jour- nal, 164, 233
2022
-
[46]
2020, Astronomical Jour- nal, 159, 218
Taylor, R., Köppen, J., Jáchym, P., et al. 2020, Astronomical Jour- nal, 159, 218
2020
-
[47]
F., Herbst, H., et al
Taylor, R., Minchin, R. F., Herbst, H., et al. 2014, Monthly Notices of the Royal Astronomical Society, 443, 2634
2014
-
[48]
2023, in AAS/Division for Planetary Sciences Meeting Abstracts, Vol
Tenthoff, M., Arnaut, M., Barot, T., et al. 2023, in AAS/Division for Planetary Sciences Meeting Abstracts, Vol. 55, AAS/Division for Planetary Sciences Meeting Abstracts, 212.04
2023
-
[49]
1996, Nature, 381, 520–522
Thorpe, S., Fize, D., & Marlot, C. 1996, Nature, 381, 520–522
1996
-
[50]
2012, CSI Communications, 23 Van der Walt, S., Schönberger, J
Umesh, P. 2012, CSI Communications, 23 Van der Walt, S., Schönberger, J. L., Nunez-Iglesias, J., et al. 2014, PeerJ, 2, e453
2012
-
[51]
2018, Publications of the Astronomical Society of the Pacific, 130, 084503
Vitello, F., Sciacca, E., Becciani, U., et al. 2018, Publications of the Astronomical Society of the Pacific, 130, 084503
2018
-
[52]
J., Barnes, D
Vohl, D., Fluke, C. J., Barnes, D. G., & Hassan, A. H. 2017, Monthly Notices of the Royal Astronomical Society, 471, 3323
2017
-
[53]
Walter, F., Brinks, E., de Blok, W. J. G., et al. 2008, Astronomical Journal, 136, 2563
2008
-
[54]
I., Westmeier, T., et al
Wang, L., Wong, O. I., Westmeier, T., et al. 2024, arXiv e-prints, arXiv:2409.11668
2024 arXiv
-
[55]
Whiting, M. T. 2012, Monthly Notices of the Royal Astronomical Society, 421, 3242
2012
-
[56]
2022, Nature Astronomy, 6, 1241–1248 23
Zanella, A., Harrison, C., Lenzi, S., & et al. 2022, Nature Astronomy, 6, 1241–1248 23
2022
Reviewed August 10, 2026 · model on record in the stance chip above.
Discussion (0). Continue with ORCID to comment.