REVIEW 3 major objections 7 minor 32 references
On the Structural Properties of Social Networks and their Measurement-calibrated Synthetic Counterparts
T0 review · 3 major / 7 minor · reviewed 2026-08-14 · deepseek-v4-flash
Pith's one-line read Calibrated 2K and stochastic block models reproduce the structural metrics of 120 real social networks more closely than clustering preferential-attachment and forest-fire models, but no tested model creates a network that is both…
desk verdict Honest, useful empirical benchmark of calibrated network models on 120 social networks, but the model ranking in Fig. 5 is partly circular because evaluation uses the same metric set and distance as calibration. read the letter →
The pith
A machine-rendered reading of the paper's core claim, the machinery that carries it, and where it could break.
The reading
What carries the argument
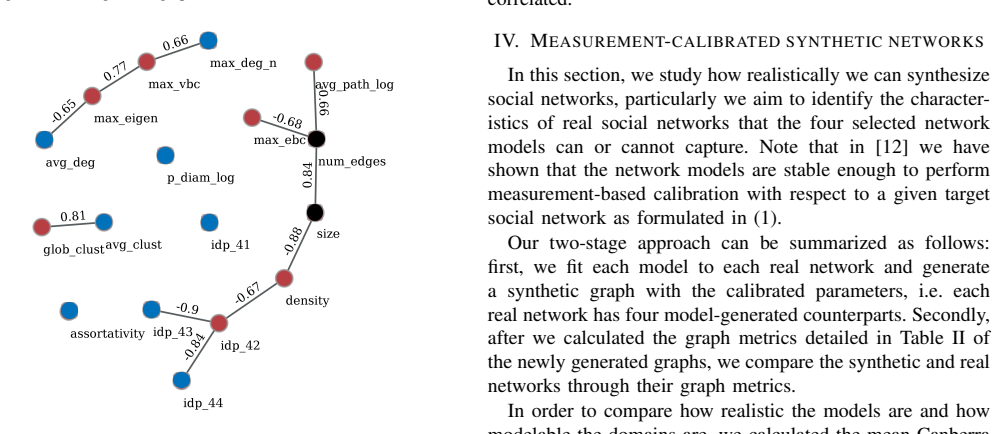
The argument is carried by a measurement-calibration pipeline rather than by a single identity. The key pieces are a selected vector of structural metrics—assortativity, average clustering coefficient, average degree, normalized pseudo-diameter, interval degree probabilities, and normalized maximum degree—chosen as a maximal independent set in the metric-correlation network; the Canberra distance between metric vectors as the goodness-of-fit measure; and grid-search parameter tuning for each of the four models against each real network. This machinery converts the abstract question of which model is more realistic into a numerical comparison of calibrated synthetic graphs with real graphs, and it is what allows the paper to localize which metric relationships models can and cannot reproduce.
What would settle it
Re-run the pipeline with a different metric basis, such as adding graphlet or spectral descriptors, or with a different redundancy threshold; if mean Canberra distances no longer put 2K and stochastic block models ahead of clustering preferential-attachment and forest-fire models in all three domains, the paper's ordering is not robust. The cannot-simultaneously claim can be tested directly by generating a large sample of calibrated 2K and stochastic block graphs while scanning parameter space for any point with normalized diameter and average clustering both above the real-network medians; one such graph would break the claim.
Extended reading notes
Core claim
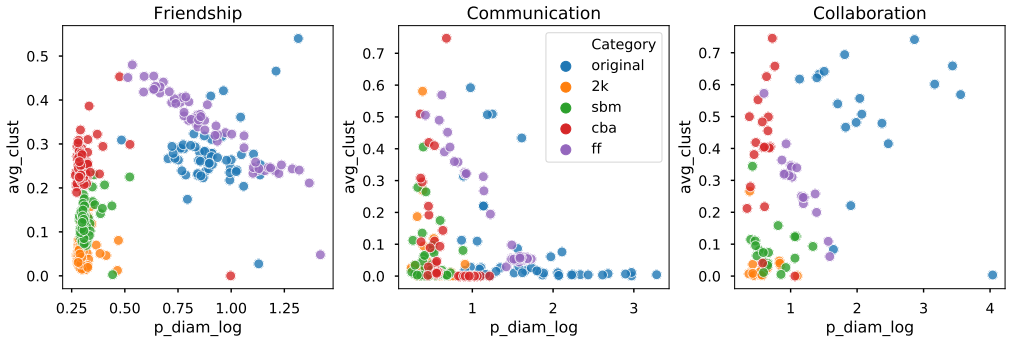
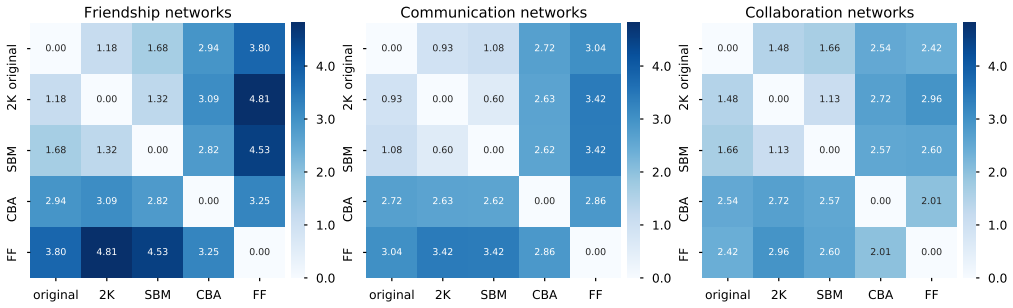
The central discovery is an empirical comparison with a negative joint finding. Across the 120 networks, the authors compute 17 structural measurements, reduce them to a non-redundant, size-independent set using a Spearman-correlation network with a 0.65 threshold, and fit each model by grid search minimizing the Canberra distance between the metric vectors of the real and synthetic graphs. Domain-averaged Canberra distances show that the 2K model and the stochastic block model reproduce the selected structural metrics most closely in every domain, with communication networks the easiest and friendship networks the hardest to mimic. However, when the authors examine pairwise relationships, they find a structural limitation shared by all four models: they cannot produce graphs that simultaneously have a large diameter normalized by log size and a high average clustering coefficient, a combination that appears in all three real-world domains.
Load-bearing premise
The whole ordering of models depends on the assumption that the 17 computed metrics, after reduction at a 0.65 correlation threshold, still cover the descriptive space of network topology; if important structural information is missing from this basis, a model that looks faithful on these metrics could still be misleading.
Editorial extensions
If this is right
- Privacy-preserving synthetic counterparts of social networks can be generated by calibrating a 2K or stochastic block model to the selected metrics, avoiding release of the original graph.
- Simulations of processes that depend jointly on diameter and clustering should not rely on any of the four models, since that trait combination is outside their reach.
- Model selection should be domain-aware: communication networks are the easiest to mimic and friendship networks the hardest.
- Because 2K and stochastic block models match degree-related metrics exactly through their construction, synthetic graphs from these models can be trusted when degree-distribution fidelity is the only requirement.
Reading between the lines
- The paper does not vary the 0.65 Spearman threshold; a natural stress test would be to rerun the entire selection-and-ranking pipeline at thresholds such as 0.5 or 0.8 to see whether the 2K and stochastic block model ordering is an artifact of that cutoff.
- The claimed diameter-clustering gap concerns the four generative mechanisms; one can test whether adding a path-lengthening or triangle-adding postprocessing step to a 2K or stochastic block model reaches the missing corner of the metric space.
- The authors suggest embedding-based comparison as a next step; a direct comparison of embedding distances with the Canberra metric on the selected basis would show whether the reduced metric set spans the information that modern graph representations extract.
Signed reviews
Editorial analysis
A structured set of objections, weighed in public.
Referee Report
Summary. This paper analyzes 120 real social networks from three domains (friendship, communication, collaboration). For each network the authors compute 17 structural metrics, examine Spearman rank correlations between metrics across domains, and select a non-redundant subset using a maximal independent set on a correlation network thresholded at 0.65. They then calibrate four generative models (clustering Barabasi-Albert, stochastic block model, forest-fire, and 2K) by minimizing the Canberra distance between the selected metric vectors of the real and generated graphs, and compare the models by computing mean Canberra distances domain by domain. The main findings are that correlation patterns differ across domains, that 2K and stochastic block models mimic the selected metrics most closely, and that none of the models can generate graphs with simultaneously high diameter and high clustering coefficient.
Significance. The paper offers a useful large-scale empirical benchmark: 120 real networks and 480 calibrated synthetic graphs, with data and code made publicly available in a supplementary repository. The domain-specific correlation analysis of graph metrics is a valuable descriptive contribution, and the scatter-plot observation in Fig. 3 that no model reproduces the simultaneous combination of large normalized diameter and high clustering coefficient is an interesting, calibration-free falsifiable finding. However, the central comparative claim that 2K and SBM 'can be used to mimic social networks relatively efficiently' is weakened because the evaluation uses the same metric set and the same Canberra distance that were optimized during calibration. The independent content of the paper, especially the capacity limitations shown in Fig. 3, remains credible, but the model ranking in Fig. 5 needs a stronger, non-circular evaluation before the main conclusion is fully supported.
major comments (3)
- [Section IV, Fig. 5, Eq. (1)] The evaluation is circular with respect to the calibration objective. Equation (1) calibrates model parameters by minimizing the Canberra distance d(G_M(θ), G_T) over a vector of graph metrics f, and Section IV then ranks the models by computing the mean Canberra distance between original and generated graphs over exactly the same metric set listed in Table II. Consequently, Fig. 5 measures how well each model can minimize the training objective rather than how well it generalizes to structural properties not used in fitting. The authors should evaluate the models on held-out metrics that were not part of the calibration objective, or at least report per-metric distances to show which properties drive the ranking. This issue is load-bearing for the conclusion that 2K and SBM efficiently mimic social networks.
- [Section III, Fig. 2] The threshold of 0.65 for the domain-averaged absolute Spearman correlation and the maximal-independent-set selection rule are not justified and no sensitivity analysis is provided. The selected metric set determines the calibration objective and the subsequent evaluation, so a different threshold could change the metric set and possibly the model ranking. The authors should test a range of thresholds (for example 0.5, 0.6, 0.7, 0.8) and report whether the selected non-redundant set and the main conclusions are stable.
- [Fig. 5, Section IV] The domain-averaged Canberra distances are presented as point estimates without any uncertainty quantification. There are no error bars, standard deviations, or significance tests, and some of the reported differences are small (for example, in the communication domain the original-2K distance is 0.93 while the original-SBM distance is 1.08). Without knowing the distribution of distances across the 43 communication networks, the claim that SBM and 2K efficiently capture the structural properties cannot be assessed quantitatively. The authors should report per-network distances, confidence intervals, or a paired significance test between models.
minor comments (7)
- [Section II] The statement that the 17 graph measurements are 'chosen in such a way that together they measure every aspect of networks' is too strong; the paper should say that the metrics cover commonly studied aspects of degree distribution, shortest paths, centralities, and clustering.
- [Section III, Fig. 2 caption] The caption of Fig. 2 explains that correlations are domain-averaged absolute Spearman correlations, but this averaging is not described in the main text; it should be stated where the figure is referenced.
- [Table II] Table II lists 'domain' and 'category' as nominal variables, but the distance function in Eq. (1) is defined over real-valued metric functions; the role of these nominal variables in calibration and evaluation should be clarified.
- [Section IV] The text says that models 'could mimic the structural properties of real networks, especially SBM and 2K', and later states that SBM and 2K generate similar graphs, but no quantitative measure of similarity between the two models is given.
- [Conclusion] The conclusion refers to 'degree corrected stochastic block models' while Section II and Fig. 5 use 'stochastic block model (SBM)'; the authors should specify which variant was actually fitted, since the nonparametric microcanonical SBM of Peixoto can include degree correction but this is not stated in the methodology.
- [Section II] The calibration procedure is described only as grid search with details deferred to reference [12]; the parameter spaces and grid ranges for each model should be summarized in the main text to make the experiments reproducible without consulting the earlier paper.
- [Fig. 3 and Fig. 4] The scatter plots in Figs. 3 and 4 use overlapping dots of different sizes, which makes it difficult to see the density of points; transparency, jitter, or separate density panels would improve readability.
Circularity Check
Model ranking in Fig. 5 is computed on the same Canberra metric distance used as the calibration objective in Eq. (1), so the reported SBM/2K advantage is partly in-sample fit rather than independent prediction.
-
fitted input called prediction
[Eq. (1), Sec. II (Methodology); Sec. IV and Fig. 5]
"θ∗ = arg min θ d(GM (θ), GT ). (1)... To quantify the distance between two graphs, we calculate the Canberra distance of vectors of a reasonably chosen selection of graph metrics ... After we calculated the graph metrics detailed in Table II of the newly generated graphs, we compare the synthetic and real networks through their graph metrics."
The calibration objective in Eq. (1) is d(GM(θ), GT) = dCan(f(GM(θ)), f(GT)) over the selected metric vector f (Table II). The evaluation in Sec. IV/Fig. 5 then ranks models by the mean Canberra distance between original and generated graphs over the same Table II metrics and the same distance function. Therefore the Fig. 5 ranking measures how well each model minimized the very objective used to fit it, not how well the model generalizes to new structural properties. The SBM/2K advantage is partly a training-score artifact, and the statement that they 'can be used to mimic social networks relatively efficiently' is supported only by an in-sample comparison. The separate Fig.
full rationale
The central ranking claim is partially circular: the same Canberra distance over the same metric vector defines both the fitting criterion (Eq. 1) and the reported goodness-of-fit (Fig. 5). This does not make the whole paper circular. The metric-selection analysis (Sec. III) is descriptive, the correlation profiles across domains are independent empirical findings, and the Fig. 3 scatter plot exposes a model failure (large diameter plus high clustering simultaneously) that is visible regardless of the calibration objective. I therefore score the circularity as 6 rather than higher: one key 'prediction' (models mimic social networks efficiently, especially SBM/2K) reduces substantially to in-sample fit. Minor self-citation to the authors' earlier [12] for calibration stability is not load-bearing for the main empirical claims.
Assumptions & free parameters
free parameters (5)
- CBA model parameters =
grid-searched per target network
- SBM block partition and parameters =
inferred per network
- Forest-fire parameters =
grid-searched per network
- 2K joint degree matrix =
empirical joint degree distribution of target
- Spearman correlation threshold =
0.65
assumptions (3)
- domain assumption The 17 selected metrics jointly measure every aspect of network structure.
- ad hoc to paper Spearman correlation threshold 0.65 and maximal independent set selection identify a non-redundant metric set with sufficient descriptive power.
- domain assumption Networks collected from online repositories represent social networks across the three studied domains.
Cite this review
Pith. "Pith review of On the Structural Properties of Social Networks and their Measurement-calibrated Synthetic Counterparts." pith.science (2026). https://pith.science/paper/Y2QCACMC
@misc{pith2026190808429,
  author       = {Pith},
  title        = {Pith review of: On the Structural Properties of Social Networks and their Measurement-calibrated Synthetic Counterparts},
  year         = {2026},
  howpublished = {\url{https://pith.science/paper/Y2QCACMC}},
  note         = {Machine review of arXiv:1908.08429}
}
read the original abstract
Data-driven analysis of large social networks has attracted a great deal of research interest. In this paper, we investigate 120 real social networks and their measurement-calibrated synthetic counterparts generated by four well-known network models. We investigate the structural properties of the networks revealing the correlation profiles of graph metrics across various social domains (friendship networks, communication networks, and collaboration networks). We find that the correlation patterns differ across domains. We identify a non-redundant set of metrics to describe social networks. We study which topological characteristics of real networks the models can or cannot capture. We find that the goodness-of-fit of the network models depends on the domains. Furthermore, while 2K and stochastic block models lack the capability of generating graphs with large diameter and high clustering coefficient at the same time, they can still be used to mimic social networks relatively efficiently.
Figures

Figures from the paper (2 more)

Reference graph
Works this paper leans on
- [1]
-
[2]
S. Milgram, “The small world problem,” Psychology Today, vol. 2, no. 1, pp. 60–67, 1967
work page 1967
-
[3]
Collective dynamics of small-world networks,
D. J. Watts and S. H. Strogatz, “Collective dynamics of small-world networks,” Nature, vol. 393, no. 6684, p. 440, 1998
1998
-
[4]
Emergence of scaling in random net- works,
A.-L. Barab ´asi and R. Albert, “Emergence of scaling in random net- works,” Science, vol. 286, no. 5439, pp. 509–512, 1999
1999
-
[5]
Stochastic blockmodels: First steps,
P. W. Holland, K. B. Laskey, and S. Leinhardt, “Stochastic blockmodels: First steps,” Social Networks, vol. 5, no. 2, pp. 109–137, 1983
1983
-
[6]
D. J. Watts, Small worlds: the dynamics of networks between order and randomness. Princeton University Press, 2004, vol. 9
work page 2004
-
[7]
A privacy preservation model for Facebook-style social network systems,
P. W. Fong, M. Anwar, and Z. Zhao, “A privacy preservation model for Facebook-style social network systems,” in Europ. Symp. on Res. in Comp. Security. Springer, 2009, pp. 303–320
work page 2009
-
[8]
Growing scale-free networks with tunable clustering,
P. Holme and B. J. Kim, “Growing scale-free networks with tunable clustering,” Physical Review E , vol. 65, no. 2, p. 026107, 2002
work page 2002
Show all 32 references
-
[9]
Nonparametric bayesian inference of the microcanonical stochastic block model,
T. P. Peixoto, “Nonparametric bayesian inference of the microcanonical stochastic block model,” Physical Review E , vol. 95, no. 1, p. 012317, 2017
2017
-
[10]
Graphs over time: densi- fication laws, shrinking diameters and possible explanations,
J. Leskovec, J. Kleinberg, and C. Faloutsos, “Graphs over time: densi- fication laws, shrinking diameters and possible explanations,” in Proc. of the 11th ACM SIGKDD Int. Conf. on Knowledge Discovery in Data Mining. ACM, 2005, pp. 177–187
2005
-
[11]
Construction of simple graphs with a target joint degree matrix and beyond,
M. Gjoka, B. Tillman, and A. Markopoulou, “Construction of simple graphs with a target joint degree matrix and beyond,” in Computer Communications (INFOCOM), 2015 IEEE Conference on . Citeseer, 2015, pp. 1553–1561
2015
-
[12]
Data-driven analysis of complex networks and their model-generated counterparts,
M. Nagy and R. Molontay, “Data-driven analysis of complex networks and their model-generated counterparts,” arXiv preprint arXiv:1810.08498, 2018
2018 arXiv
-
[13]
Social structure of facebook networks,
A. L. Traud, P. J. Mucha, and M. A. Porter, “Social structure of facebook networks,” Physica A: Statistical Mechanics and its Applications , vol. 391, no. 16, pp. 4165–4180, 2012
2012
-
[14]
Measurement-calibrated graph models for social network experiments,
A. Sala, L. Cao, C. Wilson, R. Zablit, H. Zheng, and B. Y . Zhao, “Measurement-calibrated graph models for social network experiments,” in Proc. of 19th Int. Conf. on WWW . ACM, 2010, pp. 861–870
2010
-
[15]
Model selection for social networks using graphlets,
J. Janssen, M. Hurshman, and N. Kalyaniwalla, “Model selection for social networks using graphlets,” Internet Mathematics , vol. 8, no. 4, pp. 338–363, 2012
2012
-
[16]
Towards a systematic evaluation of generative network models,
T. Bl ¨asius, T. Friedrich, M. Katzmann, A. Krohmer, and J. Striebel, “Towards a systematic evaluation of generative network models,” in International Workshop on Algorithms and Models for the Web-Graph . Springer, 2018, pp. 99–114
2018
-
[17]
Comparing social networks: size, density, and local structure,
K. Faust, “Comparing social networks: size, density, and local structure,” Metodoloski Zvezki, vol. 3, no. 2, p. 185, 2006
2006
-
[18]
Attributed social network embedding,
L. Liao, X. He, H. Zhang, and T.-S. Chua, “Attributed social network embedding,” IEEE Transactions on Knowledge and Data Engineering , vol. 30, no. 12, pp. 2257–2270, 2018
2018
-
[19]
Large Social Networks and their Structural Properties,
M. Nagy and R. Molontay, “Large Social Networks and their Structural Properties,” 2019. [Online]. Available: https://github.com/marcessz/ Social-Networks
2019
-
[20]
Overview of metrics and their correlation patterns for multiple-metric topology analysis on heterogeneous graph ensembles,
G. Bounova and O. de Weck, “Overview of metrics and their correlation patterns for multiple-metric topology analysis on heterogeneous graph ensembles,” Physical Review E , vol. 85, no. 1, p. 016117, 2012
2012
-
[21]
Correlation analysis of complex network metrics on the topology of the Internet,
A. Garcia-Robledo, A. Diaz-Perez, and G. Morales-Luna, “Correlation analysis of complex network metrics on the topology of the Internet,” in Emerging Technologies for a Smarter World (CEWIT), 2013 10th International Conference and Expo on . IEEE, 2013, pp. 1–6
2013
-
[22]
The network data repository with interactive graph analytics and visualization,
R. A. Rossi and N. K. Ahmed, “The network data repository with interactive graph analytics and visualization,” in Proc. of 29th AAAI Conf. on Art. Int. , 2015. [Online]. Available: http: //networkrepository.com
2015
-
[23]
The Colorado Index of complex networks,
A. Clauset, E. Tucker, and M. Sainz, “The Colorado Index of complex networks,” 2016. [Online]. Available: https://icon.colorado.edu/
2016
-
[24]
KONECT – The Koblenz Network Collection,
J. Kunegis, “KONECT – The Koblenz Network Collection,” in Proc. Int. Conf. on World Wide Web Companion , 2013, pp. 1343–1350. [Online]. Available: http://konect.uni-koblenz.de
2013
-
[25]
Barab ´asi, Network science
A.-L. Barab ´asi, Network science. Cambridge University Press, 2016
2016
-
[26]
Quantification and compar- ison of degree distributions in complex networks,
S. Aliakbary, J. Habibi, and A. Movaghar, “Quantification and compar- ison of degree distributions in complex networks,” in 7’th International Symposium on Telecommunications. IEEE, 2014, pp. 464–469
2014
-
[27]
Efficient comparison of massive graphs through the use of ’graph fingerprints’,
S. Bonner, J. Brennan, G. Theodoropoulos, I. Kureshi, and A. McGough, “Efficient comparison of massive graphs through the use of ’graph fingerprints’,” 12th Workshop on Mining and Learning with Graphs (MLG) at KDD’16, 2016
2016
-
[28]
The graph-tool python library,
T. P. Peixoto, “The graph-tool python library,” figshare, 2014. [Online]. Available: https://graph-tool.skewed.de/
2014
-
[29]
Exploring network structure, dynamics, and function using networkx,
A. Hagberg, P. Swart, and D. S Chult, “Exploring network structure, dynamics, and function using networkx,” Los Alamos National Lab.(LANL), Los Alamos, NM (United States), Tech. Rep., 2008. [Online]. Available: https://networkx.github.io/
2008
-
[30]
The igraph software package for complex network research,
G. Csardi and T. Nepusz, “The igraph software package for complex network research,” InterJournal, vol. Complex Systems, p. 1695, 2006. [Online]. Available: http://igraph.org
2006
-
[31]
Nature and diffusion of gynecologic cancer–related misinformation on social media: Analysis of tweets,
L. Chen, X. Wang, and T.-Q. Peng, “Nature and diffusion of gynecologic cancer–related misinformation on social media: Analysis of tweets,” Journal of Medical Internet Research , vol. 20, no. 10, p. e11515, 2018
2018
-
[32]
graph2vec: Learning distributed representations of graphs,
A. Narayanan, M. Chandramohan, R. Venkatesan, L. Chen, Y . Liu, and S. Jaiswal, “graph2vec: Learning distributed representations of graphs,” arXiv preprint arXiv:1707.05005 , 2017
2017 arXiv
Reviewed August 14, 2026 · model on record in the stance chip above.
Discussion (0). Continue with ORCID to comment.