REVIEW 2 major objections 3 minor 42 references
Localized Transient Jamming in Discontinuous Shear Thickening
T0 review · 2 major / 3 minor · reviewed 2026-08-14 · deepseek-v4-flash
Pith's one-line read Large fluctuations at the onset of discontinuous shear thickening are localized transitions to a fully jammed, gap-spanning solid that contacts both shearing boundaries.
desk verdict Direct boundary-stress imaging shows DST stress spikes are localized, counter-propagating high-stress events, but the 'fully jammed solid' interpretation is an inference, not a measurement. read the letter →
The pith
A machine-rendered reading of the paper's core claim, the machinery that carries it, and where it could break.
The reading
What carries the argument
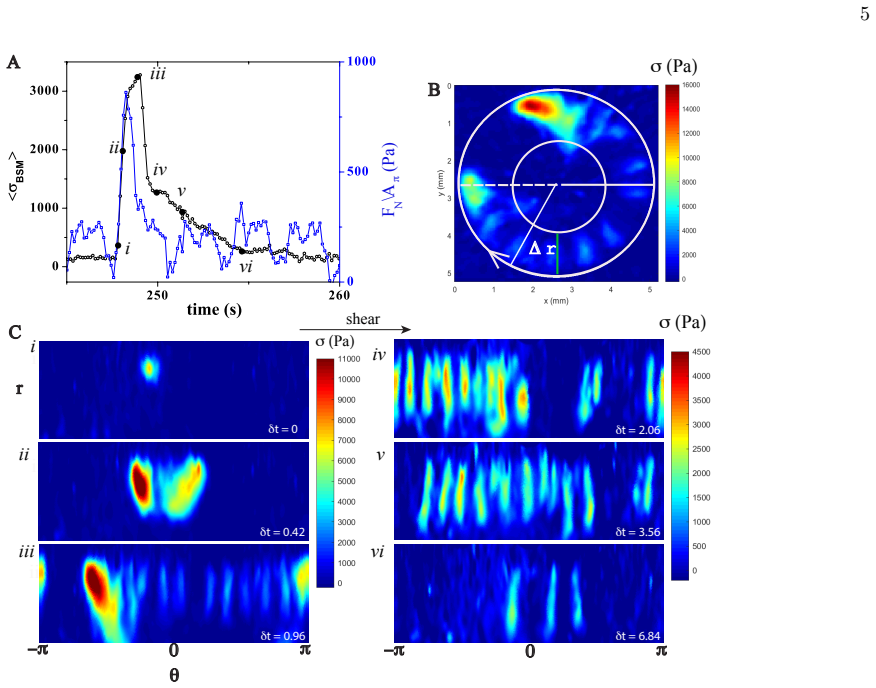
Boundary stress microscopy (BSM) is the central tool: fluorescent tracer beads are embedded on a thin, soft PDMS film, their motion under shear is tracked by particle image velocimetry, and a traction-force inversion converts the film's deformation into a map of shear stress at the suspension boundary. The object it reveals is the solid-like phase (SLP), a localized, gap-spanning region of frictional contacts that behaves like a jammed solid and presses directly against the plates. BSM is what lets the paper connect the bulk rheometer's stress spikes to specific spatial events: nucleation near the outer edge, fracture into two counter-propagating SLPs, growth and bifurcation into band-like remnants, and collision-induced stress collapse.
What would settle it
A reader could settle the central claim by repeating the measurement with a rigid transparent bottom plate or with simultaneous through-gap particle tracking: if the high-stress regions contain particles that keep flowing relative to both boundaries, rather than forming a frozen, gap-spanning solid, then the interpretation of DST bursts as transient jamming events would be refuted.
Extended reading notes
Core claim
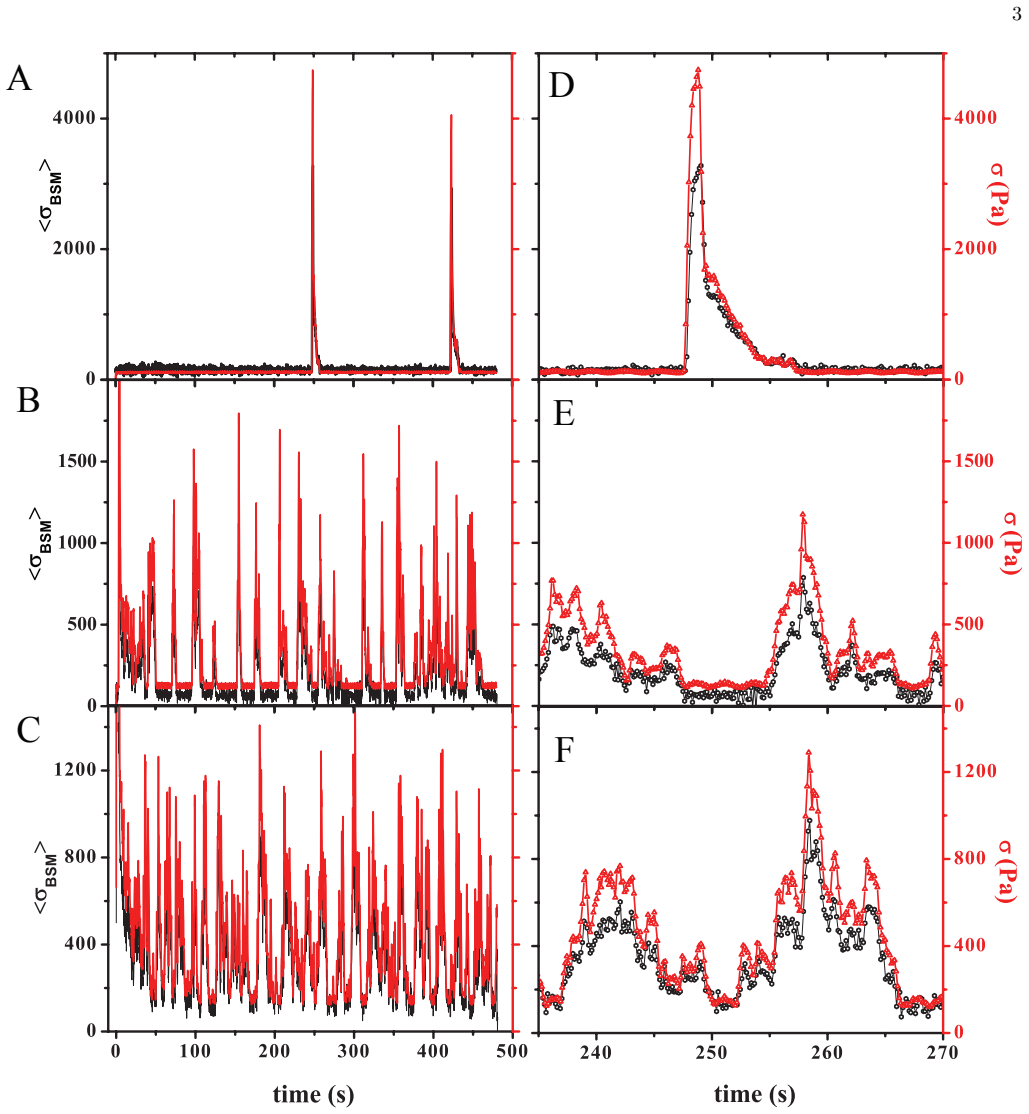
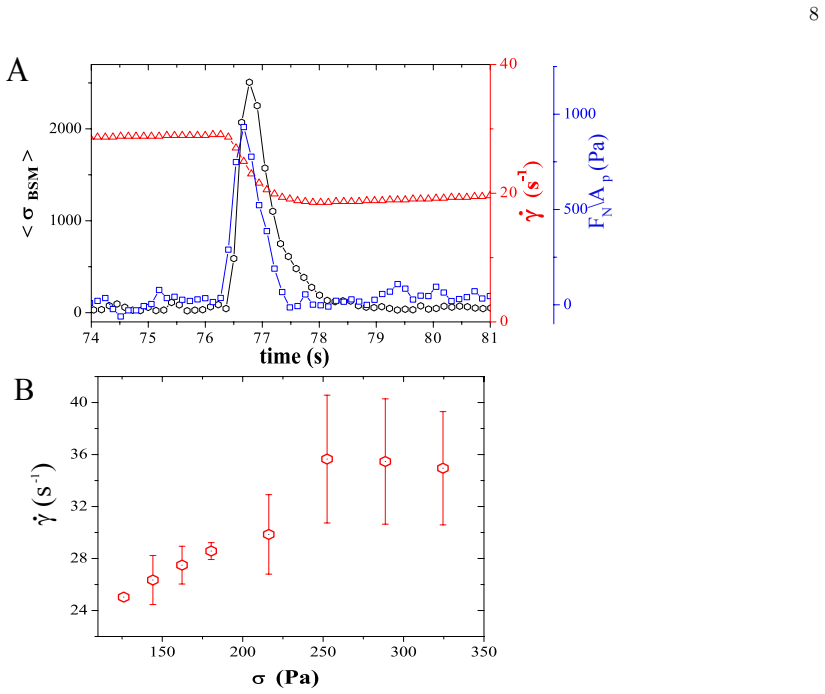
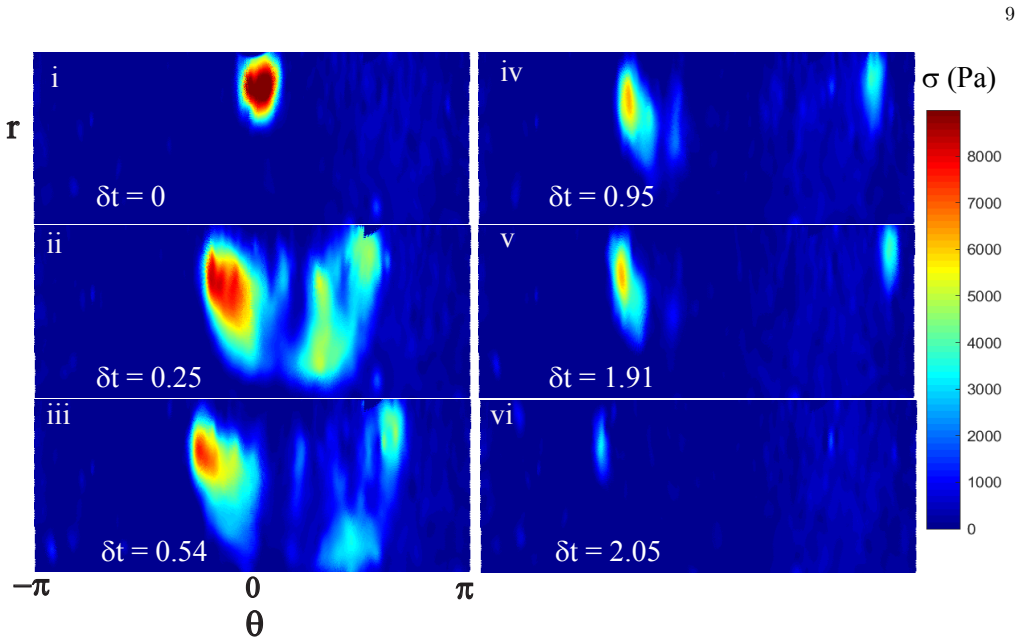
Using boundary stress microscopy over the entire surface of a dense suspension at volume fraction 0.56, the authors find that the intermittent stress spikes in discontinuous shear thickening are not homogeneous bulk events but localized transitions to a state with very high stress, consistent with a fully jammed solid-like phase (SLP) that makes direct frictional contact with the shearing boundaries. The SLP rapidly fractures into two separate regions, one anchored to the bottom plate and moving slowly upstream, the other anchored to the top plate and moving downstream; these regions grow, bifurcate, leave band-like remnants, and eventually collide, at which point the stress abruptly drops. In constant applied stress mode, the same nucleation and bifurcation occurs, but the high-stress regions quickly erode because the shear rate drops below the critical value. The measured average boundary stress closely tracks the rheometer stress at constant shear rate, and the events are accompanied by strong positive normal force, indicating dilatancy. This establishes a direct connection between localized, transient jamming at the boundaries and the macroscopic fluctuations that define DST.
Load-bearing premise
The entire picture rests on the assumption that deformations of the soft elastic boundary, measured by tracking beads, faithfully report the local shear stress at the suspension-boundary interface, and that this compliant boundary does not qualitatively change the jamming dynamics; the paper estimates 10–20% uncertainty in film thickness and modulus, which propagates directly into the inferred stress magnitudes.
Editorial extensions
If this is right
- Bulk stress fluctuations at the onset of DST are caused by localized, transient jamming events that contact both plates, not by a homogeneous fluid transition.
- Each high-stress event follows a reproducible life cycle: nucleation near the outer edge, fracture into two counter-propagating SLPs, growth and bifurcation into band-like remnants, collision, and annihilation with a sudden stress drop.
- In constant-stress mode, the applied torque hides the local stress jumps; boundary stress maps reveal them, so interpreting DST from bulk rheometer torque alone can miss the dominant local physics.
- The strong positive normal force during events indicates that dilatancy is an integral part of the jamming cycle, not a side effect.
- The spatiotemporal evolution depends on measurement mode: at constant shear rate SLPs grow and collide, while at constant stress they nucleate and quickly erode.
Reading between the lines
- The DST transition is intrinsically spatiotemporal and boundary-condition dependent, so continuum models must couple local stress, density, and non-affine flow rather than assuming a homogeneous frictional branch.
- Boundary compliance may tune event dynamics: stiffer or rougher plates could alter SLP lifetimes, band spacing, and collision frequencies, a testable prediction of this picture.
- In constant-stress rheometers, apparent steady-state flow curves in DST may be temporal averages over repeated jamming-erosion cycles, and true local stresses can exceed the applied torque value by orders of magnitude, which matters for interpreting S-shaped flow curves and for process control.
- Extending BSM to suspensions with attractive particles or rods could reveal whether the same fracture-collision cycle underlies thickening in those systems.
Signed reviews
Editorial analysis
A structured set of objections, weighed in public.
Referee Report
Summary. This paper reports spatially resolved measurements of the shear stress transmitted to the bottom boundary of a dense (phi=0.56) colloidal suspension in the discontinuous shear thickening (DST) regime, using boundary stress microscopy (BSM) in a parallel-plate rheometer. At shear rates just above a critical value, the bulk stress exhibits intermittent large spikes; the BSM stress maps show that these spikes correspond to localized high-stress regions nucleated near the plate edge. These regions split into two counter-propagating structures, leave behind band-like high-stress remnants, and subsequently collide and decay. The authors interpret the high-stress regions as fully jammed solid-like phases (SLPs) that make direct frictional contact with the boundaries, and they develop a schematic model (Fig. 8) in which the SLP fractures, the two portions remain anchored to opposite plates, grow, and eventually collide. In constant applied stress mode, BSM reveals transient boundary-stress spikes during abrupt drops in shear rate that are not visible in the (constant) rheometer torque signal.
Significance. If the interpretation is accepted, this is an important experimental contribution: it provides the first direct spatial visualization of transient localized jamming events in DST and shows that bulk stress fluctuations are controlled by boundary-anchored, almost solid regions. The close temporal tracking of the bulk stress by the summed BSM signal, the concurrent normal-force spikes, and the control experiment without the PDMS layer are strong strengths, and the data will be valuable for testing models of shear thickening. The main caveat is that BSM measures boundary traction, not the internal state of the suspension, so the assignment of the high-stress regions to fully jammed solids rather than high-viscosity fluid phases is an inference that needs to be either supported by additional measurements or presented more cautiously.
major comments (2)
- [Discussion, 'Model for Dynamics of High Stress Phases' (Fig. 8)] The paper's central narrative—that the high-stress regions are fully jammed, gap-spanning solid-like phases (SLPs) that fracture into two counter-propagating parts and later collide—is not directly supported by the measurements. BSM maps the traction at the compliant boundary, not the velocity, strain, or contact network inside the gap. The observed stress patterns and normal-force spikes are consistent with SLPs, but they are also consistent with localized high-viscosity frictional-fluid patches of the type invoked for CST in the authors' own prior work; the propagation kinematics alone do not distinguish these possibilities. Because the fracture and collision model depends on the regions being actual solids, this distinction is load-bearing. Please either add direct internal measurements (e.g., tracer tracking within the gap during an event) or explicitly present the SLP as a hypothesis throughout, including the abstract, title, and Fig. 8 caption, rather than as a demonstrated fact. Several steps are already labeled as hypotheses in the Discussion, but the abstract states that a 'jammed solid like phase ... is rapidly fractured' as fact.
- [Methods (definition of average boundary stress)] The formula ⟨σBSM⟩ = ∫_0^R σθ(r) r dA is dimensionally a torque, not a stress, and the plotted comparison with the rheometer stress σ = 2M/(πR^3) in Figs. 2, 5, and 6 is therefore undefined as written. Please state the normalization explicitly (for example, ⟨σBSM⟩ = (2/(πR^3)) ∫ σθ(r) r dA, or the appropriate area average). This is necessary both for reproducibility and for the claim that the BSM signal quantitatively tracks the bulk stress.
minor comments (3)
- [Abstract and Constant Applied Stress section] The abstract says the stress fluctuations are 'completely missed in standard bulk rheology,' but the text later acknowledges that they can be inferred from shear-rate changes with quantitative inertia modeling [32–34]; please soften the abstract to match.
- [Fig. 8 caption and Discussion] The text refers to 'dark green spheres' and 'blue spheres' in Fig. 8, but the colors in the schematic are not sufficiently distinct; please add explicit labels or use more contrasting colors.
- [Fig. 3A] The onset time 'ti = 247.52' lacks units and a clear reference point; please specify seconds from the start of the measurement.
Circularity Check
No significant circularity: direct experimental measurements; interpretations rely on stated external model and prior observations, not on fitted inputs or definitional reductions.
full rationale
This is an experimental study with no parameter fitting, no derived equation whose output is reused as an input, and no prediction that is equivalent by construction to a fitted quantity. The BSM stress maps are computed from measured elastic substrate deformation via a published traction-force inversion (ref. 31), and the bulk rheometer stress and normal force are independent measurements; the paper explicitly compares the two (Figs. 2 and 5). The central interpretation of localized high-stress regions as gap-spanning solid-like phases is an inference from boundary stress kinematics, normal-force dilatancy, and prior direct imaging of arrested tracers [16], not a renaming of the input stress data. The authors repeatedly flag the inferential and speculative parts ('We hypothesize...', 'It is unclear why...', 'we cannot directly measure local normal stresses'), which indicates that the claim is not being asserted as a definitional consequence of the measurement. Self-citations to the authors' earlier BSM work supply the technique and prior CST context, but the DST-specific observations are new data and the interpretation is grounded in the independently developed Wyart-Cates model [12]. No circular step can be exhibited: no equation in the paper reduces a target result to its own input, and no fitted parameter is relabeled as a prediction. The closest concern is that the SLP interpretation goes beyond what boundary stress alone proves, but that is a correctness/evidential limitation, not circularity.
Assumptions & free parameters
assumptions (4)
- domain assumption Boundary stress microscopy maps substrate deformation to boundary shear stress via linear elasticity (traction force microscopy).
- domain assumption The Wyart-Cates model, which postulates a stress-induced transition from hydrodynamic to frictional contacts, applies to this suspension.
- domain assumption The suspension is homogeneous and the parallel-plate geometry has uniform concentration and gap at the measurement scale.
- domain assumption The normal force reported by the rheometer is a reliable indicator of dilatancy and particle-boundary contact.
invented entities (1)
-
Solid-like phase (SLP)
Cite this review
Pith. "Pith review of Localized Transient Jamming in Discontinuous Shear Thickening." pith.science (2026). https://pith.science/paper/YKU2ZDSK
@misc{pith2026190802856,
  author       = {Pith},
  title        = {Pith review of: Localized Transient Jamming in Discontinuous Shear Thickening},
  year         = {2026},
  howpublished = {\url{https://pith.science/paper/YKU2ZDSK}},
  note         = {Machine review of arXiv:1908.02856}
}
read the original abstract
We report direct measurements of spatially resolved surface stresses over the entire surface of a dense suspension during discontinuous shear thickening (DST) using Boundary Stress Microscopy (BSM) in a parallel-plate rheometer. We find that large fluctuations in the bulk rheological response at the onset of DST are the result of localized transitions to a state with very high stress, consistent with a fully jammed solid that makes direct contact with the shearing boundaries. That jammed solid like phase (SLP) is rapidly fractured, producing two separate SLPs that propagate in opposite directions. By comparing the speed of propagation of the SLPs with the motion of the confining plates, we deduce that one remains in contact with the bottom boundary, and another remains in contact with the top. These regions grow, bifurcate, and eventually interact and decay in a complex manner that depends on the measurement conditions (constant shear rate vs constant stress). In constant applied stress mode, BSM directly reveals dramatic stress fluctuations that are completely missed in standard bulk rheology.
Figures

Figures from the paper (5 more)



Reference graph
Works this paper leans on
-
[1]
H. A. Barnes, “Shear thickening ”dilatancy” in suspen- sions of non aggregating solid particles dispersed in New- tonian fluids”, J. Rheol. 33, 329 (1989). 10 A G F E D C B FIG. 8: Schematic of evolution of the solid-like phases (SLPs) inferred from the BSM measurements. (A) The relatively homogeneous, smoothly sheared suspension is interrupted by a gap-sp...
work page 1989
-
[2]
Giant Stress Fluctuations at the Jamming Transition
D. Lootens , H. Van Damme & H. Pascal, “Giant Stress Fluctuations at the Jamming Transition”,Phy. Rev. Lett. 90, 178301 (2003)
work page 2003
-
[3]
B. J. Maranzano & N. J. Wagner, ”The effects of par- ticle size on reversible shear thickening of concentrated colloidal dispersions”, J. Chem. Phys. 114, 10514 (2001)
work page 2001
- [4]
-
[5]
Shear Thickening of Cornstarch Suspensions as a Reen- trant Jamming Transition
A. Fall, N. Huang, F. Bertrand, G. Ovarlez & D. Bonn, “Shear Thickening of Cornstarch Suspensions as a Reen- trant Jamming Transition”, Phys. Rev. Lett. 100, 018301 (2008)
work page 2008
-
[6]
Fall A, Bertrand F, Hautemayou D, Meziere C, Moucheront P, Lemaitre, A & Ovarlez G (2015) Macro- scopic Discontinuous shear thickening versus local shear jamming in cornstarch. Phys. Rev. Lett. 114:098301
work page 2015
-
[7]
Towards a unified description of the rheology of hard-particle sus- pensions
B. M. Guy, M. Hermes & W. C. K. Poon, “Towards a unified description of the rheology of hard-particle sus- pensions”, Phys. Rev. Lett. 115, 088304 (2015)
work page 2015
-
[8]
Dilatant flow of concentrated suspensions of rough par- ticles
D. Lootens, H. Van Damme, Y. Hemar, and P. Hebraud, “Dilatant flow of concentrated suspensions of rough par- ticles” Phys. Rev. Lett. 95, 268302 (2005)
work page 2005
Show all 42 references
-
[9]
N. J. Wagner & J. F. Brady Shear thickening in colloidal dispersions, Physics Today 62(10), 27 (2009)
2009
-
[10]
S-shaped flow curves of shear thickening suspensions: Direct obser- vation of frictional rheology
Z. Pan, H. de Cagny, B. Weber, and D. Bonn, “S-shaped flow curves of shear thickening suspensions: Direct obser- vation of frictional rheology”, Phys. Rev. E 92, 032202 (2015)
2015
-
[11]
Microscopic Mechanism for Shear Thickening of Non-Brownian Suspensions
N. Fernandez et al., “Microscopic Mechanism for Shear Thickening of Non-Brownian Suspensions”, Phys. Rev. Lett. 111, 108301 (2013)
2013
-
[12]
Discontinuous shear thicken- ing without inertia in dense non-Brownian suspensions
M. Wyart & M .E. Cates, “Discontinuous shear thicken- ing without inertia in dense non-Brownian suspensions”, Phys. Rev. Lett. 112:098302 (2014)
2014
-
[13]
Rheological chaos of frictional grains
M. Grob, A. Zippelius & C. Heussinger, “Rheological chaos of frictional grains”, Phy. Rev. E 93,030901 (2016)
2016
-
[14]
Rheological Signa- ture of Frictional Interactions in Shear Thickening Sus- pensions
J. Royer, D. L. Blair, & S. Hudson, “Rheological Signa- ture of Frictional Interactions in Shear Thickening Sus- pensions” Phy. Rev. Lett. 116, 188301 (2016)
2016
-
[15]
Hydrodynamic and Contact Contributions to Continuous Shear Thickening in Col- loidal Suspensions
N. Y. C. Lin, B. M. Guy, M. Hermes, C. Ness, J. Sun, W. C. K. Poon & I. Cohen “Hydrodynamic and Contact Contributions to Continuous Shear Thickening in Col- loidal Suspensions”, Phys. Rev. Lett. 115, 228304 (2015)
2015
-
[16]
Localized stress fluctuations drive shear thickening in dense sus- pensions
V. Rathee, D. L. Blair, and J. S. Urbach, “Localized stress fluctuations drive shear thickening in dense sus- pensions”, Proc. Natl. Acad. Sci. U.S.A. 114, 8740-8745 (2017)
2017
-
[17]
Dis- continuous Shear Thickening of Frictional Hard-Sphere Suspensions
R. Seto, R. Mari, J. F. Morriss & M. M. Denn, “ Dis- continuous Shear Thickening of Frictional Hard-Sphere Suspensions”, Phys. Rev. Lett. 111, 218301 (2013)
2013
-
[18]
Continuous shear thickening and colloid surfaces
J. R. Melrose , J. H. Van Vliet, R. C. Ball, “Continuous shear thickening and colloid surfaces”, textitPhys. Rev. Lett. 77, 4660-4663 (1996)
1996
-
[19]
The rheology of Brownian suspen- sions
G. Bossis, J. Brady, “ The rheology of Brownian suspen- sions” J Chem Phys 91, 1866-1874 (1989)
1989
-
[20]
Microstructure and rheology relationships for shear thickening colloidal dis- 11 persions
A. K. Gurnon and N. J. Wagner, “Microstructure and rheology relationships for shear thickening colloidal dis- 11 persions.” J. Fluid Mech. 769, 242-276 (2015)
2015
-
[21]
Shear thickening, frictionless and frictional rheologies in non-Brownian sus- pensions
R. Mari, R. Seto, J. Morris, M. Denn, “Shear thickening, frictionless and frictional rheologies in non-Brownian sus- pensions”, J. Rheol. 58, 1693 (2014)
2014
-
[22]
Discontinuous shear thickening in Brownian suspensions by dynamic simulation
R. Mari, R. Seto, J. Morris, M. Denn, “Discontinuous shear thickening in Brownian suspensions by dynamic simulation”, Proc. Natl. Acad. Sci. U.S.A. 112, 15326 (2015)
2015
-
[23]
Pairwise frictional profile between parti- cles determines discontinuous shear thickening transition in non-colloidal suspensions
J. Comtet, G. Chatte, A. Nigues, L. Bocquet, A. Siria, and A. Colin, “Pairwise frictional profile between parti- cles determines discontinuous shear thickening transition in non-colloidal suspensions”, Nature Communications 8, 15633 (2017)
2017
-
[24]
Revealing the frictional transition in shear-thickening suspensions
C. Clavaud, A. Brut, B. Metzger, Y. Forterre, “Revealing the frictional transition in shear-thickening suspensions”, Proc. Natl. Acad. Sci. U.S.A. 114 5147 (2017)
2017
-
[25]
Un- steady flow, clusters and bands in a model shear- thickening fluid
S. Saw, M. Grob, A. Zippelius, & C. Heussinger, “Un- steady flow, clusters and bands in a model shear- thickening fluid”, arXiv:1905.06174 (2019)
2019 arXiv
-
[26]
Uncov- ering instabilities in the spatiotemporal dynamics of a Shear-Thickening cornstarch suspension
B. Saint-Michel, T. Gibaud & S. Manneville, “ Uncov- ering instabilities in the spatiotemporal dynamics of a Shear-Thickening cornstarch suspension”, Phys. Rev. X 8, 031006 (2018)
2018
-
[27]
Stress Heterogeneities in Sheared Type-I Collagen Net- works Revealed by Boundary Stress Microscopy
R. C. Arevalo, P. Kumar, J. S. Urbach & D. L. Blair, “Stress Heterogeneities in Sheared Type-I Collagen Net- works Revealed by Boundary Stress Microscopy”, PLoS ONE 10: e011802 (2015)
2015
-
[28]
Con- tact Networks Enhance Shear Thickening in Attractive Colloids
N. Park, V. Rathee, D. L. Blair, J. C. Conrad, “Con- tact Networks Enhance Shear Thickening in Attractive Colloids”, Phys. Rev. Lett. 122, 228003 (2019)
2019
-
[29]
The gap between rheometer plates was fixed at 0.2 mm
using a home made parallel plate tool of diameter 5.2 mm diameter. The gap between rheometer plates was fixed at 0.2 mm. A 1.6X objective was used for imaging and produced a 5.6 X 5.6 mm2 field of view. Deformation fields were determined with particle image velocimetry (PIV) in I...
-
[30]
Devel- opment of a confocal rheometer for soft and biological materials
S. K. Dutta, R. Arevalo, A. Mbi, D. L. Blair, “ Devel- opment of a confocal rheometer for soft and biological materials”, Rev Sci Instrum 84:063702 (2013)
2013
-
[31]
Spatial organization of the extracel- lular matrix regulates cellcell junction positioning
Q. Tseng Q, et al., “Spatial organization of the extracel- lular matrix regulates cellcell junction positioning”, Proc Natl Acad Sci USA 109:15061511 (2012)
2012
-
[32]
Traction force microscopy in physics and biology
R. W. Style et al., “Traction force microscopy in physics and biology” Soft Matter 10, 40474055 (2014)
2014
-
[33]
Fluctuations in flow produced by competition between apparent wall slip and dilatancy
R. J. Larsen, J. W. Kim, C. F. Zukoski, D. A. Weitz, “Fluctuations in flow produced by competition between apparent wall slip and dilatancy”; Rheol Acta 53, 333347 (2014)
2014
-
[34]
Bossis at al
G. Bossis at al. (2017) Discontinuous shear thickening in the presence of polymers adsorbed on the surface of calcium carbonate particles. Rheol. Acta. 56, 415-430
2017
-
[35]
Competing Timescales Lead to Os- cillations in Shear-Thickening Suspensions
J. A. Richards, J. R. Royer, B. Liebchen, B. M. Guy, & W. C. K. Poon1, “Competing Timescales Lead to Os- cillations in Shear-Thickening Suspensions”, Phys. Rev. Lett. 123, 038004 (2019)
2019
-
[36]
Exper- imental Observation of Shear Thickening Oscillation
S.-I. Nagahiro, H. Nakanishi, and N. Mitarai, “Exper- imental Observation of Shear Thickening Oscillation”, Europhys. Lett. 104, 28002 (2013)
2013
-
[37]
Normal stresses in shear thickening granular suspensions
Z. Pan, H. de Cagny, M. Habibi, and D. Bonn, “ Normal stresses in shear thickening granular suspensions” Soft Matter 13, 3734-3740 (2017)
2017
-
[38]
Experimental measurements of the normal stresses in sheared Stokesian suspensions
A. Singh, P. R. Nott, “Experimental measurements of the normal stresses in sheared Stokesian suspensions”, J. Fluid Mech. 490:293320 (2003)
2003
-
[39]
Fluid Dynamics of Dilatant Fluids
H. Nakanishi, S.-I. Nagahiro, and N. Mitarai, “Fluid Dynamics of Dilatant Fluids”, Phys. Rev. E 85, 011401(2012)
2012
-
[40]
Unraveling the Role of Fric- tional Contacts and Particle Orientational Order Dur- ing Shear-thickening in Suspensions of Colloidal Rods
V. Rathee, S. Arora, D. L. Blair, J. S. Urbach, A. K. Sood, R. Ganapathy, “Unraveling the Role of Fric- tional Contacts and Particle Orientational Order Dur- ing Shear-thickening in Suspensions of Colloidal Rods”, arXiv:1906.06356 (2019)
2019 arXiv
-
[41]
Hermes, B
M. Hermes, B. M. Guy, W. C. K. Poon, G. Poy, M. E. Cates & M. Wyart (2016) Unsteady flow and particle migration in dense, non-Brownian suspensions. J Rheol. 60(5):905-916
2016
-
[42]
Time?dependent behavior and wall slip in concentrated shear thickening dispersions
W. Boersma, P. Baets, J. Laven, H. Stein, H. “Time?dependent behavior and wall slip in concentrated shear thickening dispersions”, J Rheol. 35, 1093 (1991). 12 SUPPLEMENT AR Y INFORMA TION SUPPLEMENT AR Y VIDEO CAPTIONS Supplementary Movie 1: Spatiotemporal dynamics of high st...
1991
Reviewed August 14, 2026 · model on record in the stance chip above.
Discussion (0). Continue with ORCID to comment.