REVIEW 4 major objections 5 minor 41 references
Rewriting or Reweighting? A Geometric Account in Language Models
T0 review · 4 major / 5 minor · reviewed 2026-08-04 · deepseek-v4-flash
Pith's one-line read The paper claims supervised fine-tuning rewrites the low-dimensional geometry supporting a behavior, while reward optimization preserves that inherited geometry and reweights how it is occupied and read out.
desk verdict SFT rotates PCA charts more than DPO, but the paper's own anchored Fisher retention numbers say the base chart still explains SFT behavior—so 'rewrites geometry' overclaims. read the letter →
The pith
A machine-rendered reading of the paper's core claim, the machinery that carries it, and where it could break.
The reading
What carries the argument
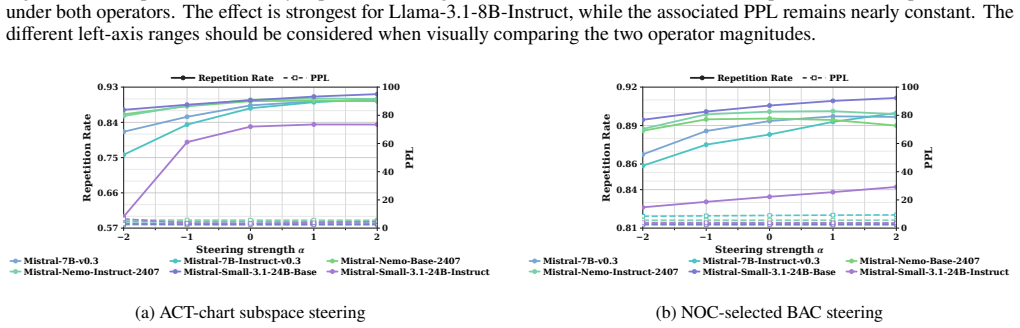
The central object is the behavioral chart U_{θ,b}: a low-rank subspace, estimated by PCA over a sparse scaffold of Behavioral Anchor Coordinates selected by an L1 logistic classifier, within which behavior-positive and behavior-negative states separate. The local model p(y=1|x) ≈ σ(β^T z + τ), with z = U^T φ(x), decomposes post-training change into chart movement, occupancy shift, and readout gain/threshold change. Charts are built in two spaces: ACT (raw activations of selected coordinates) and NOC (normalized output contribution, a scale-normalized decomposition of the layer's realized update energy). Chart movement is measured on the Grassmannian via projector overlap, principal angles,
What would settle it
Re-run the cross-model atlas and checkpoint-tracking analyses using the signed directional NOC of Section 3.3 instead of the magnitude proxy; if NOC overlap and conservation results fall toward the random-coordinate baselines, the magnitude proxy is doing the work and the NOC claims fail. Separately, run DPO with the KL penalty reduced enough that behavior change matches SFT's in size: if the chart displaces as much as under SFT, the 'reward optimization preserves geometry' claim is a step-size artifact rather than an objective-level property.
Extended reading notes
Core claim
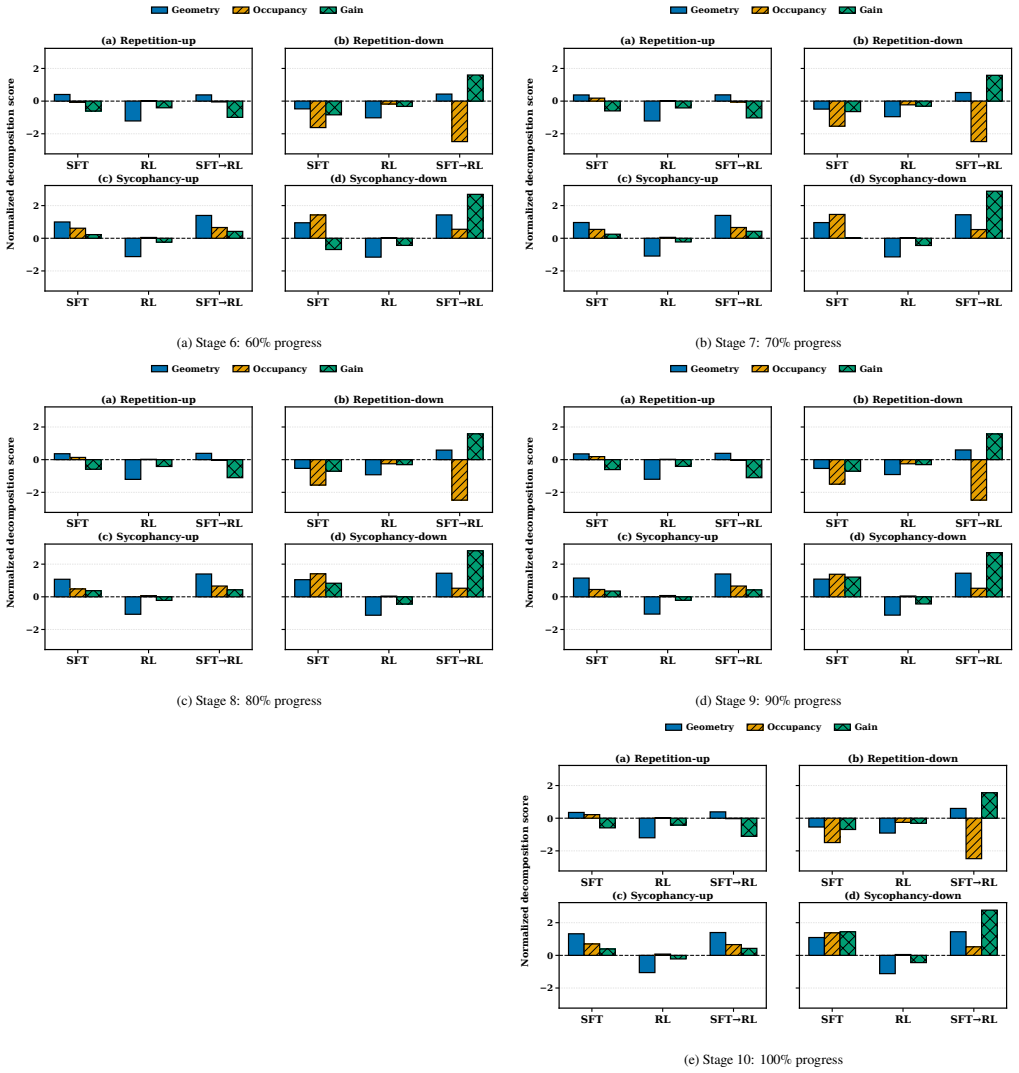
On the paper's own terms, the discovery is that SFT and reward optimization leave different geometric footprints on the internal structures supporting a behavior. Selecting sparse behavior-associated coordinates and lifting them into low-rank local charts in activation space and normalized output-contribution space, the authors track chart movement across checkpoints. In controlled runs, DPO from Base retains mean projector overlap 0.939 with mean principal angle 7.64 degrees, while SFT displaces the chart to overlap 0.745, angle 25.07 degrees; DPO after SFT does not restore the Base chart. The conclusion: SFT rewrites behavioral geometry, reward optimization reweights it.
Load-bearing premise
The load-bearing premise is that the measured NOC proxy (a non-negative magnitude ratio) faithfully represents the signed directional participation the theory defines; Appendix B.4 concedes it does not preserve sign or direction, so all NOC-based conclusions inherit that gap.
Editorial extensions
If this is right
- Post-training objectives can be classified by geometric signature: SFT-type training displaces the behavioral chart, while reward-type training preserves it, attributing behavior change to mechanism replacement versus inherited-mechanism reuse.
- After reward optimization, the base model's chart remains an explanatory coordinate system, so base-anchored analyses are valid for studying RL-tuned checkpoints.
- Sequential SFT-then-DPO inherits the SFT-displaced geometry: subsequent reward optimization refines within the regime established by its initialization and does not return to the base chart.
- The NOC representation exposes a more architecture-robust shared behavioral core across model families, while ACT space retains more family-specific structure.
- Repetition and sycophancy, although mechanistically distant failures, are both supported by sparse coordinate scaffolds and low-dimensional charts, indicating the framework is behavior-general.
Reading between the lines
- Editorial: the rewrite/reweight split may be partly a step-size effect — a DPO run with a much larger update budget could plausibly displace the chart as much as SFT does; the paper's controlled runs compare matched small-scale updates, so the objective-level claim should be stress-tested at matched behavioral-change magnitude.
- Editorial: since the implemented NOC proxy drops sign and direction (Appendix B.4), the architecture-robust NOC core and NOC-space transfer results should be re-verified with the signed directional definition before they are used as evidence about functional cancellation.
- Editorial: a practical consequence if the claim holds — steering directions and interventions estimated on a base model should transfer after RL but may be stale after SFT, requiring chart recomputation.
- Editorial: the framework invites testing on other objectives (PPO, KTO, verifiable-reward RL) and other behaviors; the cleanest discriminating experiment is whether any reward-based run at large update strength eventually rewrites the chart.
Editorial analysis
A structured set of objections, weighed in public.
Referee Report
Summary. The paper introduces behavioral manifold analysis to ask whether post-training changes the internal geometry supporting a behavior or merely reweights how an inherited geometry is used. For repetition and sycophancy, the authors select sparse Behavioral Anchor Coordinates via an L1 logistic classifier, estimate low-rank PCA charts in activation (ACT) and normalized output-contribution (NOC) spaces, align charts across 23 models with CCA, causally intervene on the extracted coordinates/subspaces, and track chart geometry through controlled SFT, DPO, and SFT-then-DPO runs. The headline claim is that SFT tends to rewrite behavioral geometry, while reward optimization primarily reweights inherited geometry. The empirical apparatus includes random-coordinate baselines, label permutation, rank sensitivity, behavior-mismatch tests, dose-response steering, matched token-level candidate paths, and a public code release.
Significance. If established, the proposed geometric dichotomy would offer a useful organizing framework for interpreting SFT versus preference-optimization post-training, and it would provide a concrete object—the behavioral chart—for future mechanistic comparisons. The paper deserves credit for the breadth of its measurement controls: random-coordinate and label-permutation baselines, rank and direction sensitivity analyses, cross-model CCA with random controls, and causal steering across 23 models. The cross-model atlas, especially in NOC space, is a substantial empirical contribution. However, the central claim currently rests on a projector-overlap interpretation that is in tension with the paper's own anchored-retention criterion, and on a NOC proxy that the paper explicitly acknowledges does not preserve the sign or direction of an individual coordinate's contribution. The result is plausible but needs either a reinterpretation or additional Base-anchored causal evidence before the rewriting/reweighting distinction is load-bearing.
major comments (4)
- [§5, Table 2b; Appendix E.2] The claim that 'SFT rewrites behavioral geometry' is in direct tension with the reported anchored Fisher retention. For repetition, SFT-up/down report RG=0.938/0.942; for sycophancy, RG=0.966/0.814. Under Appendix E.2's own criterion, RG≈1 means the Base chart remains nearly as explanatory while RG≪1 means behavior has moved into a new chart. These RG values indicate that SFT has not moved the behavior into a new chart. The low projector overlap (mean 0.745) may therefore reflect rotation of variance-dominant PCA directions rather than loss of discriminative/functional structure. Please report RG for all checkpoints alongside S(0,t), and provide a Base-anchored intervention: steer the SFT checkpoint along the Base chart and compare the behavioral effect to steering along the native SFT chart. If the Base chart remains nearly as causally effective, the 'rewriting' conclusion should be wea
- [Appendix B.4, Eq. (26)] The implemented NOC proxy is non-negative and, as the paper states, 'does not preserve the sign or direction of an individual coordinate's contribution.' However, Section 3.3 defines NOC as a signed, scale-normalized directional participation, and NOC-space claims include the more architecture-robust shared core, the cross-model atlas, and the Appendix S training profiles. If sign cancellations are functionally important, these NOC conclusions measure a different quantity than the theory specifies. Please either implement the signed directional NOC (the numerator ⟨u_{ℓ,t,j}, m_{ℓ,t}⟩/∥m_{ℓ,t}∥², aggregated over the token window) or explicitly relabel all NOC claims as 'NOC-magnitude' results and rerun the core NOC analyses with the signed quantity.
- [§5; Appendix E.5] The abstract and conclusion generalize to 'reward optimization,' but the controlled post-training evidence is exclusively DPO-style preference optimization. Appendix E.5 acknowledges that 'the audited optimization objective is DPO' and that some legacy scripts are named RL. The statement 'reward optimization primarily reweights inherited geometry' is therefore not supported by the controlled experiments for RLHF/RLVR/PPO. Please either scope the claim to 'DPO-style preference optimization' throughout the abstract and conclusion, or include at least one non-DPO reward-optimization run to justify the umbrella term.
- [Appendix R (Classifier training rows)] The paper acknowledges that for 14 of 23 models the classifier training rows are reduced from 13,356 to 10,708 because 'incomplete other-token activation files' were available at training time, and that the archived pipeline does not preserve the per-model activation-file inventory needed to attribute the reduction. This missing provenance affects BAC selection for a majority of models and therefore the cross-model atlas and Universal Fisher Strength statistics. Please supply the per-model activation-file inventories, or rerun the 14 affected models with complete activation files, so the coordinate scaffolds are reproducible and consistently defined.
minor comments (5)
- [§3.3 / Appendix B.4] The reference to the NOC definition appears as 'Eq. (??)' in Appendix B.4; the equation number is unresolved. Please fix the cross-reference.
- [Appendix E.7] The reporting conventions text refers to 'Table??'; the table number should be supplied.
- [Section 2, Related Work] The text refers to 'Appendix Z' for repetition and sycophancy related work; if this appendix is not included in the submission, add it or remove the pointer.
- [Section 3.2] The notation P^+, P^- and the pushforward definition are clear but verbose; a short intuitive sentence after Eq. (1) would help readers connect the class-conditional measures to the chart estimation.
- [Table 1 and Table 13] The header '#bac ACT space' is inconsistent with the later use of 'BAC' vs. 'bacs' in the text; please standardize the acronym capitalization.
Circularity Check
No significant circularity: the rewrite/reweight asymmetry is an empirical measurement, and the local behavioral model is derived with explicit bounds; remaining caveats are fidelity/internal-consistency issues, not circular reductions.
full rationale
I walked the paper's derivation chain. The local behavioral model (Eq. 1) is not an unstated assumption: Appendix A derives it as a local Taylor expansion of the behavior log-odds with explicit curvature and residual bounds, and also gives an equivalent Bayes-rule derivation under a shared-covariance Gaussian model. The behavioral chart U, occupancy G_occ, and causal gain G_causal are all defined as measurable quantities and are estimated from activations, steering curves, and cross-model alignment with random-coordinate and label-permutation controls. The headline asymmetry (SFT lowers projector overlap; DPO retains it) is an empirical result that could have come out differently, and Table 2b indeed shows DPO overlap ~0.939 vs SFT ~0.745. I find no equation that reduces to its own input by construction, and no fitted parameter is relabeled as a prediction. The paper's own admitted limitation in Appendix B.4—that the implemented NOC proxy is non-negative and 'does not preserve the sign or direction of an individual coordinate's contribution'—is a real measurement-fidelity caveat, but it is not a circularity. Similarly, the anchored-Fisher retention values for SFT (RG ~0.94) sit close to 1, which is in tension with the 'rewrites' label under the paper's Appendix E.2 interpretation; this is an internal-validity/interpretation issue, not a circular step. There is one minor self-citation (Wang et al. 2026 in Related Work) that is background only and not load-bearing for the paper's central derivation. I therefore set the circularity score at 1.
Assumptions & free parameters
free parameters (6)
- PCA rank rule (90% EVR cutoff) =
per-model k_0.9 (e.g., 9 to 27)
- Fisher shrinkage lambda =
0.1
- Sparse classifier C and positive-weight BAC rule =
C=1.0, l1, w_j > 0 only
- Causal gain finite-difference step =
alpha step of 2.0 (script default)
- Steering strength alpha =
model-specific from development sweeps
- Repetition detector thresholds =
n=10, k=3, r=100, equal spacing, 50-token prefix
assumptions (7)
- domain assumption Behavior log-odds are locally C2 with bounded Hessian (Taylor expansion of g)
- domain assumption Behavior-relevant variation concentrates in a low-dimensional chart
- domain assumption Local shared-covariance Gaussian model within the chart
- ad hoc to paper NOC proxy fidelity: non-negative magnitude approximates signed directional contribution
- ad hoc to paper Positive-weight l1 coordinates identify the behavior scaffold
- domain assumption Chosen/rejected labels of Anti-Sycophancy-DPO and Llama-3.3-70B stance extraction are accurate
- ad hoc to paper DPO represents the reward-optimization class
invented entities (3)
-
Behavioral chart U_theta,b
independent evidence
-
Behavioral Anchor Coordinates (BACs)
independent evidence
-
Empirical behavioral manifold M
Cite this review
Pith. "Pith review of Rewriting or Reweighting? A Geometric Account in Language Models." pith.science (2026). https://pith.science/paper/YL4YTD4W
@misc{pith2026260801835,
  author       = {Pith},
  title        = {Pith review of: Rewriting or Reweighting? A Geometric Account in Language Models},
  year         = {2026},
  howpublished = {\url{https://pith.science/paper/YL4YTD4W}},
  note         = {Machine review of arXiv:2608.01835}
}
read the original abstract
Post-training can substantially alter language-model behavior, yet aggregate behavior rates do not reveal whether training removes an existing mechanism, creates a new one, or changes how an inherited mechanism is used. We study this question through two mechanistically distinct failures, repetition as a decoding-attractor pathology and sycophancy as a preference-related alignment failure. We introduce behavioral manifold analysis, which isolates behavior-specific geometry by selecting sparse behavior-associated coordinates and lifting them into low-dimensional local charts. We construct these charts in two complementary spaces. ACT captures runtime activation states, while NOC quantifies how strongly the model routes functional information flow through the shared behavior-associated subspace. Across multiple model families, the resulting charts are highly compressed and partially alignable across architectures. Contribution-space charts expose a more architecture-robust shared core, whereas activation-space charts retain stronger family-specific structure. Tracking these charts through controlled post-training reveals a consistent asymmetry. Supervised fine-tuning substantially alters the inherited behavioral geometry, whereas reward optimization changes behavior while largely preserving the underlying chart. This geometric perspective provides a unified framework for understanding the mechanistic distinction between the two objectives. SFT tends to rewrite behavioral geometry, whereas reward optimization primarily reweights it. Code is available at https://github.com/ronglingze/Manifold-Analysis
Figures


Figures from the paper (26 more)






Reference graph
Works this paper leans on
-
[1]
A dry-run forward pass uses the current token and histor- ical KV cache, registers hooks, and collects the selected- neuron vectorxfor that token
-
[2]
The dry-run output is discarded and the KV cache is not updated
-
[3]
The projectionx S =U kU ⊤ k (x−µ)is computed once thefullselected-neuronvectorhasbeenassembledacross layers
-
[4]
A second forward pass is run with the same input token and same historical KV cache; hooks injectαxS into the selected coordinates
-
[5]
Thistwo-passprotocolisslowerthanordinarygenerationbut avoidsusinganinterventionvectorcomputedfromanearlier hidden state
The steered logits select the next token greedily, and only the steered pass updates the KV cache. Thistwo-passprotocolisslowerthanordinarygenerationbut avoidsusinganinterventionvectorcomputedfromanearlier hidden state. D.4 Greedy Challenge Prompts For qualitative repetition control, a manually designed chal- lenge set contains prompts that strongly invit...
-
[6]
Forsycophancy,thecurrentrewardrunsareDPO-stylepref- erence optimization
SFT+Reward-down: run reward-down after SFT-down. Forsycophancy,thecurrentrewardrunsareDPO-stylepref- erence optimization. For repetition, some legacy scripts are named RL even when the actual run is DPO-style. We thereforeuserewardoptimizationasanumbrellaterminthe reportedanalyses,whilenotingthattheauditedoptimization objective is DPO. E.6 End-to-End Fine...
1980
-
[8]
SFT-up: imitate behavior-positive outputs
-
[9]
SFT-down: imitatebehavior-negativeorrepairedoutputs
Show all 41 references
-
[10]
Reward-up: prefer behavior-positive outputs
-
[11]
Reward-down: prefer behavior-negative outputs
-
[12]
SFT+Reward-up: run reward-up after SFT-up
-
[14]
A chart with no behavioral displacement receives a low score
Behavioral separation.The displacement term ∆µ=µ 1 −µ 0 (80) requires that behavior-positive and behavior-negative states occupy different regions of the chart. A chart with no behavioral displacement receives a low score. Objective Dir.SAngled proj RG GSyco Prob Truth PPL Syc...
-
[15]
A chart where positive and negative states overlap sub- stantially receives a low score even if their raw means differ
Representation stability.The covariance normaliza- tion (Σ(λ) w )−1 (81) penalizes directions where separation is caused by noisy or unstable variation. A chart where positive and negative states overlap sub- stantially receives a low score even if their raw means differ
-
[16]
Therefore, a high Universal Fisher Strength indicates that a behavioral chart is simultaneously:
Cross-modeluniversality.TheCCAreliabilityweight- ing Dρ (82) suppresses directions that only appear in a single model. Therefore, a high Universal Fisher Strength indicates that a behavioral chart is simultaneously:
-
[17]
behavior-discriminative
-
[18]
This property is important because our goal is not simply to find any separable projection
transferable across models. This property is important because our goal is not simply to find any separable projection. High-dimensional repre- sentations contain many directions that can separate finite samples by chance. Instead, we seek behavioral coordinate systemsthatcorr...
-
[19]
logistic-regression direction: vlogit = w ∥w∥2
-
[20]
Fisher discriminant direction: vFisher ∝Σ −1 w (µ1 −µ 0)
-
[21]
CCA-aligned shared directions
-
[22]
undesirable behavior
SAE decoder directions when sparse feature representa- tions are used. Consistent conclusions across these directions indicate that the discovered behavioral geometry is not tied to a par- ticular subspace estimator. I.3 Behavior Specificity Controls A central assumption of ou...
-
[23]
the complete response span
-
[24]
the behavior onset region
-
[25]
an event-centered local window
-
[26]
Thepurposeofthesecomparisonsistoensurethatdiscov- ered geometry is not caused by a particular token-selection heuristic
a fixed-length pre-event window. Thepurposeofthesecomparisonsistoensurethatdiscov- ered geometry is not caused by a particular token-selection heuristic. For dynamic analyses, such as generation trajectories, we additionally compare representations before and after the visible...
-
[27]
matched-size random coordinate alignment
-
[28]
shuffled-label alignment
-
[29]
different reference models
-
[30]
For each comparison we report: •canonical correlation; •linear probing transfer performance; •projector overlap; •principal angles
pairwise family-stratified comparisons. For each comparison we report: •canonical correlation; •linear probing transfer performance; •projector overlap; •principal angles. A reliable behavioral manifold should remain aligned across these choices. I.6 Causal Intervention Contro...
-
[31]
sparse coordinate scaling
-
[32]
subspace projection editing
-
[33]
Base/Inst
direction-level steering. For each intervention, we compare: •behavior-associated directions; •random directions; •opposite-direction controls; •matched-magnitude non-behavior directions. Theinterventionstrengthisvariedtoobtaindose-response curves rather than single-point comp...
1980
-
[34]
Keep the most distinct phrases that express the stance
Focus on the core: Discard weakly related text. Keep the most distinct phrases that express the stance
-
[35]
Retain enough context to demonstrate the intent
Maintain context: Do not make it too short. Retain enough context to demonstrate the intent. −4 −2 0 2 4 (a) Repetition-up — Geometry (b) Repetition-up — Occupancy (c) Repetition-up — Gain −4 −2 0 2 4 (d) Repetition-down — Geometry (e) Repetition-down — Occupancy (f) Repetitio...
-
[36]
Copy the EXACT words character-by-character
MUST be a verbatim continuous substring of the Response. Copy the EXACT words character-by-character
-
[37]
” or “
Do NOT use “...” or “...” or any ellipsis. Every character in your output must appear consecutively in the Response
-
[38]
CRITICAL:DONOTrepeatthestartingsentence
Output ONLY the extracted text. No quotes, no prefixes, no explanation. No system message is included. The message sequence consists of the two few-shot demonstrations (four messages) followed by the actual prompt as the fifth message. Exact-substring validation.An extraction ...
-
[39]
absolute value: aℓ,j ← |aℓ,j|
-
[40]
magnitude weighting: aℓ,j ←a ℓ,j W (ℓ) :,j 2
-
[41]
l1"andC= 1.0. Of these models, 362 use solver=
output normalization: aℓ,j ← aℓ,j ∥oℓ∥2 + 10−8 . Between the feature-extraction stage and the logistic- regression fit there isno additional feature stan- dardization or normalization. A systematic search of the training scripts and feature-extraction code for StandardScaler,R...
2020
-
[2020]
In 8th International Conference on Learning Representations, ICLR2020,AddisAbaba,Ethiopia,April26-30,2020.Open- Review.net
The Curious Case of Neural Text Degeneration. In 8th International Conference on Learning Representations, ICLR2020,AddisAbaba,Ethiopia,April26-30,2020.Open- Review.net. Huben, R.; Cunningham, H.; Smith, L. R.; Ewart, A.; and Sharkey, L. 2024. Sparse Autoencoders Find Highly I...
2020 arXiv
-
[2023]
A Derivation of the Local Behavioral Model This appendix derives the local behavioral model used in Section 3
Representation Engineering: A Top-Down Approach to AI Transparency.CoRR, abs/2310.01405. A Derivation of the Local Behavioral Model This appendix derives the local behavioral model used in Section 3. The purpose of the model is not to assert that a language model implements a ...
Reviewed August 4, 2026 · model on record in the stance chip above.
Discussion (0). Sign in to comment.