REVIEW 3 major objections 4 minor 78 references
Towards Precise Prediction Uncertainty in GNNs: Refining GNNs with Topology-grouping Strategy
T0 review · 3 major / 4 minor · reviewed 2026-08-11 · deepseek-v4-flash
Pith's one-line read The paper claims that nodes with the same neighborhood prediction similarity can still be both over- and under-confident depending on their confidence, so calibration should group by both factors and use per-group temperatures.
desk verdict Useful post-hoc calibration recipe; the grouping story is plausible but the topology dimension is not isolated from confidence binning. read the letter →
The pith
A machine-rendered reading of the paper's core claim, the machinery that carries it, and where it could break.
The reading
What carries the argument
The carrying object is the 'Mailbox' neighborhood similarity $M_{\text{simi}}(i) = \frac{1}{|N_i|}\sum_{j\in N_i}\sigma(z_i^\top z_j)$, the average sigmoid of the dot product between a node's logits and its neighbors' logits. Alongside normalized confidence $\bar{p}_i$, it forms the two-dimensional feature vector used for K-means clustering. The group-specific temperatures $T_n$ are then optimized by a loss that directly minimizes the discrepancy between each group's average scaled confidence and its validation accuracy, with an auxiliary cross-entropy term to preserve predictive behavior. The design is meant to replace a single global or node-wise temperature trend with a small number of cluster-wise temperatures, which is also what makes the calibration step fast.
What would settle it
Compute within-cell variance of calibration error using the Mailbox score $M_{\text{simi}}(i)$ over confidence bins on CoraFull with GCN and compare it with the paper's Table 1 variance; if the variance is not lower than confidence-only variance, the topology-grouping claim collapses. A cheaper check is to permute $M_{\text{simi}}(i)$ across nodes and rerun Simi-Mailbox: if ECE stays the same, topology adds nothing beyond confidence binning.
Extended reading notes
Core claim
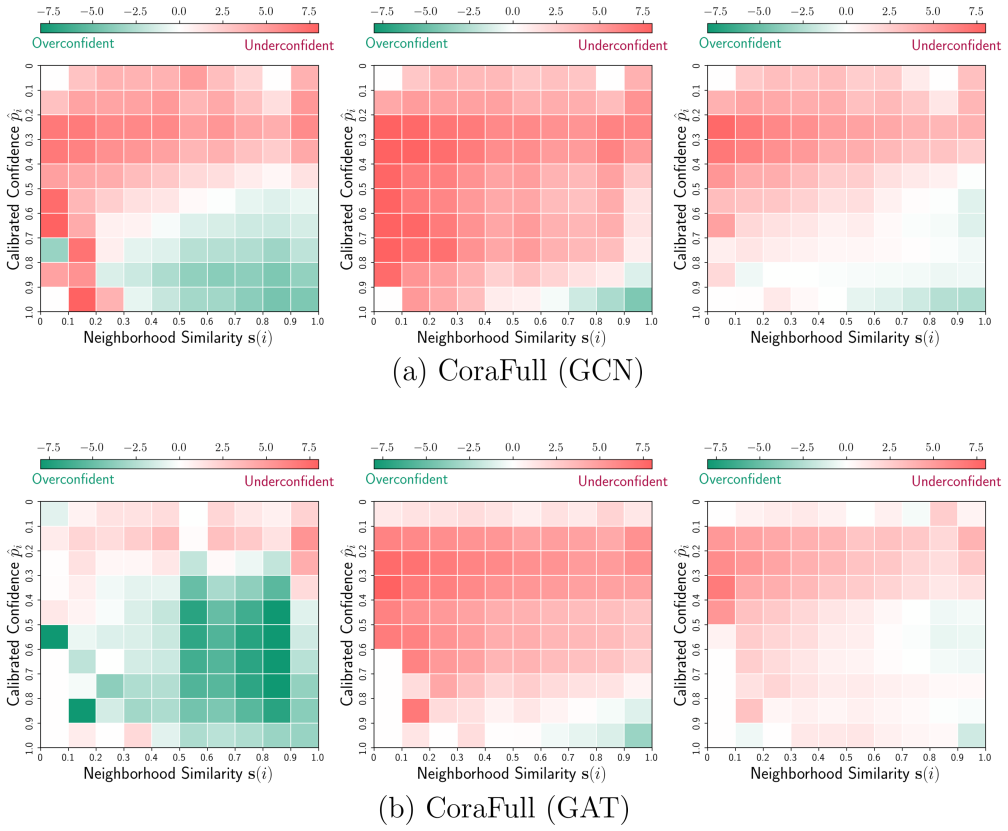
The central claim is that the structure of GNN miscalibration is two-dimensional: nodes with comparable neighborhood prediction similarity $s(i) = |N_i|^{-1}\sum_{j\in N_i}\mathbf{1}[\hat{y}_i = \hat{y}_j]$ can still have opposite calibration errors depending on their confidence $\hat{p}_i$. Accordingly, the paper asserts that the single-factor assumption used by prior neighborhood-similarity calibration methods is not universal, and that grouping nodes by both factors yields clusters with homogeneous calibration error. Simi-Mailbox operationalizes this by clustering the two-dimensional feature $[\text{normalized }\hat{p}_i,\ \text{normalized }M_{\text{simi}}(i)]$ with K-means and assigning each cluster $C_n$ its own temperature $T_n$, trained with a loss that penalizes the gap between each group's average confidence and its validation accuracy. Since group-wise temperature scaling preserves the ordering of logits, accuracy is preserved. The experimental claim is ECE reductions below 3% on Cora and Citeseer and below 1% on several larger and already well-calibrated graphs.
Load-bearing premise
The logit-based Mailbox score is assumed to capture the same miscalibration structure as the label-based neighborhood similarity used in the motivating analysis, but the paper never shows that the two agree cell by cell.
Editorial extensions
If this is right
- On the eight small- and medium-scale graphs, Simi-Mailbox reports the best or second-best ECE in 15 of 16 GCN/GAT settings, including sub-3% ECE on Cora and Citeseer.
- On large-scale graphs, ECE falls below 1% in all reported settings, with Reddit improving from about 8.55% to 0.35% under GCN.
- Because a shared group temperature preserves logit order, post-hoc calibration does not change classification accuracy.
- Self-training with calibrated pseudo-labels raises accuracy in 17 of 18 settings relative to uncalibrated and CaGCN baselines.
- Calibration time is lower than node-wise GNN calibrators because tuning involves only the number of clusters in temperature parameters.
Reading between the lines
- A direct test of the paper's mechanism would be a confidence-only ablation: if clustering on normalized confidence alone matches Simi-Mailbox's ECE, the neighborhood-similarity dimension is not doing the work; the paper does not report that ablation.
- The motivating variance analysis uses label agreement $s(i)$, but the method clusters on the sigmoid logit-dot-product proxy $M_{\text{simi}}(i)$; whether the proxy preserves the same cell structure is untested, so the topology component's contribution remains an open empirical question.
- Because group-specific temperatures are cheaper than node-wise temperatures and preserve accuracy, the same grouping could be applied as a lightweight post-hoc layer for uncertainty-driven tasks such as selective prediction or out-of-distribution detection, though the paper's reported out-of-distribution results are mixed.
Signed reviews
Editorial analysis
A structured set of objections, weighed in public.
Referee Report
Summary. The paper addresses post-hoc calibration of GNN node classifiers. It argues that the common assumption underlying CaGCN and GATS—that nodes with similar neighborhood prediction similarity have similar calibration behavior—does not hold universally, because calibration errors vary with confidence even among nodes of comparable neighborhood similarity. To support this, the paper analyzes calibration errors on CoraFull using label-based neighborhood prediction similarity s(i) (Eq. 3), and proposes SIMI-MAILBOX, which computes logit-based Mailbox similarity Msimi (Eq. 7), clusters nodes via KMeans on normalized confidence and normalized Msimi, and fits one temperature per cluster by minimizing a combination of cross-entropy and a cluster-wise confidence-accuracy loss (Eq. 9). The empirical section compares against TS, VS, ETS, CaGCN, GATS, and recent methods over small, medium, large, and heterophilous graphs, with additional analyses of self-training, OOD detection, runtime, and multiple calibration metrics.
Significance. The paper is practically strong: the method is simple, adds only N temperature parameters, preserves classification accuracy because group-wise temperature scaling is order-preserving, and the empirical evaluation is extensive (10+ datasets, multiple architectures, many metrics, ablations, and a code link). If the grouping premise holds, the method is a useful and efficient post-hoc calibration tool. However, the conceptual contribution stands or falls on whether the logit-based Msimi proxy reproduces the label-based structure used in the motivating analysis; that link is not demonstrated in the current manuscript, and the empirical tables do not include the ablations needed to isolate the topology component.
major comments (3)
- [Proposed Method, Eq. (7); Preliminaries, Eq. (3)] The motivating analysis (Section 'In-depth Analysis on Neighborhood Similarity', Figure 1, and Table 1) is built on label-based neighborhood prediction similarity s(i) = (1/|N_i|) Σ_{j∈N_i} 1[ŷ_i = ŷ_j] (Eq. 3), but the proposed grouping uses logit-based Mailbox similarity Msimi(i) = (1/|N_i|) Σ_{j∈N_i} σ(z_i^T z_j) (Eq. 7). The paper never validates this proxy: it reports no correlation or rank statistic between Msimi and s(i), no analog of Eq. (5) computed for Msimi-based clusters, and no heatmap showing that accuracy-minus-confidence cells are homogeneous when nodes are grouped by Msimi and confidence. Since confidence is the second clustering feature, the ECE gains in Tables 2 and 3 are consistent with a method that performs per-bin temperature scaling on confidence alone; the claimed role of topology is therefore not yet supported.
- [Intuition: Topology Grouping Matters, Eqs. (4)-(6), Table 1] The definition of node-wise calibration error D(i) in Eq. (4) is |Acc(B_m) − p̂_i|, where B_m is the confidence interval, not the joint neighborhood-similarity-confidence cell B_m^{(l)}. Consequently, the variance within B_m^{(l)} in Eq. (5) measures only the spread of confidence values inside each cell, not the cell-specific discrepancy between accuracy and confidence. The decrease from Node-wise to Conf. to Neig. Sim. in Table 1 is the expected consequence of partitioning the confidence range into finer subgroups, so it does not establish that nodes with similar s(i) and confidence share similar calibration errors. Please recompute the variance using acc(B_m^{(l)}) or the cell-wise accuracy-confidence gap.
- [Experiments, Tables 2-3] None of the experimental tables includes a confidence-only grouped-temperature baseline. A direct ablation would apply the same KMeans-plus-group-temperature procedure to (i) normalized confidence alone, (ii) Msimi alone, and (iii) random cluster assignments at the same N, preferably also reporting the within-cluster ECE variance. Without these conditions, the headline ECE reductions over TS, CaGCN, and GATS do not identify which clustering dimension drives the improvement, so the specific benefit of the 'topology-grouping strategy' in the title remains untested.
minor comments (4)
- [Baselines] There is a typo in 'ensemble temperature sclaing' that should read 'ensemble temperature scaling'.
- [Experimental Setup] The sentence 'The optimal calibration models are chosen based on the lowest validation ECE on training set' should read 'on the validation set', since the training set is not used for validation.
- [Proposed Method, Eq. (9)] Please clarify whether C_n in L_simi denotes the set of validation nodes in cluster n or all nodes assigned to cluster n; if it denotes all nodes, the average confidence in Eq. (9) includes test nodes while a_val(n) is a validation-only accuracy, which makes the objective ill-defined.
- [Table 16] The caption says 'A lower AUROC indicates better detection performance', but for the Area Under the ROC Curve higher values indicate better detection; this also conflicts with the text describing GNNSafe's high AUROC values as state-of-the-art.
Circularity Check
Table 1's variance evidence is tautological: D(i) is defined per confidence bin and Neig. Sim. merely refines those bins, so the lower 'Neig. Sim.' variance is forced by variance decomposition, not by topology.
-
self definitional
[Proposed Method, 'Intuition: Topology Grouping Matters,' Eqs. (4)-(5) and Table 1]
"D(i) = |Acc(Bm) − ˆpi|. ... As outlined in Table 1, the variance within Neig. Sim. shows the lowest, particularly when compared to the variance across all nodes (Node-wise). This demonstrates that nodes with comparable neighborhood predictions and confidence levels exhibit similar calibration error."
Within a fixed confidence bin Bm, Acc(Bm) is constant, so D(i)=|Acc(Bm)−p_i| is just a function of p_i; V(Bm) is essentially the variance of confidence inside that bin, so confidence binning mechanically lowers it. The subgroups B(l)m are a refinement of Bm, and for any refinement the average within-subgroup variance is ≤ the parent variance by the identity Var(Y)=E[Var(Y|G)]+Var(E[Y|G]). Hence Table 1's ordering Node-wise > Conf. > Neig. Sim. holds for any partition feature whatsoever, independent of whether neighborhood similarity tracks miscalibration. The claimed observation that similarity+confidence nodes share similar calibration errors is therefore an artifact of the definition of D(i) and of finer partitioning, not an empirical discovery.
full rationale
The temperature parameters are fitted on a validation set and evaluated on held-out test ECE, so there is no target leakage in the headline ECE comparisons. Those comparisons are self-contained against external baselines and are not forced by the circular step identified above. The concrete circularity is confined to the motivating analysis that is supposed to establish 'Topology Grouping Matters': the per-node calibration error D(i) is defined using the accuracy of the node's own confidence bin, and the Neig. Sim. subgroups are refinements of those confidence bins. Consequently the variance ordering in Table 1 follows from the definitions and the variance decomposition identity, not from any empirical association between neighborhood prediction similarity and miscalibration. A separate validity concern, distinct from circularity, is that the method clusters on Msimi (Eq. 7), a sigmoid of logit dot products, while the motivating analysis uses label-based s(i) (Eq. 3); no experiment demonstrates that the Msimi-based clusters reproduce the s(i)-based miscalibration structure. That is an unvalidated proxy issue rather than a reduction-by-construction, so it does not by itself raise the circularity score. Overall, the paper's benchmark results stand as empirical claims, but the paper's central topological-grouping insight is supported by a tautological variance table, warranting a partial-circularity score of 6.
Assumptions & free parameters
free parameters (4)
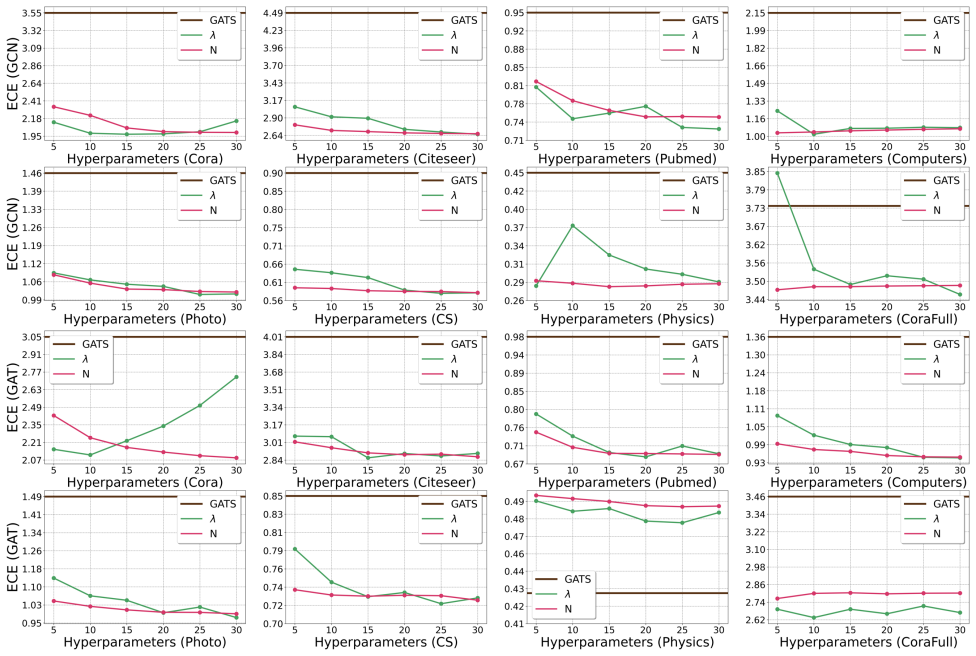
- Number of clusters N =
selected from [5, 30] per dataset by validation ECE
- Regularization coefficient λ =
searched in [1, 50] per dataset
- Group-specific temperatures T_n =
N scalar temperatures learned on the validation set
- Min-max normalization statistics for confidence and Mailbox value =
min and max computed from validation nodes
assumptions (5)
- domain assumption Nodes with comparable neighborhood prediction similarity and confidence exhibit similar calibration errors.
- ad hoc to paper The sigmoid of the average pairwise logit dot product Msimi(i) is a valid proxy for the label-based neighborhood prediction similarity s(i).
- ad hoc to paper KMeans on [normalized confidence, normalized Msimi] produces clusters with homogeneous calibration errors.
- domain assumption Validation accuracy per cluster a_val(n) is a stable estimator of test accuracy for that cluster.
- standard math Scaling all logits of a node by a positive temperature preserves prediction accuracy.
Cite this review
Pith. "Pith review of Towards Precise Prediction Uncertainty in GNNs: Refining GNNs with Topology-grouping Strategy." pith.science (2026). https://pith.science/paper/YLXD2M4R
@misc{pith2026241214223,
  author       = {Pith},
  title        = {Pith review of: Towards Precise Prediction Uncertainty in GNNs: Refining GNNs with Topology-grouping Strategy},
  year         = {2026},
  howpublished = {\url{https://pith.science/paper/YLXD2M4R}},
  note         = {Machine review of arXiv:2412.14223}
}
read the original abstract
Recent advancements in graph neural networks (GNNs) have highlighted the critical need of calibrating model predictions, with neighborhood prediction similarity recognized as a pivotal component. Existing studies suggest that nodes with analogous neighborhood prediction similarity often exhibit similar calibration characteristics. Building on this insight, recent approaches incorporate neighborhood similarity into node-wise temperature scaling techniques. However, our analysis reveals that this assumption does not hold universally. Calibration errors can differ significantly even among nodes with comparable neighborhood similarity, depending on their confidence levels. This necessitates a re-evaluation of existing GNN calibration methods, as a single, unified approach may lead to sub-optimal calibration. In response, we introduce **Simi-Mailbox**, a novel approach that categorizes nodes by both neighborhood similarity and their own confidence, irrespective of proximity or connectivity. Our method allows fine-grained calibration by employing *group-specific* temperature scaling, with each temperature tailored to address the specific miscalibration level of affiliated nodes, rather than adhering to a uniform trend based on neighborhood similarity. Extensive experiments demonstrate the effectiveness of our **Simi-Mailbox** across diverse datasets on different GNN architectures, achieving up to 13.79\% error reduction compared to uncalibrated GNN predictions.
Figures


Figures from the paper (9 more)




Reference graph
Works this paper leans on
-
[1]
, " * write output.state after.block = add.period write newline
ENTRY address archivePrefix author booktitle chapter edition editor eid eprint howpublished institution isbn journal key month note number organization pages publisher school series title type volume year label extra.label sort.label short.list INTEGERS output.state before.all mid.sentence after.sentence after.block FUNCTION init.state.consts #0 'before.a...
-
[2]
write newline
" write newline "" before.all 'output.state := FUNCTION n.dashify 't := "" t empty not t #1 #1 substring "-" = t #1 #2 substring "--" = not "--" * t #2 global.max substring 't := t #1 #1 substring "-" = "-" * t #2 global.max substring 't := while if t #1 #1 substring * t #2 global.max substring 't := if while FUNCTION word.in bbl.in capitalize " " * FUNCT...
-
[3]
Ahn, S. J.; and Kim, M. 2021. Variational graph normalized autoencoders. In Proceedings of the 30th ACM international conference on information & knowledge management, 2827--2831
work page 2021
-
[4]
Angelopoulos, A.; Bates, S.; Malik, J.; and Jordan, M. I. 2020. Uncertainty sets for image classifiers using conformal prediction. arXiv preprint arXiv:2009.14193
arXiv 2020
-
[5]
Bober, J.; Monod, A.; Saucan, E.; and Webster, K. N. 2023. Rewiring networks for graph neural network training using discrete geometry. In International Conference on Complex Networks and Their Applications, 225--236. Springer
work page 2023
-
[6]
Bojchevski, A.; and G \"u nnemann, S. 2017. Deep gaussian embedding of graphs: Unsupervised inductive learning via ranking. arXiv preprint arXiv:1707.03815
arXiv 2017
- [7]
-
[8]
Cauchois, M.; Gupta, S.; and Duchi, J. C. 2021. Knowing what you know: valid and validated confidence sets in multiclass and multilabel prediction. Journal of machine learning research, 22(81): 1--42
work page 2021
Show all 78 references
-
[9]
Chen, Z.; Mao, H.; Li, H.; Jin, W.; Wen, H.; Wei, X.; Wang, S.; Yin, D.; Fan, W.; Liu, H.; et al. 2024. Exploring the potential of large language models (llms) in learning on graphs. ACM SIGKDD Explorations Newsletter, 25(2): 42--61
2024
-
[10]
de Haan, P. 1999. On the use of density kernels for concentration estimations within particle and puff dispersion models. Atmospheric Environment, 33(13): 2007--2021
1999
-
[11]
Depeweg, S.; Hernandez-Lobato, J.-M.; Doshi-Velez, F.; and Udluft, S. 2018. Decomposition of uncertainty in Bayesian deep learning for efficient and risk-sensitive learning. In International conference on machine learning, 1184--1193. PMLR
2018
-
[12]
Dusenberry, M.; Jerfel, G.; Wen, Y.; Ma, Y.; Snoek, J.; Heller, K.; Lakshminarayanan, B.; and Tran, D. 2020. Efficient and scalable bayesian neural nets with rank-1 factors. In International conference on machine learning, 2782--2792. PMLR
2020
-
[13]
V.; and Tiao, L
Elinas, P.; Bonilla, E. V.; and Tiao, L. 2020. Variational inference for graph convolutional networks in the absence of graph data and adversarial settings. Advances in neural information processing systems, 33: 18648--18660
2020
-
[14]
Fey, M.; and Lenssen, J. E. 2019. Fast graph representation learning with PyTorch Geometric. arXiv preprint arXiv:1903.02428
2019 arXiv
-
[15]
Gal, Y.; and Ghahramani, Z. 2016. Dropout as a bayesian approximation: Representing model uncertainty in deep learning. In international conference on machine learning, 1050--1059. PMLR
2016
-
[16]
Guo, C.; Pleiss, G.; Sun, Y.; and Weinberger, K. Q. 2017. On calibration of modern neural networks. In International conference on machine learning, 1321--1330. PMLR
2017
-
[17]
Hamilton, W.; Ying, Z.; and Leskovec, J. 2017. Inductive representation learning on large graphs. Advances in neural information processing systems, 30
2017
-
[18]
Hasanzadeh, A.; Hajiramezanali, E.; Boluki, S.; Zhou, M.; Duffield, N.; Narayanan, K.; and Qian, X. 2020. Bayesian graph neural networks with adaptive connection sampling. In International conference on machine learning, 4094--4104. PMLR
2020
-
[19]
H \'e bert-Johnson, U.; Kim, M.; Reingold, O.; and Rothblum, G. 2018. Multicalibration: Calibration for the (computationally-identifiable) masses. In International Conference on Machine Learning, 1939--1948. PMLR
2018
-
[20]
Hou, Z.; Liu, X.; Dong, Y.; Wang, C.; Tang, J.; et al. 2022. Graphmae: Self-supervised masked graph autoencoders. arXiv preprint arXiv:2205.10803
2022 arXiv
-
[21]
H.-H.; Shen, Y.; and Cremers, D
Hsu, H. H.-H.; Shen, Y.; and Cremers, D. 2022. A Graph Is More Than Its Nodes: Towards Structured Uncertainty-Aware Learning on Graphs. In NeurIPS 2022 Workshop: New Frontiers in Graph Learning
2022
-
[22]
H.-H.; Shen, Y.; Tomani, C.; and Cremers, D
Hsu, H. H.-H.; Shen, Y.; Tomani, C.; and Cremers, D. 2022. What Makes Graph Neural Networks Miscalibrated? Advances in Neural Information Processing Systems, 35: 13775--13786
2022
-
[23]
Hu, W.; Fey, M.; Zitnik, M.; Dong, Y.; Ren, H.; Liu, B.; Catasta, M.; and Leskovec, J. 2020. Open graph benchmark: Datasets for machine learning on graphs. Advances in neural information processing systems, 33: 22118--22133
2020
-
[24]
Huang, K.; Jin, Y.; Candes, E.; and Leskovec, J. 2024. Uncertainty quantification over graph with conformalized graph neural networks. Advances in Neural Information Processing Systems, 36
2024
-
[25]
Jiang, Z.; Araki, J.; Ding, H.; and Neubig, G. 2021. How can we know when language models know? on the calibration of language models for question answering. Transactions of the Association for Computational Linguistics, 9: 962--977
2021
-
[26]
Jung, S.; Seo, S.; Jeong, Y.; and Choi, J. 2023. Scaling of class-wise training losses for post-hoc calibration. In International Conference on Machine Learning, 15421--15434. PMLR
2023
-
[27]
N.; and Welling, M
Kipf, T. N.; and Welling, M. 2016. Semi-supervised classification with graph convolutional networks. arXiv preprint arXiv:1609.02907
2016 arXiv
-
[28]
Kull, M.; Perello Nieto, M.; K \"a ngsepp, M.; Silva Filho, T.; Song, H.; and Flach, P. 2019. Beyond temperature scaling: Obtaining well-calibrated multi-class probabilities with dirichlet calibration. Advances in neural information processing systems, 32
2019
-
[29]
Lakshminarayanan, B.; Pritzel, A.; and Blundell, C. 2017. Simple and scalable predictive uncertainty estimation using deep ensembles. Advances in neural information processing systems, 30
2017
-
[30]
B.; Rossi, R.; and Kong, X
Lee, J. B.; Rossi, R.; and Kong, X. 2018. Graph classification using structural attention. In Proceedings of the 24th ACM SIGKDD International Conference on Knowledge Discovery & Data Mining, 1666--1674
2018
-
[31]
Liu, T.; Liu, Y.; Hildebrandt, M.; Joblin, M.; Li, H.; and Tresp, V. 2022. On Calibration of Graph Neural Networks for Node Classification. In 2022 International Joint Conference on Neural Networks (IJCNN), 1--8. IEEE
2022
-
[32]
Luan, S.; Hua, C.; Lu, Q.; Zhu, J.; Zhao, M.; Zhang, S.; Chang, X.-W.; and Precup, D. 2022. Revisiting heterophily for graph neural networks. Advances in neural information processing systems, 35: 1362--1375
2022
-
[33]
Ma, X.; and Blaschko, M. B. 2021. Meta-cal: Well-controlled post-hoc calibration by ranking. In International Conference on Machine Learning, 7235--7245. PMLR
2021
-
[34]
Ma, Y.; Liu, X.; Shah, N.; and Tang, J. 2021. Is homophily a necessity for graph neural networks? arXiv preprint arXiv:2106.06134
2021 arXiv
-
[35]
J.; Izmailov, P.; Garipov, T.; Vetrov, D
Maddox, W. J.; Izmailov, P.; Garipov, T.; Vetrov, D. P.; and Wilson, A. G. 2019. A simple baseline for bayesian uncertainty in deep learning. Advances in neural information processing systems, 32
2019
-
[36]
Mao, H.; Chen, Z.; Jin, W.; Han, H.; Ma, Y.; Zhao, T.; Shah, N.; and Tang, J. 2024. Demystifying Structural Disparity in Graph Neural Networks: Can One Size Fit All? Advances in Neural Information Processing Systems, 36
2024
-
[37]
Minderer, M.; Djolonga, J.; Romijnders, R.; Hubis, F.; Zhai, X.; Houlsby, N.; Tran, D.; and Lucic, M. 2021. Revisiting the calibration of modern neural networks. Advances in Neural Information Processing Systems, 34: 15682--15694
2021
-
[38]
Mukhoti, J.; Kulharia, V.; Sanyal, A.; Golodetz, S.; Torr, P.; and Dokania, P. 2020. Calibrating deep neural networks using focal loss. Advances in Neural Information Processing Systems, 33: 15288--15299
2020
-
[39]
P.; Cooper, G.; and Hauskrecht, M
Naeini, M. P.; Cooper, G.; and Hauskrecht, M. 2015. Obtaining well calibrated probabilities using bayesian binning. In Proceedings of the AAAI conference on artificial intelligence, volume 29
2015
-
[40]
M.; Nguyen, V
Nguyen, K.; Hieu, N. M.; Nguyen, V. D.; Ho, N.; Osher, S.; and Nguyen, T. M. 2023. Revisiting over-smoothing and over-squashing using ollivier-ricci curvature. In International Conference on Machine Learning, 25956--25979. PMLR
2023
-
[41]
W.; Zhang, L.; Jerfel, G.; and Tran, D
Nixon, J.; Dusenberry, M. W.; Zhang, L.; Jerfel, G.; and Tran, D. 2019. Measuring Calibration in Deep Learning. In CVPR workshops, volume 2
2019
-
[42]
Pal, S.; Regol, F.; and Coates, M. 2019. Bayesian graph convolutional neural networks using non-parametric graph learning. arXiv preprint arXiv:1910.12132
2019 arXiv
-
[43]
Park, J.; Song, J.; and Yang, E. 2021. Graphens: Neighbor-aware ego network synthesis for class-imbalanced node classification. In International Conference on Learning Representations
2021
-
[44]
Paszke, A.; Gross, S.; Massa, F.; Lerer, A.; Bradbury, J.; Chanan, G.; Killeen, T.; Lin, Z.; Gimelshein, N.; Antiga, L.; Desmaison, A.; Kopf, A.; Yang, E.; DeVito, Z.; Raison, M.; Tejani, A.; Chilamkurthy, S.; Steiner, B.; Fang, L.; Bai, J.; and Chintala, S. 2019. PyTorch: An ...
2019
-
[45]
C.-C.; Lei, Y.; and Yang, B
Pei, H.; Wei, B.; Chang, K. C.-C.; Lei, Y.; and Yang, B. 2020. Geom-gcn: Geometric graph convolutional networks. arXiv preprint arXiv:2002.05287
2020 arXiv
-
[46]
L.; and Varoquaux, G
Perez-Lebel, A.; Morvan, M. L.; and Varoquaux, G. 2022. Beyond calibration: estimating the grouping loss of modern neural networks. arXiv preprint arXiv:2210.16315
2022 arXiv
-
[47]
Platt, J.; et al. 1999. Probabilistic outputs for support vector machines and comparisons to regularized likelihood methods. Advances in large margin classifiers, 10(3): 61--74
1999
-
[48]
N.; Duarte, K.; Rawat, Y
Rizve, M. N.; Duarte, K.; Rawat, Y. S.; and Shah, M. 2021. In defense of pseudo-labeling: An uncertainty-aware pseudo-label selection framework for semi-supervised learning. arXiv preprint arXiv:2101.06329
2021 arXiv
-
[49]
Romano, Y.; Sesia, M.; and Candes, E. 2020. Classification with valid and adaptive coverage. Advances in Neural Information Processing Systems, 33: 3581--3591
2020
-
[50]
Rong, Y.; Huang, W.; Xu, T.; and Huang, J. 2019. Dropedge: Towards deep graph convolutional networks on node classification. arXiv preprint arXiv:1907.10903
2019 arXiv
-
[51]
Scott, D. W. 2015. Multivariate density estimation: theory, practice, and visualization. John Wiley & Sons
2015
-
[52]
Sen, P.; Namata, G.; Bilgic, M.; Getoor, L.; Galligher, B.; and Eliassi-Rad, T. 2008. Collective classification in network data. AI magazine, 29(3): 93--93
2008
-
[53]
Shchur, O.; Mumme, M.; Bojchevski, A.; and G \"u nnemann, S. 2018. Pitfalls of graph neural network evaluation. arXiv preprint arXiv:1811.05868
2018 arXiv
-
[54]
Shi, S.; Chen, J.; Qiao, K.; Yang, S.; Wang, L.; and Yan, B. 2022. Select and Calibrate the Low-confidence: Dual-Channel Consistency based Graph Convolutional Networks. arXiv preprint arXiv:2205.03753
2022 arXiv
-
[55]
u gner, D.; and G \
Stadler, M.; Charpentier, B.; Geisler, S.; Z \"u gner, D.; and G \"u nnemann, S. 2021. Graph posterior network: Bayesian predictive uncertainty for node classification. Advances in Neural Information Processing Systems, 34: 18033--18048
2021
-
[56]
Sui, Y.; Wang, X.; Wu, J.; Lin, M.; He, X.; and Chua, T.-S. 2022. Causal attention for interpretable and generalizable graph classification. In Proceedings of the 28th ACM SIGKDD Conference on Knowledge Discovery and Data Mining, 1696--1705
2022
-
[57]
Tang, B.; Wu, Z.; Wu, X.; Huang, Q.; Chen, J.; Lei, S.; and Meng, H. 2024. SimCalib: Graph Neural Network Calibration Based on Similarity between Nodes. In Proceedings of the AAAI Conference on Artificial Intelligence, volume 38, 15267--15275
2024
-
[58]
Tang, X.; Yao, H.; Sun, Y.; Wang, Y.; Tang, J.; Aggarwal, C.; Mitra, P.; and Wang, S. 2020. Investigating and mitigating degree-related biases in graph convoltuional networks. In Proceedings of the 29th ACM International Conference on Information & Knowledge Management, 1435--1444
2020
-
[59]
P.; Dong, X.; and Bronstein, M
Topping, J.; Di Giovanni, F.; Chamberlain, B. P.; Dong, X.; and Bronstein, M. M. 2021. Understanding over-squashing and bottlenecks on graphs via curvature. arXiv preprint arXiv:2111.14522
2021 arXiv
-
[60]
Veli c kovi \'c , P.; Cucurull, G.; Casanova, A.; Romero, A.; Lio, P.; and Bengio, Y. 2017. Graph attention networks. arXiv preprint arXiv:1710.10903
2017 arXiv
-
[61]
Vovk, V.; Gammerman, A.; and Shafer, G. 2005. Algorithmic learning in a random world, volume 29. Springer
2005
-
[62]
Wang, M.; Yang, H.; and Cheng, Q. 2022. GCL: Graph Calibration Loss for Trustworthy Graph Neural Network. In Proceedings of the 30th ACM International Conference on Multimedia, 988--996
2022
-
[63]
Wang, X.; Liu, H.; Shi, C.; and Yang, C. 2021. Be confident! towards trustworthy graph neural networks via confidence calibration. Advances in Neural Information Processing Systems, 34: 23768--23779
2021
-
[64]
Wen, Y.; Tran, D.; and Ba, J. 2020. Batchensemble: an alternative approach to efficient ensemble and lifelong learning. arXiv preprint arXiv:2002.06715
2020 arXiv
-
[65]
Wu, Q.; Chen, Y.; Yang, C.; and Yan, J. 2023. Energy-based out-of-distribution detection for graph neural networks. arXiv preprint arXiv:2302.02914
2023 arXiv
-
[66]
Xing, C.; Arik, S.; Zhang, Z.; and Pfister, T. 2019. Distance-based learning from errors for confidence calibration. arXiv preprint arXiv:1912.01730
2019 arXiv
-
[67]
Xu, K.; Hu, W.; Leskovec, J.; and Jegelka, S. 2018 a . How powerful are graph neural networks? arXiv preprint arXiv:1810.00826
2018 arXiv
-
[68]
Xu, K.; Li, C.; Tian, Y.; Sonobe, T.; Kawarabayashi, K.-i.; and Jegelka, S. 2018 b . Representation learning on graphs with jumping knowledge networks. In International conference on machine learning, 5453--5462. PMLR
2018
-
[69]
Yang, C.; Yang, C.; Shi, C.; Li, Y.; Zhang, Z.; and Zhou, J. 2024. Calibrating Graph Neural Networks from a Data-centric Perspective. In Proceedings of the ACM on Web Conference 2024, 745--755
2024
-
[70]
Yang, J.-Q.; Zhan, D.-C.; and Gan, L. 2023. Beyond Probability Partitions: Calibrating Neural Networks with Semantic Aware Grouping. arXiv preprint arXiv:2306.04985
2023 arXiv
-
[71]
Yun, S.; Kim, S.; Lee, J.; Kang, J.; and Kim, H. J. 2021. Neo-gnns: Neighborhood overlap-aware graph neural networks for link prediction. Advances in Neural Information Processing Systems, 34: 13683--13694
2021
-
[72]
H.; Antonelli, S.; and Bojchevski, A
Zargarbashi, S. H.; Antonelli, S.; and Bojchevski, A. 2023. Conformal prediction sets for graph neural networks. In International Conference on Machine Learning, 12292--12318. PMLR
2023
-
[73]
Zeng, H.; Zhou, H.; Srivastava, A.; Kannan, R.; and Prasanna, V. 2019. Graphsaint: Graph sampling based inductive learning method. arXiv preprint arXiv:1907.04931
2019 arXiv
-
[74]
Zhang, J.; Kailkhura, B.; and Han, T. Y.-J. 2020. Mix-n-match: Ensemble and compositional methods for uncertainty calibration in deep learning. In International conference on machine learning, 11117--11128. PMLR
2020
-
[75]
Zhang, M.; and Chen, Y. 2018. Link prediction based on graph neural networks. Advances in neural information processing systems, 31
2018
-
[76]
Zhao, X.; Chen, F.; Hu, S.; and Cho, J.-H. 2020. Uncertainty aware semi-supervised learning on graph data. Advances in Neural Information Processing Systems, 33: 12827--12836
2020
-
[77]
Zhu, Z.; Zhang, Z.; Xhonneux, L.-P.; and Tang, J. 2021. Neural bellman-ford networks: A general graph neural network framework for link prediction. Advances in Neural Information Processing Systems, 34: 29476--29490
2021
-
[78]
Zhuang, D.; Jiang, C.; Zheng, Y.; Wang, S.; and Zhao, J. 2024. GETS: Ensemble Temperature Scaling for Calibration in Graph Neural Networks. arXiv preprint arXiv:2410.09570
2024 arXiv
Reviewed August 11, 2026 · model on record in the stance chip above.
Discussion (0). Continue with ORCID to comment.