REVIEW 3 major objections 5 minor 62 references
CO and mid-infrared emission follow two distinct scaling families at 100-pc scales, set by the host galaxy's star-formation rate.
Reviewed by Pith at T0; open to challenge. T0 means a machine referee read the full paper against a public rubric. the ladder, T0–T4 →
T0 review · deepseek-v4-flash
2026-08-04 06:46 UTC pith:YMF5UWOA
load-bearing objection Solid statistical study that credibly revises the CO–F2100W slope, but the headline 'clear bimodality' of the intercept is visually suggested, not formally demonstrated. the 3 major comments →
Correlations of ALMA CO(2-1) with JWST mid-infrared fluxes down to scale of lesssim100 parsec in nearby star-forming galaxies from PHANGS
The pith
A machine-rendered reading of the paper's core claim, the machinery that carries it, and where it could break.
Core claim
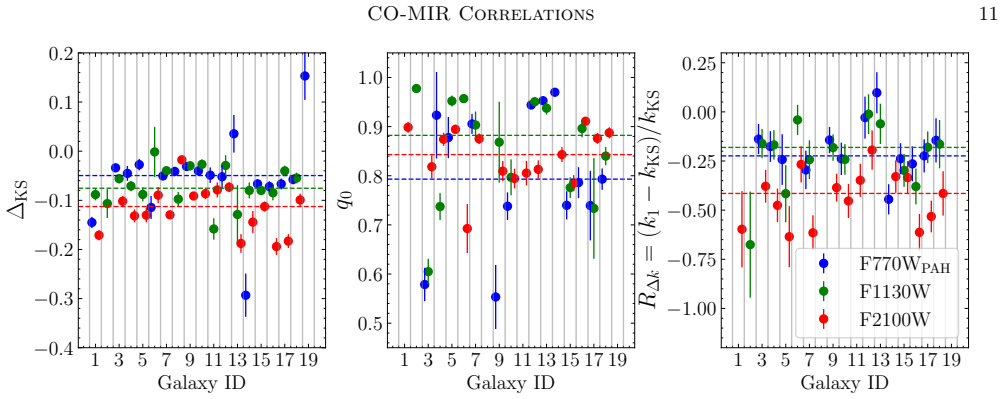
Applying a regression technique that explicitly handles heteroscedastic uncertainties and outliers (raddest) to 19 nearby star-forming galaxies, the paper finds that log I_CO versus log I_MIR (F770W, F1130W, F2100W) is well described by a single straight line for the majority of spaxels at ≤100 pc scales, with slopes consistently superlinear and similar across bands. The dominant galaxy-to-galaxy variation is in the intercept b, which shows a clear bimodal distribution; the two groups (high-b and low-b) have similar slopes but different overall CO-to-MIR ratios and different intrinsic scatter. The bimodality is tied to the normalized star-formation rate of the host galaxy: galaxies with high
What carries the argument
The central object is the log-log linear scaling relation log I_CO = k log I_X + b + ε, with ε Gaussian intrinsic scatter, fitted by raddest, a regression method that builds a generative model of the observed fluxes and uncertainties using normalizing flows and then estimates k, b, σ through likelihood or a KS-test-based goodness-of-fit. The intercept b carries the paper's main result: its bimodality, not the slope, encodes the physical state separating the two galaxy families.
Load-bearing premise
The fitted parameters—and thus the claimed bimodality—assume that the raddest regression likelihood (including its normalizing-flow model of the true flux distributions and its treatment of uncertainties) is unbiased; for ~10% of datasets the uncertainties had to be rescaled by hand to pass a 2D KS test, and if that heuristic is wrong, the intercept split could be an artifact.
What would settle it
Take the same 19 galaxies and re-fit with a regression that does not rely on the KS-test-based likelihood or on rescaled errors (e.g., a fully Bayesian model with explicit outlier component), and check whether the bimodality in b survives at >3σ; or apply the same raddest pipeline to an independent set of 19 star-forming galaxies and ask whether the b values fall into the same two clusters with the same sSFR separation.
If this is right
- If the intercept bimodality is real, CO-to-dust and CO-to-PAH conversion factors at ~100 pc are not single-valued; using one calibration for all star-forming galaxies would bias molecular gas masses by the factor corresponding to the intercept offset.
- The previously published sublinear CO–F2100W slope is attributed to the fitting method rather than to astrophysics; re-analysis of those data with uncertainty-aware regression should recover the same slopes as the PAH bands.
- Because the bimodality disappears at spatial scales above ~100 pc, measurements at kpc scales will miss the dichotomy—this predicts that resolved studies at hundreds of pc are necessary to see it.
- The flattening of the relation in bright regions is systematic and stronger for the dust band, which suggests that PAH and dust emission are enhanced relative to CO in the most intense radiation environments.
Where Pith is reading between the lines
- The two-family split might reflect a threshold in the diffuse UV background intensity that enhances PAH/dust emissivity without destroying the carriers; if so, the boundary between low-b and high-b groups should correlate with a measurable jump in PAH-to-dust ratio or dust temperature, which the paper does not test directly.
- A direct extension would be to apply the same fitting technique to the full set of galaxies in the same survey; the bimodality should persist and the group separation should sharpen with better statistics.
- The method's reliance on normalizing flows for the intrinsic distribution of the independent variable could be probed by rerunning the analysis with a simpler parametric model; if the bimodality remains, the result is not an artifact of the density estimator.
Editorial analysis
A structured set of objections, weighed in public.
Referee Report
Summary. The paper applies the raddest regression method (Jing & Li 2025) to PSF-matched PHANGS-ALMA CO(2-1) and PHANGS-JWST MIR maps of 19 star-forming galaxies, fitting log-log-linear relations between I_CO and I_F770W,PAH, I_F1130W, and I_F2100W at ≈100 pc scales, separately for HII-, composite-, and AGN-like ionization conditions. The authors report that the fitted slope and intrinsic scatter vary modestly across galaxies, while the intercept b_KS varies strongly and appears bimodal (high-b versus low-b, split at b_KS=0). This bimodality is argued to be related to the host galaxy's overall star formation strength (sSFR/SFE). The paper also quantifies deviations from log-linearity in the brightest regions, mainly as slope flattening, and studies how k_KS, b_KS, σ_KS depend on spatial scale. The manuscript provides extensive parameter tables and a public implementation of the fitting code.
Significance. If the central claims hold, the paper would establish that the CO-to-PAH/dust conversion at ~100 pc is not single-valued: the slope is approximately universal, but the normalization is bimodally tied to host-galaxy sSFR, and previously reported sublinear F2100W slopes are a regression artifact. This would be an important result for interpreting cloud-scale CO/MIR tracers. The paper's strengths include the use of a regression method with external mock-data validation, public code, detailed comparison with previous PHANGS work (Leroy et al. 2023b; Chown et al. 2025), and a large set of fitted parameters per galaxy and ionization condition. However, the headline bimodality claim currently rests on visual inspection of 19 b_KS values with an arbitrary split at b_KS=0 and no formal multimodality test; this is a load-bearing issue that needs to be resolved before the central claim can be accepted.
major comments (3)
- [§3.2, Figure 4] The claim of a 'clear bimodality' in b_KS is not supported by any quantitative test. The high-b/low-b classification is made by a visual split at b_KS=0 in the F770W,PAH 'all' panel, and with only 19 galaxies the apparent gap can be a sampling fluctuation of a continuous distribution. No Hartigan dip test, Gaussian mixture comparison, or other multimodality test is presented. Because the abstract and §4.2.2 build the central interpretation on this bimodality, please add a formal test and report its significance, and show the sensitivity of the classification to the threshold choice. The authors' own admission in §4.2.2 that it is 'rather difficult to explain why it is a b_KS bimodality rather than a continuum' strengthens the need for such a test.
- [§3.2.1, Figure 6 and Figure 7] The connection between b_KS and sSFR is presented as supporting the bimodality interpretation, but the reported correlations are only at the 2σ level, and no 3σ correlations are found between any global property and k_KS, b_KS, or σ_KS. Moreover, because the high-b/low-b split is defined directly from b_KS, the statement that the b_KS–sSFR correlation 'primarily arises from the bimodality' is close to a restatement of the chosen split. Please report the b_KS–sSFR correlation on the full sample without subgrouping, and quantify whether a continuous correlation model is actually disfavored relative to the two-group model.
- [§2.3] The heuristic rescaling of x_err or y_err for ~10% of normalizing-flow cases is a potential source of bias in the fitted parameters, including b_KS. The authors state that 'all key results' remain consistent when restricting to non-problematic data or including all data without correction, but no such comparison is shown. Since the bimodality claim depends on the exact b_KS values, please provide the requested robustness test (e.g., a comparison of k_KS, b_KS, σ_KS with and without rescaling) or a mock-based validation of the rescaling procedure itself.
minor comments (5)
- [Abstract and §2.2] The abstract and §1 use 'log-log linear relations', while §2.2 and Equation (1) describe a 'log-linear' relation. Please make the terminology consistent (the model is linear in log I_CO vs. log I_X).
- [Table 1] The last column 'high-b' contains 'Yes'/'No' but no definition or pointer to Figure 4. Please add a note explaining the criterion and that it is based on F770W,PAH, all ionization conditions.
- [Figure 2 caption] The caption says 'the contour showcase the distribution' and 'the bold line is corresponding best-fit result.' These should be 'contours show' and 'the bold line is the corresponding best-fit result.' Also check for missing articles elsewhere in the text.
- [§4.2.2] There are several typos in this subsection: 'radiation filed' should be 'radiation field', 'cloud coexist' should be 'could coexist', and 'Hiiregions' should be 'HII regions'. Similar spacing issues occur for 'low-b' and 'high-b' in several places.
- [§3.4 and Figure 11] The text refers to 'low-band high-b galaxies' and 'low-b and high-b galaxies' in a way that is easy to confuse with the MIR bands. Consider using 'low-b/high-b subsamples' throughout and reserving 'band' for F770W,PAH, F1130W, and F2100W.
Circularity Check
No circular derivation; main results are empirical fits and comparisons, with self-cited raddest backed by independent mock validation.
full rationale
The paper's derivation chain is not circular. Equation (1) is a standard log-linear model whose parameters (k, b, sigma) are estimated from the data; claims that the relation 'can be well described' are fit-quality statements, not predictions forced from inputs. The b_KS bimodality and its relation to sSFR are empirical properties of the fitted intercepts plotted against external galaxy properties; the split at b=0 is a classification choice, and the lack of a formal multimodality test is a statistical robustness concern, not a circular reduction. The main self-citation is to JL25 for raddest and for the claim that mODR biases slopes. This is not circular: raddest is publicly available and JL25 validates it on mock datasets with known true parameters and on external PHANGS data, satisfying the independent-support criterion; the current paper also compares mLINMIX on its own sample to show the expected bias. The uncertainty-rescaling heuristic in Section 2.3 is a data-quality correction whose effect the authors explicitly test by checking that results are consistent without it; it is an assumption about noise, not an input that defines the output. No equation in the paper is equivalent by construction to a claimed prediction, and no load-bearing argument reduces to an unverified self-citation.
Axiom & Free-Parameter Ledger
free parameters (4)
- k_KS, b_KS, sigma_KS =
Per galaxy, band, and ionization condition; values in Table 2
- Turning point x_0, high-branch slope k_1, intercept b_1 =
Fitted via ML method for piecewise cases; not tabulated in full
- high-b/low-b split threshold =
b_KS = 0
- Uncertainty rescaling factors for x_err/y_err =
Not reported
axioms (6)
- domain assumption F770W stellar continuum contamination is 12% of F200W (I_F770W,PAH = I_F770W - 0.12 I_F200W)
- domain assumption The P1-P2 diagnostic of Ji & Yan 2020 correctly classifies spaxels as HII-like, composite-like, or AGN-like
- domain assumption The log-linear model with Gaussian intrinsic scatter (Equation 1) applies to the majority of pixels
- ad hoc to paper Heuristic rescaling of overestimated uncertainties does not bias the fitted parameters
- domain assumption Noise and error propagation from R. Klein 2021 are correct after PSF matching
- domain assumption The 19 main-sequence galaxies are representative enough to infer bimodality and global-property correlations
read the original abstract
We investigate the correlations of CO (2-1) emission (${I_{\rm CO}}$) with PAH (${I_{\rm F770W, PAH}}$ and ${I_{\rm F1130W}}$) and dust (${I_{\rm F2100W}}$) emission down to scales of $\lesssim$ 100 pc, by applying ${\tt raddest}$, a novel regression technique recently developed by T. Jing & C. Li (2025) that effectively handles uncertainties and outliers in datasets, to 19 nearby star-forming galaxies in the PHANGS sample. We find that for the majority of the data points in all galaxies, the scaling of ${I_{\rm CO}}$ with ${I_{\rm F770W, PAH}}$, ${I_{\rm F1130W}}$, and ${I_{\rm F2100W}}$ can be well described by log-log linear relations, though with substantial dependence on ionization conditions (i.e., HII-like, composite-like, and AGN-like). Under given ionization conditions, significant galaxy-to-galaxy variations are identified, and are primarily attributed to variations of intercept $b$, which exhibits clear bimodality. This bimodality is related to the normalized overall host galaxy star formation rate, such as specific star formation and star formation efficiency. The differences in slope $k$ and intrinsic scatter $\sigma$ across different MIR bands (${I_{\rm F770W, PAH}}$, ${I_{\rm F1130W}}$, and ${I_{\rm F2100W}}$) are minor compared to their galaxy-to-galaxy variations. All parameters ($k$, $b$, and $\sigma$) depend on the spatial scale of measurement, suggesting that the coupling among CO, PAH, and dust is regulated by different mechanisms at varying scales. We identify deviations from the log-log linear relation in the brightest regions, primarily characterized by a flattening of the slope. No significant (3$\sigma$) correlations are found between global properties and the best-fit parameters. We discuss the comparison to previous studies and plausible physics behind the statistical results obtained in this work.
Figures




Reference graph
Works this paper leans on
-
[1]
Astropy Collaboration, Robitaille, T. P., Tollerud, E. J., et al. 2013, A&A, 558, A33, doi: 10.1051/0004-6361/201322068 Astropy Collaboration, Price-Whelan, A. M., Sip˝ ocz, B. M., et al. 2018, AJ, 156, 123, doi: 10.3847/1538-3881/aabc4f Astropy Collaboration, Price-Whelan, A. M., Lim, P. L., et al. 2022, apj, 935, 167, doi: 10.3847/1538-4357/ac7c74
-
[2]
Battisti, A., Shivaei, I., Park, H. J., et al. 2025, PASA, 42, e022, doi: 10.1017/pasa.2024.129
-
[3]
Blanton, M. R., Bershady, M. A., Abolfathi, B., et al. 2017, AJ, 154, 28, doi: 10.3847/1538-3881/aa7567
-
[4]
Bundy, K., Bershady, M. A., Law, D. R., et al. 2015, ApJ, 798, 7, doi: 10.1088/0004-637X/798/1/7
-
[5]
2021, MNRAS, 500, 1261, doi: 10.1093/mnras/staa3288
Chown, R., Li, C., Parker, L., et al. 2021, MNRAS, 500, 1261, doi: 10.1093/mnras/staa3288
-
[6]
Chown, R., Leroy, A. K., Sandstrom, K., et al. 2025, ApJ, 983, 64, doi: 10.3847/1538-4357/adbd40
-
[7]
2019, MNRAS, 482, 1618, doi: 10.1093/mnras/sty2777
Cortzen, I., Garrett, J., Magdis, G., et al. 2019, MNRAS, 482, 1618, doi: 10.1093/mnras/sty2777
-
[8]
Crawford, M. K., Tielens, A. G. G. M., & Allamandola, L. J. 1985, ApJL, 293, L45, doi: 10.1086/184488
-
[9]
2019, MNRAS, 486, 743, doi: 10.1093/mnras/stz805
Decleir, M., De Looze, I., Boquien, M., et al. 2019, MNRAS, 486, 743, doi: 10.1093/mnras/stz805
-
[10]
2014, arXiv e-prints, arXiv:1410.8516, doi: 10.48550/arXiv.1410.8516
Dinh, L., Krueger, D., & Bengio, Y. 2014, arXiv e-prints, arXiv:1410.8516, doi: 10.48550/arXiv.1410.8516
-
[11]
Draine, B. T., Li, A., Hensley, B. S., et al. 2021, ApJ, 917, 3, doi: 10.3847/1538-4357/abff51
-
[12]
2022, A&A, 659, A191, doi: 10.1051/0004-6361/202141727
Emsellem, E., Schinnerer, E., Santoro, F., et al. 2022, A&A, 659, A191, doi: 10.1051/0004-6361/202141727
-
[13]
1987, MNRAS, 225, 155, doi: 10.1093/mnras/225.1.155
Fasano, G., & Franceschini, A. 1987, MNRAS, 225, 155, doi: 10.1093/mnras/225.1.155
-
[14]
JWST NIRCam Imaging of NGC 4258: I. Observation Overview
Fischer, T. C., Cothard, N. F., Nayak, O., et al. 2025, arXiv e-prints, arXiv:2508.11044, doi: 10.48550/arXiv.2508.11044
work page internal anchor Pith review Pith/arXiv arXiv doi:10.48550/arxiv.2508.11044 2025
-
[15]
Fuller, W. A. 2009, Measurement error models (John Wiley & Sons)
2009
-
[16]
2022, ApJ, 940, 133, doi: 10.3847/1538-4357/ac9af1
Gao, Y., Tan, Q.-H., Gao, Y., et al. 2022, ApJ, 940, 133, doi: 10.3847/1538-4357/ac9af1
-
[17]
2019, ApJ, 887, 172, doi: 10.3847/1538-4357/ab557c
Gao, Y., Xiao, T., Li, C., et al. 2019, ApJ, 887, 172, doi: 10.3847/1538-4357/ab557c
-
[18]
2025, ApJ, 979, 105, doi: 10.3847/1538-4357/ad9d0f
Gao, Y., Wang, E., Tan, Q.-H., et al. 2025, ApJ, 979, 105, doi: 10.3847/1538-4357/ad9d0f
-
[19]
Gardner, J. P., Mather, J. C., Clampin, M., et al. 2006, SSRv, 123, 485, doi: 10.1007/s11214-006-8315-7
-
[20]
Gordon, K. D., Fitzpatrick, E. L., Massa, D., et al. 2024, ApJ, 970, 51, doi: 10.3847/1538-4357/ad4be1
-
[21]
2025, Research in Astronomy and Astrophysics, 25, 065017, doi: 10.1088/1674-4527/add673
Guo, R., Li, C., Zhou, S., et al. 2025, Research in Astronomy and Astrophysics, 25, 065017, doi: 10.1088/1674-4527/add673
-
[22]
Harris, C. R., Millman, K. J., van der Walt, S. J., et al. 2020, Nature, 585, 357, doi: 10.1038/s41586-020-2649-2
-
[23]
Hunter, J. D. 2007, Computing in Science & Engineering, 9, 90, doi: 10.1109/MCSE.2007.55
-
[24]
2020, MNRAS, 499, 5749, doi: 10.1093/mnras/staa3259
Ji, X., & Yan, R. 2020, MNRAS, 499, 5749, doi: 10.1093/mnras/staa3259
-
[25]
2015, ApJ, 799, 92, doi: 10.1088/0004-637X/799/1/92 22Jing & Li Jimenez Rezende, D., & Mohamed, S
Jiang, X.-J., Wang, Z., Gu, Q., Wang, J., & Zhang, Z.-Y. 2015, ApJ, 799, 92, doi: 10.1088/0004-637X/799/1/92 22Jing & Li Jimenez Rezende, D., & Mohamed, S. 2015, arXiv e-prints, arXiv:1505.05770, doi: 10.48550/arXiv.1505.05770
-
[26]
2025, AJ, 170, 45, doi: 10.3847/1538-3881/add891
Jing, T., & Li, C. 2025, AJ, 170, 45, doi: 10.3847/1538-3881/add891
-
[27]
2025, arXiv e-prints, arXiv:2510.03716, doi: 10.48550/arXiv.2510.03716
Katayama, R., Kaneda, H., Kokusho, T., et al. 2025, arXiv e-prints, arXiv:2510.03716, doi: 10.48550/arXiv.2510.03716
-
[28]
Keenan, R. P., Marrone, D. P., & Keating, G. K. 2025, ApJ, 979, 228, doi: 10.3847/1538-4357/ada361
-
[29]
Kelly, B. C. 2007, ApJ, 665, 1489, doi: 10.1086/519947
doi:10.1086/519947 2007
-
[30]
2021, Research Notes of the American Astronomical Society, 5, 39, doi: 10.3847/2515-5172/abe8df
Klein, R. 2021, Research Notes of the American Astronomical Society, 5, 39, doi: 10.3847/2515-5172/abe8df
-
[31]
2025, arXiv e-prints, arXiv:2505.08876
Koda, J., Egusa, F., Hirota, A., et al. 2025, arXiv e-prints, arXiv:2505.08876. https://arxiv.org/abs/2505.08876
Pith/arXiv arXiv 2025
-
[32]
2025, ApJ, 980, 126, doi: 10.3847/1538-4357/ada6b5
Komugi, S., Sawada, T., Koda, J., et al. 2025, ApJ, 980, 126, doi: 10.3847/1538-4357/ada6b5
-
[33]
Lee, J. C., Sandstrom, K. M., Leroy, A. K., et al. 2023, ApJL, 944, L17, doi: 10.3847/2041-8213/acaaae
-
[34]
1985, A&A, 146, 81
Leger, A., & D’Hendecourt, L. 1985, A&A, 146, 81
1985
-
[35]
K., Hughes, A., Liu, D., et al
Leroy, A. K., Hughes, A., Liu, D., et al. 2021a, ApJS, 255, 19, doi: 10.3847/1538-4365/abec80
-
[36]
K., Schinnerer, E., Hughes, A., et al
Leroy, A. K., Schinnerer, E., Hughes, A., et al. 2021b, ApJS, 257, 43, doi: 10.3847/1538-4365/ac17f3
-
[37]
Leroy, A. K., Bolatto, A. D., Sandstrom, K., et al. 2023a, ApJL, 944, L10, doi: 10.3847/2041-8213/acab01
-
[38]
K., Sandstrom, K., Rosolowsky, E., et al
Leroy, A. K., Sandstrom, K., Rosolowsky, E., et al. 2023b, ApJL, 944, L9, doi: 10.3847/2041-8213/acaf85
-
[39]
Li, A., & Draine, B. T. 2001, ApJ, 554, 778, doi: 10.1086/323147
doi:10.1086/323147 2001
-
[40]
Lin, Q., Yang, X. J., & Li, A. 2023, MNRAS, 525, 2380, doi: 10.1093/mnras/stad2405
-
[41]
Lind-Thomsen, C., Sneppen, A., & Steinhardt, C. L. 2025, ApJ, 985, 144, doi: 10.3847/1538-4357/adc808
-
[42]
Liu, Z., Silverman, J. D., Daddi, E., et al. 2025, arXiv e-prints, arXiv:2505.09728. https://arxiv.org/abs/2505.09728
Pith/arXiv arXiv 2025
-
[43]
Luo, C. S., Tang, X. D., Henkel, C., et al. 2025, A&A, 698, A54, doi: 10.1051/0004-6361/202453007
-
[44]
2022, ApJ, 926, 96, doi: 10.3847/1538-4357/ac4505
Maeda, F., Egusa, F., Ohta, K., et al. 2022, ApJ, 926, 96, doi: 10.3847/1538-4357/ac4505
-
[45]
Massa, D., Gordon, K. D., & Fitzpatrick, E. L. 2022, ApJ, 925, 19, doi: 10.3847/1538-4357/ac3825
-
[46]
Narayanan, D., Smith, J. D. T., Hensley, B. S., et al. 2023, ApJ, 951, 100, doi: 10.3847/1538-4357/accf8d
-
[47]
Peacock, J. A. 1983, MNRAS, 202, 615, doi: 10.1093/mnras/202.3.615
-
[48]
Flannery, B. P. 2002, Numerical recipes in C++ : the art of scientific computing
2002
-
[49]
Richie, H. M., & Hensley, B. S. 2025, arXiv e-prints, arXiv:2510.16861. https://arxiv.org/abs/2510.16861
arXiv 2025
-
[50]
2024,, v0.13.1 Zenodo, doi: 10.5281/zenodo.10931886
Robitaille, T., Ginsburg, A., Mumford, S., et al. 2024,, v0.13.1 Zenodo, doi: 10.5281/zenodo.10931886
-
[51]
Salama, F., Bakes, E. L. O., Allamandola, L. J., & Tielens, A. G. G. M. 1996, ApJ, 458, 621, doi: 10.1086/176844
-
[52]
Salama, F., & Ehrenfreund, P. 2014, in IAU Symposium, Vol. 297, The Diffuse Interstellar Bands, ed. J. Cami & N. L. J. Cox, 364–369, doi: 10.1017/S174392131301613X
-
[53]
Salama, F., Galazutdinov, G. A., Kre lowski, J., et al. 2011, ApJ, 728, 154, doi: 10.1088/0004-637X/728/2/154
-
[54]
2022, MNRAS, 514, 1886, doi: 10.1093/mnras/stac1313
Shivaei, I., Boogaard, L., D ´ ıaz-Santos, T., et al. 2022, MNRAS, 514, 1886, doi: 10.1093/mnras/stac1313
-
[55]
2025, arXiv e-prints, arXiv:2510.05214, doi: 10.48550/arXiv.2510.05214 van der Zwet, G
Sun, J., Teng, Y.-H., Chiang, I.-D., et al. 2025, arXiv e-prints, arXiv:2510.05214, doi: 10.48550/arXiv.2510.05214 van der Zwet, G. P., & Allamandola, L. J. 1985, A&A, 146, 76 Van Rossum, G., & Drake, F. L. 2009, Python 3 Reference Manual (Scotts Valley, CA: CreateSpace)
-
[56]
Virtanen, P., Gommers, R., Oliphant, T. E., et al. 2020, Nature Methods, 17, 261, doi: 10.1038/s41592-019-0686-2
-
[57]
A., Bundy, K., Diamond-Stanic, A
Wake, D. A., Bundy, K., Diamond-Stanic, A. M., et al. 2017, AJ, 154, 86, doi: 10.3847/1538-3881/aa7ecc
-
[58]
Werner, M. W., Roellig, T. L., Low, F. J., et al. 2004, ApJS, 154, 1, doi: 10.1086/422992
doi:10.1086/422992 2004
-
[59]
M., Sandstrom, K., Leroy, A., & Smith, J
Whitcomb, C. M., Sandstrom, K., Leroy, A., & Smith, J. D. T. 2023, ApJ, 948, 88, doi: 10.3847/1538-4357/acc316
-
[60]
Williams, T. G., Lee, J. C., Larson, K. L., et al. 2024, ApJS, 273, 13, doi: 10.3847/1538-4365/ad4be5
-
[61]
Wright, E. L., Eisenhardt, P. R. M., Mainzer, A. K., et al. 2010, AJ, 140, 1868, doi: 10.1088/0004-6256/140/6/1868
-
[62]
Zhou, S., Li, C., Li, N., et al. 2023, ApJ, 957, 75, doi: 10.3847/1538-4357/acfb80 CO-MIR Correlations23 APPENDIX A.RESULTS OF SINGLE LOG-LINEAR REGRESSION ANALYSIS Best-fit results based on KS-test based method for different MIR bands in regions with varying ionization conditions across different galaxies are listed in Table 2. 24Jing & Li T able 2. Best...
discussion (0)
Sign in with ORCID, Apple, or X to comment. Anyone can read and Pith papers without signing in.