REVIEW 4 major objections 5 minor
Learning visual representations for compositional analysis of artworks and photographs
T0 review · 4 major / 5 minor · reviewed 2026-08-07 · deepseek-v4-flash
Pith's one-line read Fine-tuned self-supervised models outperform a human-inspired, interpretable pipeline on composition analysis when labeled data is plentiful, but sacrifice interpretability and cross-domain generalization.
desk verdict Solid empirical comparison, but the cross-domain cost of fine-tuning is asserted, not measured—and the paper's own qualitative results contradict it. read the letter →
The pith
A machine-rendered reading of the paper's core claim, the machinery that carries it, and where it could break.
The reading
What carries the argument
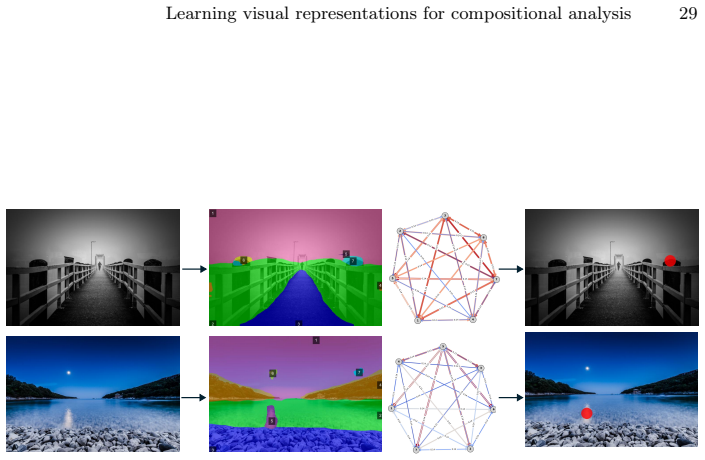
Slot attention (an attention-based soft-clustering mechanism that partitions image features into a fixed set of slots, each summarizing a semantic region) provides the node representations; a graph attention network (GAT, a message-passing model that learns importance weights on edges between nodes) models the spatial relationships among those regions. The final embedding concatenates slot features with the GAT-refined output, and saliency is derived by summing outgoing edge weights per node. The fixed, small number of slots (seven in this work) is what keeps the pipeline computationally cheap and directly interpretable.
What would settle it
Measure OCL+GAT accuracy on an artwork composition test set after randomly permuting the slot assignments (or replacing OCL regions with random partitions of the image). If performance does not drop, the semantic meaningfulness of the regions is not carrying the result. Alternatively, compute OCL segmentation quality on the DRAM ground-truth segmentation dataset: if FG-ARI or mIoU on paintings is near chance, the meaningful-region claim fails.
Extended reading notes
Core claim
The paper's central claim is dual. First, explicitly modeling composition as relationships between semantically meaningful regions — obtained by slot attention and related by a graph attention network — is sufficient to match or beat large frozen self-supervised feature extractors on composition category classification and to substantially outperform them on composition feature distinction, robustness to semantic interference, and compositional retrieval. Second, fine-tuning large self-supervised models such as Dinov2 on a large composition dataset (PICD) produces large gains across all tasks, contradicting earlier conclusions that such models are irreducibly semantic-biased; the paper attributes the earlier failures to ill-defined training objectives rather than model capacity. The paper also shows that the graph edge weights of the human-inspired model can be read directly as region-importance scores for visual saliency, matching the ranking of human eye-tracking fixations, and that a global composition score (APDDv2) is too coarse for the GAT to learn meaningful region relationships, resulting in near-uniform attention.
Load-bearing premise
The approach assumes that slot attention, trained on natural images, produces semantically meaningful region decompositions on artwork without any domain adaptation; the paper supports this only with qualitative examples.
Editorial extensions
If this is right
- With a clearly defined composition objective, fine-tuned foundation models can overcome semantic bias, so earlier negative results on such models should be re-read as objective-design failures.
- Frozen OCL+GAT delivers near-comparable composition classification with about 0.99M trainable parameters versus roughly 22M–86M for the fine-tuned Dinov2 variants.
- Composition category labels learned on photographs transfer to artwork for some categories, but photographic categories are too rigid for art and missing categories such as symmetry bound what any model can learn.
- Saliency maps derived from GAT edge weights give a supervision-free, interpretable alternative to specialized saliency models and eye-tracking data.
- Global single-score composition labels (APDDv2) are insufficient for learning region relationships; the GAT collapses to near-uniform attention on that task.
Reading between the lines
- A natural next experiment is a scaling study: as labeled composition data grows, the gap between frozen human-inspired and fine-tuned foundation models should widen monotonically; if it saturates, the interpretable graph becomes a viable distillation target.
- The near-uniform GAT on score prediction suggests that replacing scalar scores with compositional descriptions (which the paper proposes) could restore relational learning; LLM-generated descriptions of artworks are a cheap way to test this.
- Region-level saliency from GAT edge weights could be scored quantitatively against eye-tracking fixation clusters with a hit-rate-at-k metric; the paper only compares qualitatively.
- The paper's unified-embedding claim implies that one composition embedding could serve aesthetic assessment, retrieval, and saliency without task-specific heads; testing on other tasks like image cropping or generative art is a direct extension.
Signed reviews
Editorial analysis
A structured set of objections, weighed in public.
Referee Report
Summary. The paper compares two paradigms for learning visual compositions from photographs and artworks: a human-inspired pipeline that combines object-centric learning (OCL) with a graph attention network (GAT), and self-supervised foundation models (DINOv2-s/b) that are either frozen or fine-tuned. The authors evaluate these on composition category classification (PICD), composition score prediction (APDDv2), and three downstream tasks (composition feature distinction, semantic interference, retrieval, and visual saliency). They report that frozen OCL+GAT is competitive and interpretable, that hybrid OCL+GAT+DINOv2 helps in the frozen regime, and that fine-tuned DINOv2 achieves the best scores when sufficient labeled data is available. The abstract and conclusion add that this superior performance comes at the cost of interpretability and cross-domain generalization.
Significance. If the results hold, the paper provides a useful head-to-head comparison and challenges the prior claim that current models cannot capture composition because of semantic bias. The finding that fine-tuned DINOv2 performs well on composition-specific tasks after training on a sufficiently large and well-defined dataset is an important positive result. The OCL+GAT pipeline is also potentially valuable for its interpretability and low parameter count (990K parameters). However, the paper's central dichotomy is weakened by the absence of quantitative cross-domain evaluation and by the lack of error bars; in addition, the saliency claim is only qualitative. The paper is a timely contribution but needs revision before the central claims are fully supported.
major comments (4)
- [Abstract; Sec. 4.3; Conclusion] The central claim that fine-tuned foundation models perform better 'at the cost of ... cross-domain generalization' is not supported by any quantitative experiment. Table 2 is an in-domain comparison on APDDv2, and Supp. Table 1 measures OCL segmentation quality on DRAM after fine-tuning on BAID, without comparing against fine-tuned DINOv2. The only cross-domain evidence is qualitative (Fig. 4, Fig. 8, Supp. Sec. 5.1). Critically, Supp. Sec. 5.1 states that 'composition categories learned on PICD appear to generalize to artwork' for the shown models, which include the fine-tuned DINOv2-b (Model B). This directly undercuts the assertion that fine-tuning DINOv2 sacrifices cross-domain generalization. Please add a quantitative cross-domain experiment (e.g., zero-shot category prediction on an artwork test set) or revise the claim.
- [Sec. 4.2; Tables 1-2] All results are from single runs, with no error bars or multiple seeds. Several important comparisons are numerically close: on APDDv2, OCL-BAID + GAT + DINOv2-b gives PLCC 68.26 versus fine-tuned DINOv2-b at 68.94, and fine-tuned DINOv2-s actually has higher accuracy (85.08) than fine-tuned DINOv2-b (82.96). Without variance estimates or significance testing, the statement that fine-tuned models 'outperform significantly' is not established. In addition, I could not find a description of the train/test split used for the APDDv2 experiments in Table 2; please specify how the 10k images were partitioned.
- [Sec. 4.4, visual saliency detection] The saliency evaluation is purely qualitative. The text claims that the model 'consistently identifies the regions that human observers fixate on most' and that 'the ranking of region importance ... aligns with the order of visual attention,' but no quantitative metric, such as IoU against fixation clusters or a rank correlation, is reported. Since saliency is one of the three downstream tasks that motivate the unified representation, this is a load-bearing gap. Add a quantitative evaluation or explicitly present the saliency results as qualitative illustrations only.
- [Supp. Sec. 1; Sec. 4.3] The PICD train/test split is constructed by the authors and is not released. Supp. Sec. 1 states that multi-label combinations occurring only once are assigned exclusively to the test set, which makes the test distribution atypical relative to the original dataset. Without releasing the exact split and code, the reported numbers are not reproducible, and the difficulty of the test set could differ from the original PICD evaluation. Please release the split and the evaluation code, or provide an analysis of the split's effect on the results.
minor comments (5)
- [Eq. (1)] The indicator function is written as '1[...]' but is not defined; please clarify the notation.
- [Tables 1-2] The table headers use 'APDD' while the dataset is called 'APDDv2' in the text; please standardize the abbreviation.
- [Sec. 4.4] The dynamic saliency threshold of 0.2 is introduced without motivation or sensitivity analysis; please justify this choice or add a small sensitivity study.
- [Sec. 3.2 / Implementation details] The GAT hyperparameters (number of layers, number of attention heads, hidden size) are not reported; adding them would improve reproducibility.
- [Supp. Sec. 5.1] The statement that 'composition categories learned on PICD appear to generalize to artwork' is interesting but should be accompanied by a note that this observation is based on a limited qualitative sample.
Circularity Check
No significant circularity: the central comparison is a held-out benchmark; the cross-domain generalization claim is under-evidenced but not circular.
full rationale
The paper's derivation chain is an empirical benchmark comparison rather than a formal derivation. The human-inspired pipeline (OCL+GAT) and fine-tuned foundation models are trained on designated train splits (stratified PICD split, APDDv2) and evaluated on held-out test splits, with no test-set values fitted. The object-centric model, slot attention, GAT, and Dinov2 are all external prior work with transparent adaptation. Saliency is defined as the sum of outgoing edge weights and then compared against external eye-tracking data, which is an externally falsifiable evaluation rather than a self-consistency check. The only self-citation (ref. [40], Wagemans et al., for eye-tracking data) provides empirical ground truth and is not load-bearing for any claimed derivation. The paper's central claim that fine-tuning foundation models sacrifices cross-domain generalization is asserted rather than quantitatively measured, and Supplementary Section 5.1 even states that composition categories learned on PICD appear to generalize to artwork for fine-tuned Dinov2-b; this weakens the support for the claim but does not make the claim circular. No equation in the paper reduces to a fitted parameter or to a self-citation chain, so no circular step can be exhibited. The appropriate classification is therefore a non-finding on circularity, with the noted evidence gap belonging to correctness risk rather than circularity.
Assumptions & free parameters
free parameters (3)
- Saliency dynamic threshold =
0.2
- Number of slots =
7
- GAT hyperparameters (hidden size, heads, layers) =
Unspecified
assumptions (3)
- domain assumption OCL models generalize across domains from natural images to artwork.
- domain assumption Slot attention produces semantically meaningful regions that correspond to perceptual grouping.
- domain assumption Composition categories in PICD are well-defined and transfer to artwork.
Cite this review
Pith. "Pith review of Learning visual representations for compositional analysis of artworks and photographs." pith.science (2026). https://pith.science/paper/YRPTEXS4
@misc{pith2026260806142,
  author       = {Pith},
  title        = {Pith review of: Learning visual representations for compositional analysis of artworks and photographs},
  year         = {2026},
  howpublished = {\url{https://pith.science/paper/YRPTEXS4}},
  note         = {Machine review of arXiv:2608.06142}
}
read the original abstract
Composition, the deliberate arrangement of visual elements, is central to how meaning, emotion, and aesthetic quality are conveyed in artwork, yet it remains among the least formalized dimensions of visual understanding. Prior work highlights a persistent gap in learning meaningful compositional representations, attributing it to semantic bias and suggesting that human-inspired approaches may be key. We compare two parallel paradigms for composition analysis: a human-inspired method grounded in perceptual grouping, and fine-tuned foundation models enabled by recent large-scale compositional datasets. The human-inspired approach uses object-centric models for region-level decomposition and a graph attention network to capture spatial relationships between elements. Both paradigms are evaluated on composition score/category prediction, compositional image retrieval, and visual saliency detection. With frozen encoders, the human-inspired method achieves competitive performance while remaining interpretable. When sufficient data enables fine-tuning, large self-supervised models outperform significantly, but at the cost of interpretability and cross-domain generalization. Code and pre-trained models are available on GitHub.
Figures


Figures from the paper (17 more)


Reviewed August 7, 2026 · model on record in the stance chip above.
Discussion (0). Continue with ORCID to comment.