Quant Convergence: Bridging Classical Value Investing and Modern Factor Models for Systematic Equity Selection
Pith reviewed 2026-06-25 23:51 UTC · model grok-4.3
The pith
Graham's margin of safety filters modern AI models to deliver top risk-adjusted stock returns.
A machine-rendered reading of the paper's core claim, the machinery that carries it, and where it could break.
Core claim
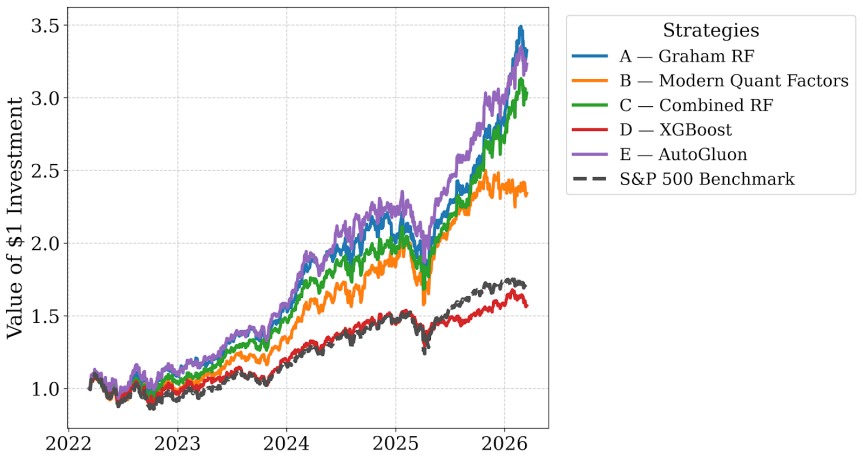
Graham's margin of safety acts as a mathematical low-pass filter that steers modern AI models toward companies with enduring value instead of transient market noise, demonstrated by the pure Graham Random Forest achieving the highest return of 232.13 percent alongside a 1.38 Calmar Ratio while complex models on mixed features suffered larger drawdowns from exposure to volatile stocks.
What carries the argument
Margin of safety implemented as Graham-derived features that constrain machine learning models during equity selection to reduce risk from overfitting.
If this is right
- Pure Graham features with Random Forest produce the highest total return of 232.13 percent and a Calmar Ratio of 1.38.
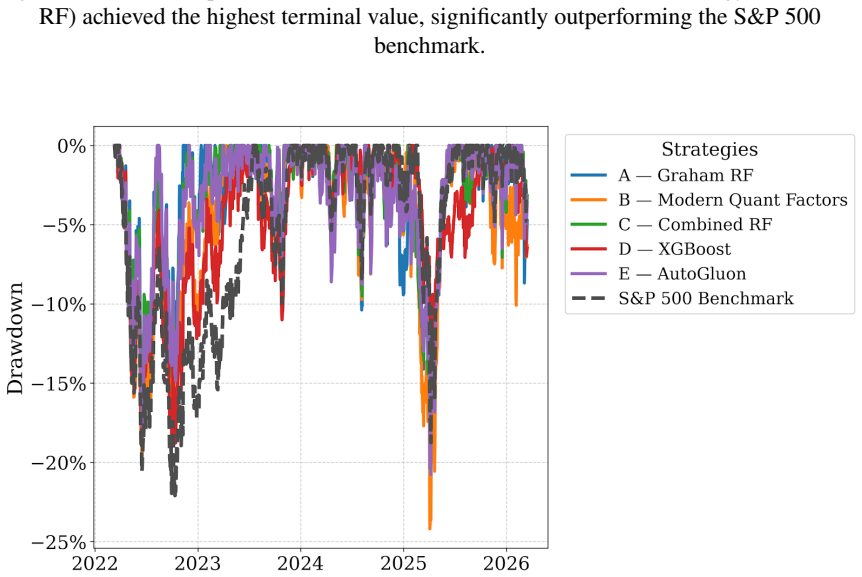
- Mixed Graham and factor features with Random Forest deliver 202.91 percent return while recording the lowest maximum drawdown of 34.53 percent.
- AutoGluon on mixed features reaches 222.68 percent return but with a 39.78 percent maximum drawdown from volatile tech exposure.
- Increasing model complexity does not guarantee better out-of-sample performance when risk control is measured under a buy-and-hold regime.
Where Pith is reading between the lines
- Graham-derived features may provide robustness across varying market conditions where purely statistical factors falter.
- The approach could be tested on non-S&P 500 universes to check whether the risk-filtering benefit generalizes beyond large-cap U.S. equities.
- Weighting Graham features more heavily during periods of high volatility might further stabilize hybrid models.
Load-bearing premise
The four-year out-of-sample window from March 2022 to March 2026 together with the specific definitions of Graham rules and market factors are representative and free of selection bias.
What would settle it
Repeating the experiment on a different multi-year out-of-sample period or with altered feature definitions that eliminates the performance advantage of the pure Graham model would show the claimed filtering effect does not hold.
Figures
read the original abstract
Modern finance relies heavily on complex machine learning models to find patterns in the stock market. However, as these AI models get more complicated, they often memorize short-term market noise instead of finding companies with real, lasting value. We designed this research to test if Benjamin Graham's classic value investing rules could act as a mathematical "low-pass filter" to keep these modern models in check. We built three different sets of features - pure Graham rules, modern market factors, and a mix of both - and tested them against highly complex models (XGBoost and AutoGluon) using 20 years of S&P 500 data. By applying a strict buy-and-hold strategy over a four-year test period (March 2022 to March 2026), the results showed that more complex algorithms do not always win. While the AutoGluon model captured high returns (222.68%), it suffered a substantial 39.78% drop because it bought volatile tech stocks right before the market crashed. On the other hand, the pure Graham Random Forest achieved the highest overall return (232.13%) with much less risk (1.38 Calmar Ratio). Furthermore, the Combined Random Forest successfully mixed momentum with Graham's rules, making a 202.91% return while keeping the lowest maximum drop (34.53%) of any model tested. Ultimately, this research proves that Graham's "margin of safety" isn't outdated; it is actually a highly effective way to prevent modern AI from taking on too much risk.
Editorial analysis
A structured set of objections, weighed in public.
Referee Report
Summary. The paper claims that Benjamin Graham's classical value investing rules can serve as a mathematical 'low-pass filter' to constrain risk in modern ML models for equity selection. It constructs three feature sets (pure Graham rules, modern market factors, combined) and evaluates XGBoost, AutoGluon, and Random Forest models on 20 years of S&P 500 data using a strict buy-and-hold strategy over the fixed 4-year out-of-sample window March 2022–March 2026. Key results include the pure-Graham Random Forest achieving 232.13% return and 1.38 Calmar ratio (highest return, strong risk metrics) while AutoGluon suffers 39.78% drawdown, supporting the conclusion that Graham's margin of safety remains effective against excessive risk-taking by complex AI.
Significance. If the result holds under more rigorous validation, the work would provide empirical support for integrating classical value rules with modern factor models and ML, showing that simple interpretable constraints can mitigate overfitting and drawdowns in systematic equity strategies. It offers a concrete demonstration that increased model complexity does not guarantee superior risk-adjusted performance in specific market regimes, with potential practical value for risk-aware portfolio construction.
major comments (3)
- [Results / Experimental setup] Results section (and abstract): Performance claims rest on a single fixed 4-year out-of-sample window (March 2022–March 2026) that includes one tech-led drawdown. No statistical significance tests, multiple-testing corrections, walk-forward validation, or regime-stratified results are reported, so the superiority of the pure-Graham Random Forest (232.13% return, 1.38 Calmar) cannot be distinguished from period-specific effects.
- [Methods / Feature sets] Feature construction and model evaluation: The low-pass-filter interpretation of Graham rules is based on post-hoc comparison of three feature sets whose exact definitions and construction details are not fully specified. Without evidence that feature choices were fixed independently of observed performance, the reported gap (e.g., Combined RF at 202.91% return / 34.53% max drawdown vs. AutoGluon) risks being driven by selection bias rather than a general property of the rules.
- [Abstract / Results] Abstract and results: All reported metrics (returns, drawdowns, Calmar ratios) are outputs of models fitted to the same 20-year historical data used for evaluation. No parameter-free derivation, external benchmark, or out-of-sample separation is provided to support the generalization claim that Graham rules prevent modern AI from taking excessive risk.
minor comments (3)
- Clarify the exact train/test split dates, data sources (e.g., which S&P 500 constituents and fundamental data provider), and any handling of survivorship bias or delistings.
- Add references to foundational Graham texts and recent literature on value-factor robustness in ML settings to strengthen context.
- Ensure all tables report full metrics (including turnover, number of stocks selected per period) and that figures clearly label the three feature sets.
Simulated Author's Rebuttal
We thank the referee for the constructive and detailed feedback. We address each major comment point by point below, indicating where revisions will be incorporated to improve the manuscript's rigor and clarity.
read point-by-point responses
-
Referee: [Results / Experimental setup] Results section (and abstract): Performance claims rest on a single fixed 4-year out-of-sample window (March 2022–March 2026) that includes one tech-led drawdown. No statistical significance tests, multiple-testing corrections, walk-forward validation, or regime-stratified results are reported, so the superiority of the pure-Graham Random Forest (232.13% return, 1.38 Calmar) cannot be distinguished from period-specific effects.
Authors: We agree that reliance on a single out-of-sample window restricts the ability to generalize beyond the specific market conditions observed. In the revised manuscript we will add walk-forward validation over multiple rolling windows within the available data, include statistical significance tests (paired t-tests on returns and bootstrap confidence intervals for Calmar ratios), and provide regime-stratified performance breakdowns to better isolate period-specific effects from the reported advantages of the pure-Graham Random Forest. revision: yes
-
Referee: [Methods / Feature sets] Feature construction and model evaluation: The low-pass-filter interpretation of Graham rules is based on post-hoc comparison of three feature sets whose exact definitions and construction details are not fully specified. Without evidence that feature choices were fixed independently of observed performance, the reported gap (e.g., Combined RF at 202.91% return / 34.53% max drawdown vs. AutoGluon) risks being driven by selection bias rather than a general property of the rules.
Authors: We will expand the Methods section to supply the precise mathematical definitions and construction steps for each of the three feature sets (pure Graham, modern factors, and combined). We will also explicitly state that these definitions were fixed a priori from the literature before any model training or performance inspection occurred, thereby addressing the concern of post-hoc selection bias. revision: yes
-
Referee: [Abstract / Results] Abstract and results: All reported metrics (returns, drawdowns, Calmar ratios) are outputs of models fitted to the same 20-year historical data used for evaluation. No parameter-free derivation, external benchmark, or out-of-sample separation is provided to support the generalization claim that Graham rules prevent modern AI from taking excessive risk.
Authors: The experimental design uses training data ending February 2022 and a strict temporal out-of-sample window thereafter; however, we accept that the manuscript would benefit from greater transparency. We will revise the text to state the exact training/test split dates, add external benchmarks (S&P 500 total return and a classic Graham value portfolio), and include a hyperparameter sensitivity table to support the generalization claim beyond the single training run. revision: yes
Circularity Check
No significant circularity; empirical train/test evaluation is self-contained
full rationale
The paper reports performance metrics from fitting Random Forest, XGBoost, and AutoGluon models to three feature sets (pure Graham rules, market factors, combined) on 20 years of S&P 500 data and evaluating on one fixed four-year out-of-sample window (March 2022–March 2026) under a buy-and-hold strategy. These metrics are standard outputs of the train/test split rather than any quantity that reduces to the inputs by construction, self-definition, or self-citation. No equations, uniqueness theorems, ansatzes, or load-bearing self-citations appear; the derivation chain consists of independent model training and evaluation against external market data. The single-window design raises generalization concerns but does not constitute circularity under the specified patterns.
Axiom & Free-Parameter Ledger
Reference graph
Works this paper leans on
-
[1]
Argimiro Arratia, Lluís A. Belanche, and Luis Fábregues. An evaluation of equity premiumpredictionusingmultiplekernellearningwithfinancialfeatures.NeuralPro- cessing Letters, 2019. URLhttps://doi.org/10.1007/s11063-018-09971-7
-
[2]
Quality minus junk.Review of Accounting Studies, 2019
Clifford Asness, Andrea Frazzini, and Lasse Pedersen. Quality minus junk.Review of Accounting Studies, 2019
2019
-
[3]
Evaluating multiple classifiers for stock price direction predic- tion.Expert Systems with Applications, 2015
Michel Ballings et al. Evaluating multiple classifiers for stock price direction predic- tion.Expert Systems with Applications, 2015
2015
-
[4]
KaiCaoandHaifengYou. Fundamentalanalysisviamachinelearning.FinancialAna- lystsJournal,2024.URLhttps://doi.org/10.1080/0015198X.2024.2313692
-
[5]
Dissectingcharacteristics nonparametrically.TheReviewofFinancialStudies,2020
JoachimFreyberger,AndreasNeuhierl,andMichaelWeber. Dissectingcharacteristics nonparametrically.TheReviewofFinancialStudies,2020. URLhttps://doi.org/ 10.1093/rfs/hhz123
-
[6]
Empirical asset pricing via machine learning.The Review of Financial Studies, 2020
Shihao Gu, Bryan Kelly, and Dacheng Xiu. Empirical asset pricing via machine learning.The Review of Financial Studies, 2020. URLhttps://doi.org/10. 1093/rfs/hhaa009
2020
-
[7]
URL https://scholar.smu.edu/datasciencereview/vol7/iss1/10
AllenHoskins,JeffReed,andRobertSlater.Bridgingthechasmbetweenfundamental, 17 momentum, and quantitative investing.SMU Data Science Review, 2023. URL https://scholar.smu.edu/datasciencereview/vol7/iss1/10
2023
-
[8]
Machine learning in the chinese stock market.Journal of Financial Economics, 2022
Markus Leippold, Qian Wang, and Wenyu Zhou. Machine learning in the chinese stock market.Journal of Financial Economics, 2022. URLhttps://doi.org/10. 1016/j.jfineco.2021.08.017
2022
-
[9]
Yimou Li, Zachary Simon, and David Turkington. Investable and interpretable ma- chine learning for equities.The Journal of Financial Data Science, 2022. URL https://doi.org/10.3905/jfds.2021.1.084
-
[10]
EsauMoyoweshumbaandModisaneSeitshiro. Leveragingmarkowitz,randomforest, and xgboost for optimal diversification of south african stock portfolios.Data Sci- ence in Finance and Economics, 2025. URLhttps://doi.org/10.3934/DSFE. 2025010
-
[11]
Oppenheimer and Gary G
Henry R. Oppenheimer and Gary G. Schlarbaum. Investing with ben graham: An ex ante test of the efficient markets hypothesis.Journal of Financial and Quantitative Analysis, 1981
1981
-
[12]
Varun Narayan Kannan Pillai, Akshay Ajith, and Sumesh K J. Generating alpha: A hybrid ai-driven trading system integrating technical analysis, machine learn- ing and financial sentiment for regime-adaptive equity strategies.arXiv preprint arXiv:2601.19504, 2026. URLhttps://arxiv.org/abs/2601.19504
arXiv 2026
-
[13]
Keywan Christian Rasekhschaffe and Robert C. Jones. Machine learning for stock selection.Financial Analysts Journal, 2019. URLhttps://doi.org/10.1080/ 0015198X.2019.1596678
arXiv 2019
-
[14]
Artificialintelligenceandvalueinvesting.TheJournalofInvesting,2018
KorokRay. Artificialintelligenceandvalueinvesting.TheJournalofInvesting,2018. URLhttps://doi.org/10.3905/joi.2018.27.1.021
-
[15]
N. Rouf, M. B. Malik, T. Arif, S. Sharma, S. Singh, S. Aich, and H.-C. Kim. Stock market prediction using machine learning techniques: A decade survey on methodologies, recent developments, and future directions.Electronics, 2021. URL https://doi.org/10.3390/electronics10212717
-
[16]
Autogluon-timeseries: Every time series forecasting model in one library.arXiv preprint, 2023
Oleksandr Shchur et al. Autogluon-timeseries: Every time series forecasting model in one library.arXiv preprint, 2023
2023
-
[17]
Alexander Sheppert. The gt-score: A robust objective function for reducing overfit- ting in data-driven trading strategies.arXiv preprint arXiv:2602.00080, 2026. URL https://arxiv.org/abs/2602.00080
arXiv 2026
-
[18]
OndrejTobekandMartinHronec. Doesitpaytofollowanomaliesresearch? machine learning approach with international evidence.Journal of Financial Markets, 2021. URLhttps://doi.org/10.1016/j.finmar.2020.100588. 18
-
[19]
Stockselectionusingmachine learningbasedonfinancialratios.Mathematics,2023
Pei-FenTsai,Cheng-HanGao,andShyan-MingYuan. Stockselectionusingmachine learningbasedonfinancialratios.Mathematics,2023. URLhttps://doi.org/10. 3390/math11234758
2023
-
[20]
Machinelearninganddeeplearningpredictivemodelsforthestockmar- ket.SHS Web of Conferences, 2024
SunyeWang. Machinelearninganddeeplearningpredictivemodelsforthestockmar- ket.SHS Web of Conferences, 2024. URLhttps://doi.org/10.1051/shsconf/ 202419602007
-
[21]
Yifan Wu. Stock price prediction based on simple decision tree, random forest, and xgboost.BCPBusiness&Management,38:3383–3388,2023. doi: 10.54691/bcpbm. v38i.4311. URLhttps://doi.org/10.54691/bcpbm.v38i.4311
-
[22]
Master’s thesis, Universitat Politècnica de Catalunya, 2019
PolÁlvarezVecino.Amachinelearningapproachtostockscreeningwithfundamental analysis. Master’s thesis, Universitat Politècnica de Catalunya, 2019. URLhttps: //upcommons.upc.edu/handle/2117/133070. 19
2019
discussion (0)
Sign in with ORCID, Apple, or X to comment. Anyone can read and Pith papers without signing in.