REVIEW 4 major objections 5 minor 16 references
A case for data valuation transparency via DValCards
T0 review · 4 major / 5 minor · reviewed 2026-08-06 · deepseek-v4-flash
Pith's one-line read Data valuation scores, which assign each data point a number reflecting its contribution to model performance, shift significantly under routine preprocessing choices, and value-based data cleaning can worsen class imbalance and…
desk verdict Useful empirical mapping of data valuation instability under imputation, with a sensible transparency proposal; the 'inherent' claim overreaches, but the paper is honest about its scope and deserves a serious referee. read the letter →
The pith
A machine-rendered reading of the paper's core claim, the machinery that carries it, and where it could break.
The reading
What carries the argument
The argument is carried by a controlled experimental protocol that varies one design choice at a time while holding everything else fixed. Nine complete tabular classification datasets had missingness induced at three rates (1%, 10%, 30%) under three patterns (missing completely at random, missing at random, missing not at random), were repaired with twelve imputation methods, and were then valued with up to six metrics — TMC-Shapley and G-Shapley (Monte Carlo approximations of the Shapley value), leave-one-out (LOO), Banzhaf (a semivalue-based method proposed for stability across model runs), CS-Shapley (class-wise Shapley), and FairShap (fairness-based Shapley) — using logistic regression as the learning algorithm (kNN for FairShap). Three instruments produce the results: Kendall's $\tau$ for rank agreement between preprocessing conditions, class balance $b$ (minority-to-majority class ratio) for subsampling effects, and attribute representation balance $g$ (minority-to-majority subgroup ratio) together with equalized-odds difference for fairness effects. The proposed remedy, DValCards, is a documentation template with six sections — Introduction, System Flowchart, DVal Candidate Data, DVal Method, DVal Report, and Ethical Statement and Recommendations — recording where valuation sits in the data or model lifecycle, the exact preprocessing and metric choices, the resulting value distribution and the included and excluded instances, and the intended use plus ethical and legal scope.
What would settle it
Re-run the protocol on a non-tabular task with a deep model: compute TMC-Shapley values on a fixed image or text training set under two different preprocessing or augmentation pipelines, measure Kendall's $\tau$ between the two value rankings, and track class balance after removing the lowest-valued 20%. If the rankings stay in close agreement ($\tau$ near 1) and the minority class is not depleted, the claim that such instability and bias are inherent properties of data valuation metrics would be contradicted. A cheaper check in the paper's own setting: find any combination in the 9-dataset, 12-imputation grid where all valuation metrics agree closely on the identity of the highest- and lowest-valued points.
Extended reading notes
Core claim
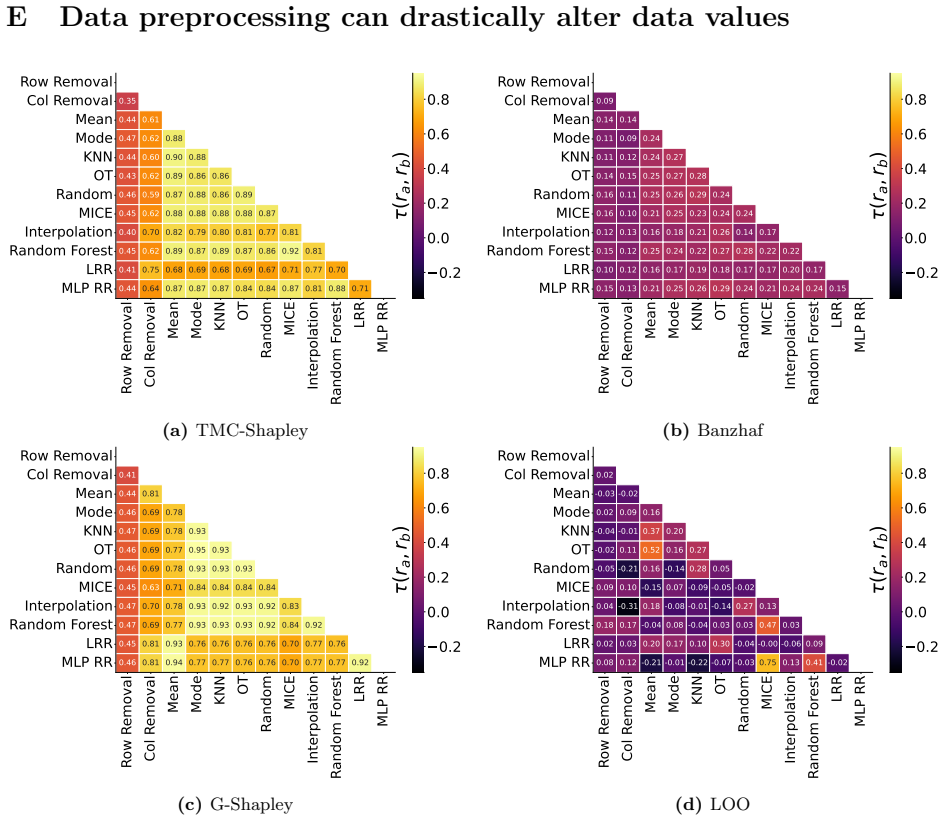
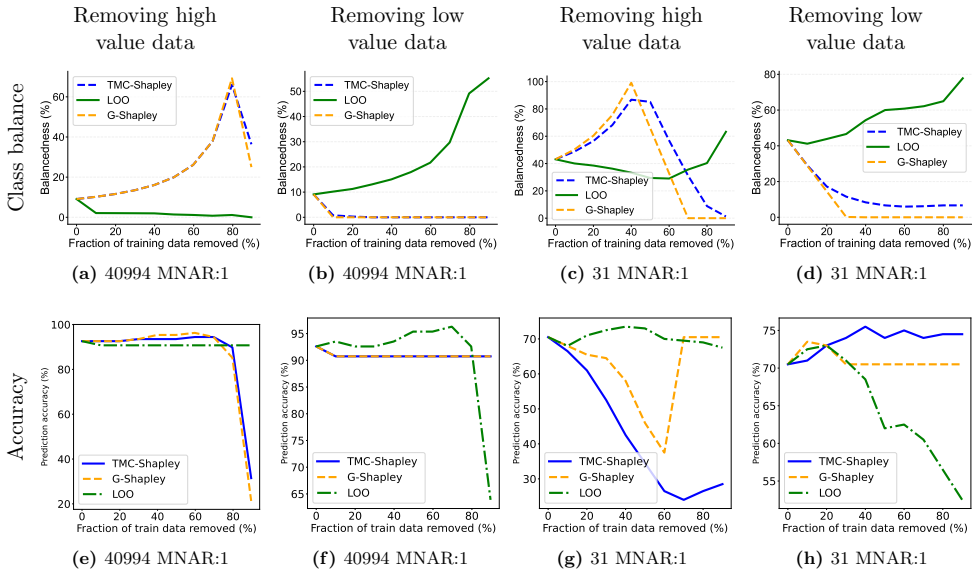
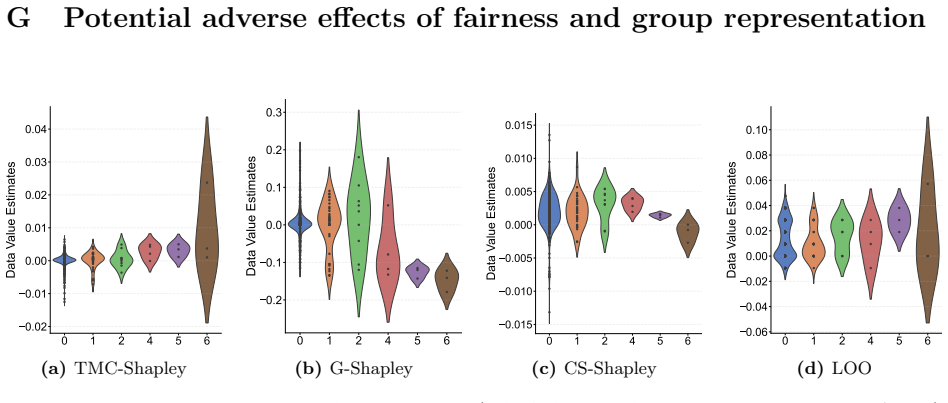
On the paper's own terms, the discovery is that data valuation metrics are inherently biased and unstable under simple algorithmic design choices. Three case studies support this. First, with model, data, and utility function held fixed, swapping the imputation method used to repair induced missingness produces statistically significant changes in data-value ranks: Kendall's $\tau$ is consistently below 1 with $p < 0.05$ across TMC-Shapley, G-Shapley, LOO, and Banzhaf, and the overlap between high-value subsets selected under different imputation methods is often small. Second, removing the lowest-valued data with TMC-Shapley or G-Shapley tends to draw from the minority class and worsens class balance on most datasets, whereas CS-Shapley, which separates in-class from out-of-class contribution, shows a different pattern. Third, value distributions vary by attribute group, with underrepresented groups frequently receiving lower values, so value-based subsampling can selectively remove their data; subsampling also usually fails to improve equalized-odds fairness. The paper concludes that naive use of LOO and Shapley-based metrics for equitable data pricing is unsuitable, and proposes DValCards as a transparency framework for data valuation in the wild.
Load-bearing premise
The experimental protocol assumes that deliberately inducing missingness in nine originally complete tabular datasets and repairing it with twelve imputation methods faithfully represents the preprocessing pipelines and data regimes where data valuation is used in practice, and that what holds for logistic regression (plus kNN for FairShap) also holds for other model classes and data types.
Editorial extensions
If this is right
- Data values cannot be compared across preprocessing pipelines: the same point's value and rank change meaningfully under a different imputation method, so cleaning, acquisition, and pricing decisions based on a single valuation run are not reproducible.
- Value-based data cleaning can increase class imbalance: when low-valued data is removed, TMC-Shapley and G-Shapley tend to pull from the minority class, worsening class balance on most of the datasets studied, while removing high-valued data shows the opposite tendency.
- Data valuation can systematically undervalue underrepresented groups, so value-based cleaning and pricing risk selectively discarding, or underpaying for, data associated with marginalized groups.
- Naive use of LOO or Shapley-based metrics as a data-pricing scheme is unsuitable, because preprocessing choices alone shift the resulting values and a buyer who controls the pipeline could in principle manipulate them.
- The DValCards framework gives a documentation standard that reports intended use, design choices, performance, and ethical considerations, which the paper argues is necessary for responsible deployment of data valuation in practice.
Reading between the lines
- The instability mechanism likely extends beyond imputation: any transformation that alters the training set — feature scaling, encoding choices, resampling, augmentation, even random seeds — changes the marginal contributions that define these valuation metrics. A natural extension is a stability report that lists value ranks under several preprocessing trajectories, which the DValCards system-flo
- The undervaluation of underrepresented groups suggests a possible feedback loop: if value-based cleaning repeatedly drops minority-class points, the model sees less minority data, potentially depressing the measured value of remaining minority points further. Testing whether successive rounds of value-based cleaning amplify the bias would be a direct follow-up.
- The evidence is tabular and logistic-regression based; if the bias and instability patterns reproduce under deep learning with augmentation pipelines, the argument for contractual transparency — for example, requiring DValCards in data-market transactions — would be considerably stronger than the current experiments alone support.
Editorial analysis
A structured set of objections, weighed in public.
Referee Report
Summary. This paper argues that data valuation metrics are unstable and biased under simple algorithmic design choices, based on three empirical case studies using nine tabular OpenML-CC18 datasets. The first case study shows that data values and value-based rankings vary across twelve imputation methods. The second shows that value-based data subsampling can alter class balance, sometimes worsening it. The third presents evidence that data values can differ across attribute groups, with potential consequences for underrepresented groups. On this basis, the paper proposes DValCards, a transparency documentation framework for reporting the context, method, results, and ethical considerations of data valuation in practice.
Significance. If the empirical patterns hold, the paper would provide a useful cautionary case study for data-centric ML, especially for proposed data-market pricing schemes and value-based data cleaning. The experimental grid is extensive in its coverage of imputation methods, missingness patterns, and valuation metrics, and the paper is honest about several limitations in Section 5. The DValCards proposal is a reasonable transparency artifact, though it is a template rather than a validated standard. The main weakness is that the abstract's word 'inherently' overstates the generality of findings that come from one tabular classification setting and one main learning algorithm. The paper's contribution is best read as a case for transparency in specific evaluated settings, not as a proof of inherent properties of all data valuation metrics.
major comments (4)
- [Abstract and Section 5] The abstract and Section 1 claim that data valuation metrics are 'inherently biased and unstable under simple algorithmic design choices,' but the evidence is restricted to nine tabular OpenML-CC18 datasets, logistic regression as the main learner (kNN only for FairShap), and imputation as the only preprocessing family. Section 5 explicitly concedes: 'we do not extend beyond the tabular supervised classification domain nor explore preprocessing methods beyond imputation.' This concession is load-bearing: the universal wording in the abstract and introduction is not supported by the experimental slice, and the central motivation for DValCards as a general transparency standard would be weakened if the observed instability and bias are artifacts of this slice. Please soften the claims to 'in our evaluated settings' or add experiments covering other model classes and preprocessing regimes.
- [Section 3.1 and Appendix C.3] The instability claim is not accompanied by any variance or repetition analysis for the stochastic valuation estimators. TMC-Shapley and G-Shapley are Monte Carlo methods, yet the paper does not report seeds, repeated runs, or confidence intervals for data values or for the Kendall's tau coefficients used in Figure 10. Without this information, the observed rank changes could partly reflect estimator noise rather than the effect of imputation choice. Because the central claim is about instability, this omission is load-bearing. Please report variance across random seeds or otherwise quantify estimator uncertainty for the stochastic valuation methods.
- [Section 3.3 and Appendix G] The ethical-impact narrative relies on post hoc selected examples, while the systematic tables in Appendix G show mixed and condition-dependent outcomes. For example, Tables 5 and 6 indicate that subsampling typically does not improve EOD fairness, but attribute representation balance can improve for age range in some conditions (Table 8b). The text sometimes uses appropriately hedged language such as 'may undervalue,' but the section framing should more explicitly state the frequency and conditions under which undervaluation occurs, and should avoid implying a universal tendency from selected datasets and attributes. This is important because the data-market pricing argument in Section 3.4 depends on the strength of this empirical pattern.
- [Footnote 2] The reproducibility footnote states that code and the DValCard template are 'available at: link,' which is a placeholder rather than an actual URL or DOI. Since the paper's empirical results and proposed template are central contributions, the missing link prevents verification and reuse. Please provide a working repository or permanent identifier, and ensure the included code covers the experimental pipeline and template.
minor comments (5)
- [Appendix D] The condition numbering in Appendix D is inconsistent: D.1 defines Condition-2Atech_j for maximum data value, but the corresponding equation is labeled Condition-1Btech_j, and D.2 then reuses the names Condition-2A and Condition-2B for class-balance definitions. Please renumber to avoid ambiguity.
- [Figure 1a] The caption states that the selected data points span '5 quintiles,' while the text in Section 3.1 says 'quartiles.' Please make these consistent.
- [Appendix C.3] The text says CS-Shapley was computed for datasets 18, 23, 31, and 1680, but the dataset list in Table 1 shows 1480 (Indian liver patient) rather than 1680. This appears to be a typo.
- [Figure 13 caption] The caption lists the missingness conditions as 'MAR:1, MNAR:1 and MNAR:1,' which likely should include MCAR. Please correct the caption.
- [Section 3.4] The phrase 'assigning data values apriori' should be 'a priori' with standard spacing.
Circularity Check
No circularity: all empirical results are measured against public OpenML-CC18 datasets, and the proposed DValCards framework does not enter the measurement loop.
full rationale
The paper's derivation chain is empirical rather than definitional. The data valuation metrics (LOO, TMC-Shapley, G-Shapley, Banzhaf, CS-Shapley, FairShap) are standard methods defined in prior external literature (e.g., Ghorbani and Zou 2019, Wang and Jia 2023, Schoch et al. 2022, Arnaiz-Rodriguez and Oliver 2023) and are implemented as published. The experimental protocol induces missingness on public OpenML-CC18 tabular datasets, repairs it with 12 imputation methods, computes data values, and measures instability via Kendall's tau, class balance, attribute balance, and equalized odds difference. No fitted parameter is renamed as a prediction, and no equation in the paper reduces to its own inputs by construction. The central claims about instability, class-imbalance effects, and undervaluation of underrepresented groups are direct measurements on public data, not outputs of a model fitted to those same measurements. The DValCards framework is a transparency artifact proposed after the empirical findings; it does not feed back into the experiments or serve as evidence for the findings. The paper's own Limitations section concedes that the experiments do not extend beyond tabular supervised classification or beyond imputation as preprocessing; this is a scope limitation relevant to correctness and generalizability, but it is not circularity. The only self-referential element is the illustrative DValCard example noting that it was 'Developed by the paper authors,' which is not load-bearing for any technical claim. No self-citation chain is used to justify the central empirical results. Therefore the paper contains no significant circularity.
Assumptions & free parameters
free parameters (5)
- missingness_percentage =
1%, 10%, 30%
- subsampling_keep_ratio =
80%
- class_balance_threshold =
0.25
- logistic_regression_hyperparameters =
varied, unspecified
- knn_k_value =
varied, unspecified
assumptions (4)
- domain assumption The Rubin MCAR/MAR/MNAR taxonomy describes real-world missingness mechanisms adequately for this study.
- domain assumption Data value as marginal contribution to validation accuracy of a logistic regression model captures what practitioners mean by data value.
- domain assumption The 9 selected OpenML-CC18 datasets represent real-world tabular classification use cases for data valuation.
- domain assumption Inducing missingness on originally complete datasets and imputing is a valid proxy for observing data that already has missing values.
invented entities (1)
-
DValCards
Cite this review
Pith. "Pith review of A case for data valuation transparency via DValCards." pith.science (2026). https://pith.science/paper/YV3K7IBL
@misc{pith2026250623349,
  author       = {Pith},
  title        = {Pith review of: A case for data valuation transparency via DValCards},
  year         = {2026},
  howpublished = {\url{https://pith.science/paper/YV3K7IBL}},
  note         = {Machine review of arXiv:2506.23349}
}
read the original abstract
Following the rise in popularity of data-centric machine learning (ML), various data valuation methods have been proposed to quantify the contribution of each datapoint to desired ML model performance metrics (e.g., accuracy). Beyond the technical applications of data valuation methods (e.g., data cleaning, data acquisition, etc.), it has been suggested that within the context of data markets, data buyers might utilize such methods to fairly compensate data owners. Here we demonstrate that data valuation metrics are inherently biased and unstable under simple algorithmic design choices, resulting in both technical and ethical implications. By analyzing 9 tabular classification datasets and 6 data valuation methods, we illustrate how (1) common and inexpensive data pre-processing techniques can drastically alter estimated data values; (2) subsampling via data valuation metrics may increase class imbalance; and (3) data valuation metrics may undervalue underrepresented group data. Consequently, we argue in favor of increased transparency associated with data valuation in-the-wild and introduce the novel Data Valuation Cards (DValCards) framework towards this aim. The proliferation of DValCards will reduce misuse of data valuation metrics, including in data pricing, and build trust in responsible ML systems.
Figures


Figures from the paper (20 more)






Reference graph
Works this paper leans on
-
[1]
Null player: If for all S ⊆ D, V(S) = V(S ∪ {zi}), then ϕshapley(zi) = 0
-
[2]
Efficiency: X zi∈D ϕshapley(zi) = V(D)
-
[3]
Symmetry: If i and j are such that V(S ∪{zi}) = V(S ∪{zj}), then ϕshapley(zi) = ϕshapley(zj)
-
[4]
Additionally, ϕshapley(zi, V1 + V2) = ϕshapley(zi, V1) + ϕshapley(zi, V2)
Linearity: For any 2 utility functions V1 and V2, and α1, α2 ∈ R , ϕshapley(zi, α1V1 + α2V2) = α1ϕshapley(zi, V1) + α2ϕshapley(zi, V2). Additionally, ϕshapley(zi, V1 + V2) = ϕshapley(zi, V1) + ϕshapley(zi, V2). Despite these properties, the true Shapley value is computationally complex; it is exponential in the number of data points. TMC-Shapley and G-Sha...
work page 2019
-
[5]
mice: Multivariate Imputation by Chained Equations in R
3, 4, 22 Stef Van Buuren and Karin Groothuis-Oudshoorn. mice: Multivariate Imputation by Chained Equations in R. Journal of Statistical Software , 45(3):1–67, 2011. 4, 22 Guilin Huang. Missing data filling method based on linear interpolation and lightgbm. In Journal of Physics Conference Series, volume 1754 of Journal of Physics Conference Series , page ...
arXiv 2011
-
[6]
Ethical Statement and Recommendations.This section explores the broader implications of the data valuation process, addressing ethical, legal, and environmental considerations. It also outlines intended use cases, acknowledges limitations, and offers recommendations for responsible application. This analysis is particularly important for understanding the...
-
[11]
Introduction. The introduction section of the DValCard provides general information about the DValCard, including the names and contact details of its developer(s), the card ver- sion number, and the date of creation. This context facilitates traceability, version control, transparency, and accountability
-
[12]
System Flowchart. The system flowchart contextualizes data valuation within the model lifecycle, data lifecycle, or algorithmic measures such as data pricing. This visual representa- tion illustrates where data valuation occurs. Depending on the use case, data valuation may be part of data preprocessing, cleaning, or curation, or it may be conducted indep...
Show all 16 references
-
[13]
DV al Candidate Data.The DVal candidate data refers to the dataset whose value is to be assessed by the data valuation method. Since data may originate from various sources and undergo different preprocessing steps, it is critical to document its provenance and preparation to ...
2021
-
[14]
DV al Method.This section of the DValCard provides crucial information regarding the pri- mary data valuation technique(s) and their usage. It contains a description of the method(s), including strengths, shortcomings, and characteristics, e.g., runtime and space complexity, a...
2021
-
[15]
The DVal report includes a comprehensive analysis of both qualitative and quantitative aspects of raw or relative data values for a specific task or application
DV al Report. The DVal report includes a comprehensive analysis of both qualitative and quantitative aspects of raw or relative data values for a specific task or application. This analysis comprises the distributional analysis of data values, as well as an examination of how ...
-
[37]
conditions
CS-Shapley was computed for datasets 18 , 23, 31, and 1680, each under missingness condition MNAR:30 and on dataset 40994 for all kinds of missingness. FairShap data values were computed for datasets 31 and 1480 for all kinds of missingness. Experiments were conducted using a ...
2000
-
[1462]
1 Emily Black and Matt Fredrikson
IEEE, 2022. 1 Emily Black and Matt Fredrikson. Leave-one-out Unfairness. In Proceedings of the 2021 ACM Conference on Fairness, Accountability, and Transparency, F AccT ’21, page 285–295, New York, NY, USA, 2021. Association for Computing Machinery. 1 Zhihua Tian, Jian Liu, Ji...
2022 arXiv
-
[2020]
Gtg-shapley: Efficient and accu- rate participant contribution evaluation in federated learning
2 15 Zelei Liu, Yuanyuan Chen, Han Yu, Yang Liu, and Lizhen Cui. Gtg-shapley: Efficient and accu- rate participant contribution evaluation in federated learning. ACM Transactions on Intelligent Systems and Technology (TIST) , 13(4):1–21, 2022. 2 Tianshu Song, Yongxin Tong, and...
2022 arXiv
-
[2021]
Who’s Responsible? Jointly Quantifying the Contri- bution of the Learning Algorithm and Data
2 Gal Yona, Amirata Ghorbani, and James Zou. Who’s Responsible? Jointly Quantifying the Contri- bution of the Learning Algorithm and Data. In Proceedings of the 2021 AAAI/ACM Conference on AI, Ethics, and Society , AIES ’21, page 1034–1041, New York, NY, USA, 2021. Association...
2021
-
[2022]
A distributional framework for data valuation
2, 4, 11, 20 Amirata Ghorbani, Michael Kim, and James Zou. A distributional framework for data valuation. In International Conference on Machine Learning , pages 3535–3544. PMLR, 2020. 2 Jiachen T. Wang, Tianji Yang, James Zou, Yongchan Kwon, and Ruoxi Jia. Rethinking data sha...
2020 arXiv
Reviewed August 6, 2026 · model on record in the stance chip above.
Discussion (0). Sign in to comment.