pith. sign in

arxiv: 2605.00817 · v3 · pith:YVLLQUFLnew · submitted 2026-05-01 · 💻 cs.CL

When LLMs Stop Following Steps: A Diagnostic Study of Procedural Execution in Language Models

Pith reviewed 2026-05-22 10:00 UTC · model grok-4.3

classification 💻 cs.CL
keywords large language modelsprocedural executioninstruction followingreasoning benchmarksarithmetic proceduresdiagnostic studystep-by-step fidelitymodel failures
0
0 comments X

The pith

Large language models lose accuracy on long step-by-step procedures, dropping from 61 percent to 20 percent.

A machine-rendered reading of the paper's core claim, the machinery that carries it, and where it could break.

The paper tests whether strong performance on reasoning benchmarks means models actually carry out the exact sequence of steps given in a prompt. It introduces a benchmark of arithmetic algorithms that grow from five to ninety-five steps while adding dependencies that require looking back at earlier results. Across fourteen models and fifty-five datasets, first-answer accuracy falls sharply with length. Failures show up as skipped steps, early answers, self-corrections, incomplete traces, and invented extra operations. Readers should care because correct final answers can hide that models are not reliably doing what the instructions say.

Core claim

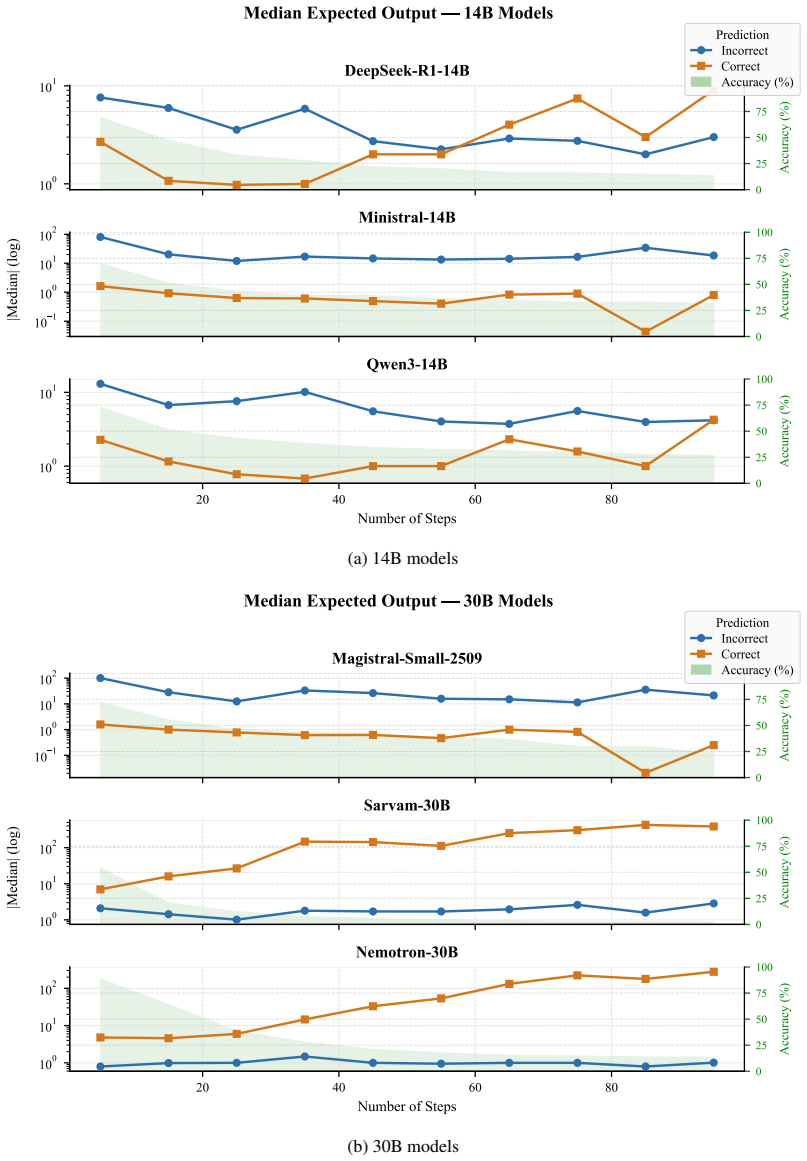
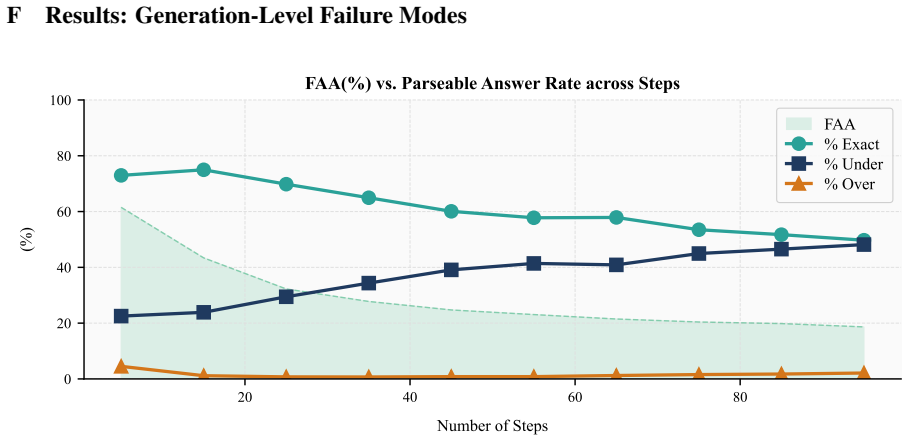
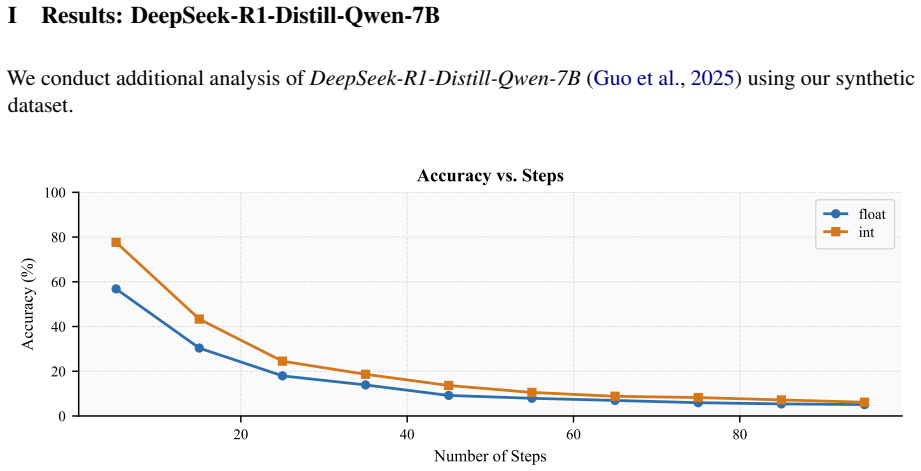
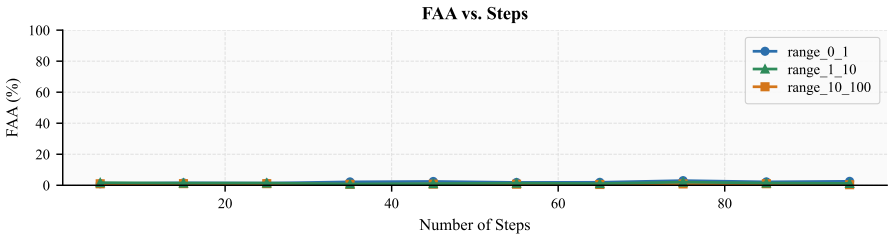
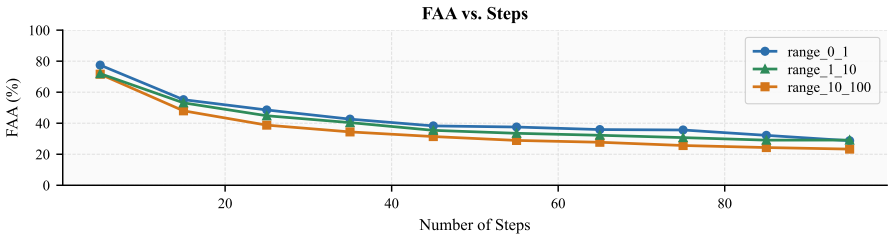
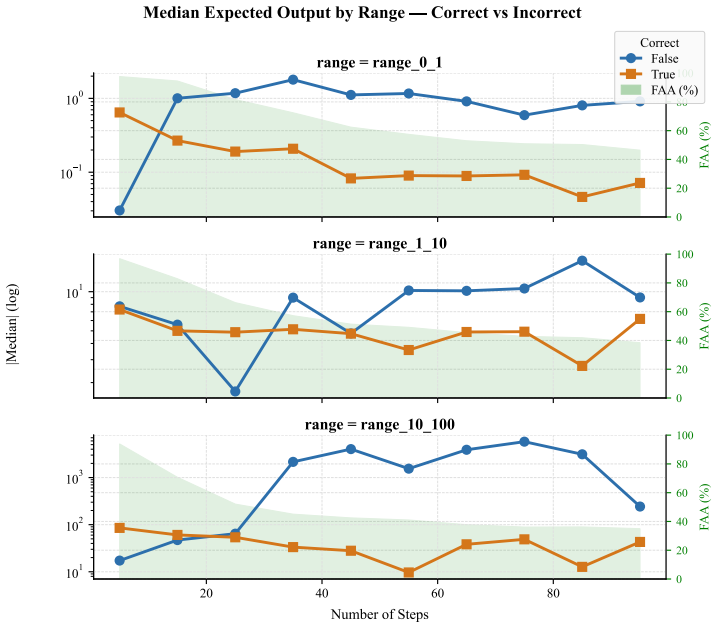
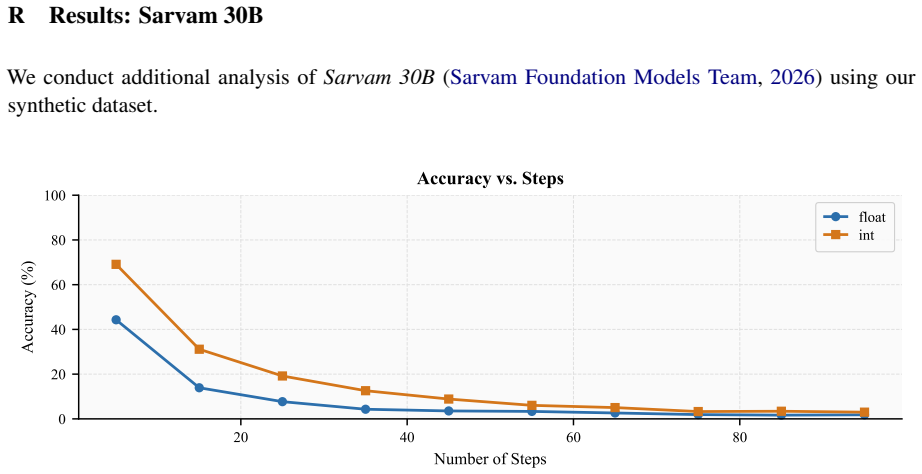
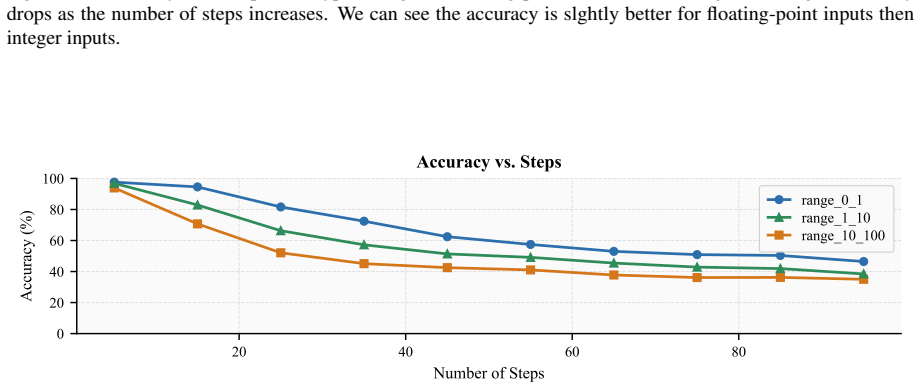
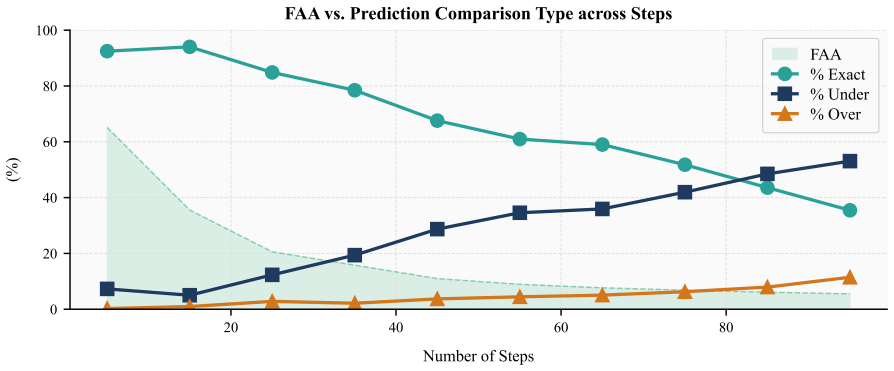
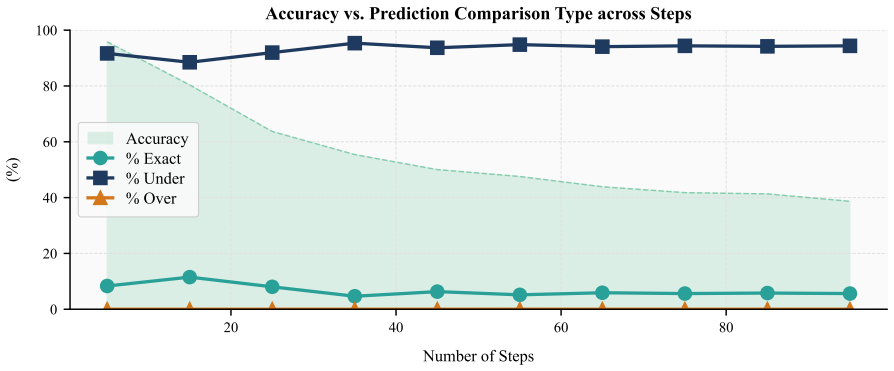
When models receive a step-wise arithmetic algorithm and two numeric inputs, they must return the final value, yet first-answer accuracy declines from 61 percent on five-step procedures to 20 percent on ninety-five-step procedures, and generation analysis reveals frequent missing answers, premature answers, self-corrections after errors, under-executed traces, and hallucinated extra steps.

What carries the argument

A diagnostic benchmark of controlled arithmetic procedures whose length and look-back dependencies over intermediate variables are varied while keeping the underlying operations simple.

If this is right

  • Final-answer correctness on reasoning benchmarks does not confirm that models have executed the specified procedure.
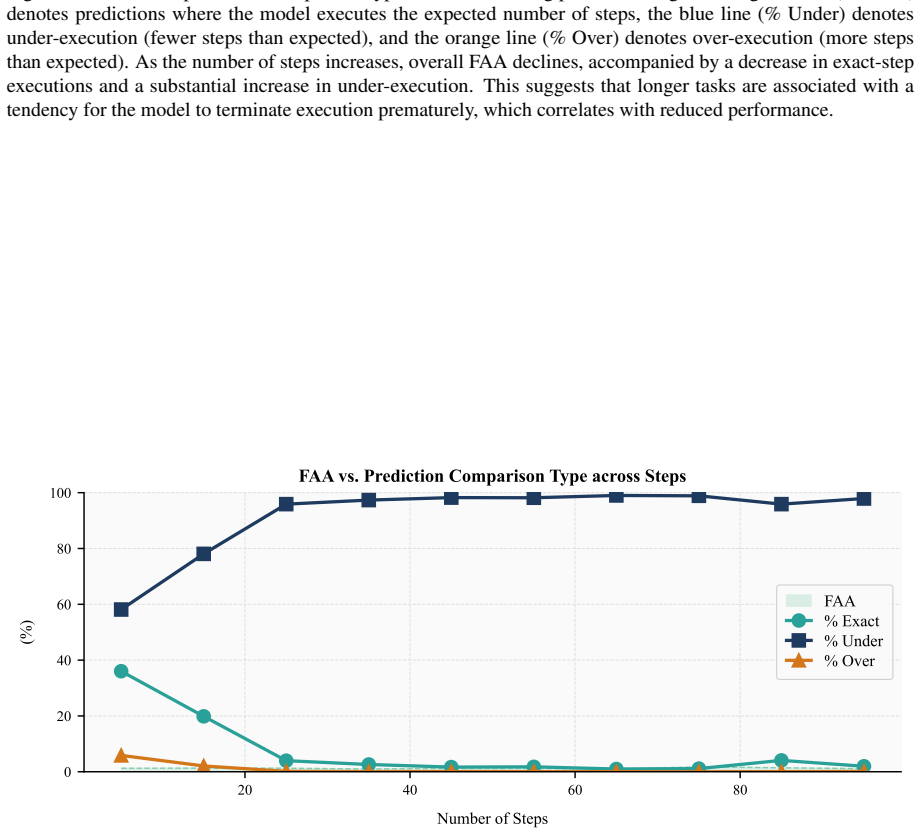
  • Common errors include missing the answer, answering before all steps finish, correcting an earlier mistake, stopping early, or adding steps absent from the prompt.
  • Weaknesses in procedural execution appear even when the arithmetic itself remains elementary.
  • Increasing both the number of steps and the number of required look-backs makes execution failures easier to observe.

Where Pith is reading between the lines

These are editorial extensions of the paper, not claims the author makes directly.

  • Prompting or training methods that reward only the final answer may leave step-by-step fidelity untouched.
  • Tasks that demand strict adherence to a protocol, such as following a scientific protocol or generating code from a detailed spec, may be more fragile than benchmark scores suggest.
  • Evaluations that score intermediate traces separately from the end result could expose reliability limits that final-answer metrics miss.

Load-bearing premise

The arithmetic procedures are built so that any performance drop must come from failing to follow the steps rather than from limits in arithmetic skill or prompt understanding.

What would settle it

Finding a model that sustains above 50 percent accuracy on the longest procedures while producing complete and correct traces of every intermediate variable would contradict the reported decline.

Figures

Figures reproduced from arXiv: 2605.00817 by Abhishek Upperwal, Mayank Singh, Pritam Kadasi, Sailesh Panda.

Figure 1
Figure 1. Figure 1: Accuracy of various language models as a function of algorithmic step count (5–95). Performance view at source ↗
Figure 1
Figure 1. Figure 1: Representative step-wise arithmetic procedure. [PITH_FULL_IMAGE:figures/full_fig_p003_1.png] view at source ↗
Figure 2
Figure 2. Figure 2: Accuracy (%) of language models under varying look-back dependencies (1–7). As the required look-back view at source ↗
Figure 2
Figure 2. Figure 2: FAA of various language models as a function of Procedure step count (5–95). Performance consistently [PITH_FULL_IMAGE:figures/full_fig_p006_2.png] view at source ↗
Figure 3
Figure 3. Figure 3: Accuracy and execution behavior across increasing algorithm lengths. While exact-match accuracy view at source ↗
Figure 3
Figure 3. Figure 3: Relative FAA degradation (%) with increasing [PITH_FULL_IMAGE:figures/full_fig_p006_3.png] view at source ↗
Figure 4
Figure 4. Figure 4: Median expected output across steps for integer and floating-point inputs, separated by correct and view at source ↗
Figure 4
Figure 4. Figure 4: FAA across input ranges as a function of [PITH_FULL_IMAGE:figures/full_fig_p007_4.png] view at source ↗
Figure 5
Figure 5. Figure 5: Median expected output across steps for different input ranges ([0,1], [1,10], [10,100]). Output magnitude view at source ↗
Figure 6
Figure 6. Figure 6: Algorithm used to evaluate step-wise arithmetic procedures and compute deterministic reference outputs. [PITH_FULL_IMAGE:figures/full_fig_p013_6.png] view at source ↗
Figure 6
Figure 6. Figure 6: Median expected output across steps for different task types (addition, subtraction, multiplication, division, view at source ↗
Figure 7
Figure 7. Figure 7: Inference prompt used for procedural execution experiments. [PITH_FULL_IMAGE:figures/full_fig_p014_7.png] view at source ↗
Figure 7
Figure 7. Figure 7: Median expected output across steps for small ( view at source ↗
Figure 8
Figure 8. Figure 8: Median expected output across steps for different input ranges ([0,1], [1,10], [10,100]) separated by [PITH_FULL_IMAGE:figures/full_fig_p015_8.png] view at source ↗
Figure 8
Figure 8. Figure 8: Median expected output across steps for Mid range models (14B, 30B). While some models show view at source ↗
Figure 9
Figure 9. Figure 9: Median expected output across steps for integer and floating-point inputs, separated by correct and [PITH_FULL_IMAGE:figures/full_fig_p015_9.png] view at source ↗
Figure 9
Figure 9. Figure 9: Median expected output across steps for larger models ( view at source ↗
Figure 10
Figure 10. Figure 10: Accuracy across input ranges as a function of algorithm length. All ranges show a consistent decline view at source ↗
Figure 11
Figure 11. Figure 11: Accuracy across input data types (integer vs. floating-point) as a function of algorithm length. Both data view at source ↗
Figure 12
Figure 12. Figure 12: Median expected output across steps for Mid range models (14B, 30B). While some models show [PITH_FULL_IMAGE:figures/full_fig_p019_12.png] view at source ↗
Figure 12
Figure 12. Figure 12: Accuracy heatmap across models and input ranges. Performance varies across models, with no uniform view at source ↗
Figure 13
Figure 13. Figure 13: Median expected output across steps for larger models ( [PITH_FULL_IMAGE:figures/full_fig_p020_13.png] view at source ↗
Figure 13
Figure 13. Figure 13: Accuracy heatmap across models and task types. Addition and subtraction tasks generally yield higher view at source ↗
Figure 14
Figure 14. Figure 14: Comparison of FAA and CAA across models. [PITH_FULL_IMAGE:figures/full_fig_p020_14.png] view at source ↗
Figure 14
Figure 14. Figure 14: Coverage (non-null answer rate) across increasing step counts. While many models maintain high view at source ↗
Figure 15
Figure 15. Figure 15: FAA heatmap across models and input ranges. Performance varies across models, with no uniform [PITH_FULL_IMAGE:figures/full_fig_p021_15.png] view at source ↗
Figure 15
Figure 15. Figure 15: Distribution of the normalized position of the first generated answer across models. Models vary in view at source ↗
Figure 16
Figure 16. Figure 16: FAA and execution behavior across increasing algorithm lengths. While exact-match FAA (dashed) [PITH_FULL_IMAGE:figures/full_fig_p022_16.png] view at source ↗
Figure 16
Figure 16. Figure 16: Accuracy across input data types (integer vs. floating-point) as a function of algorithm length. Accuracy view at source ↗
Figure 17
Figure 17. Figure 17: Coverage (non-null answer rate) across increasing step counts. While many models maintain high [PITH_FULL_IMAGE:figures/full_fig_p022_17.png] view at source ↗
Figure 17
Figure 17. Figure 17: Accuracy across input ranges as a function of algorithm length. Performance degrades rapidly with view at source ↗
Figure 18
Figure 18. Figure 18: Distribution of the normalized position of the first generated answer across models. Models vary in [PITH_FULL_IMAGE:figures/full_fig_p023_18.png] view at source ↗
Figure 18
Figure 18. Figure 18: Accuracy across task types. The model achieves higher accuracy on addition (10.8%) and subtraction view at source ↗
Figure 19
Figure 19. Figure 19: FAA as a function of procedure length for integer and floating-point input settings. FAA drops sharply as [PITH_FULL_IMAGE:figures/full_fig_p024_19.png] view at source ↗
Figure 19
Figure 19. Figure 19: Median expected output across steps for integer and floating-point inputs, separated by correct and view at source ↗
Figure 20
Figure 20. Figure 20: FAA as a function of procedure length for integer and floating-point input settings. FAA drops as the [PITH_FULL_IMAGE:figures/full_fig_p024_20.png] view at source ↗
Figure 20
Figure 20. Figure 20: Median expected output across steps for different input ranges ([0,1], [1,10], [10,100]), separated view at source ↗
Figure 21
Figure 21. Figure 21: FAA as a function of procedure length for integer and floating-point input settings. FAA drops as the [PITH_FULL_IMAGE:figures/full_fig_p024_21.png] view at source ↗
Figure 21
Figure 21. Figure 21: Median expected output across steps for different task types (addition, subtraction, multiplication, view at source ↗
Figure 22
Figure 22. Figure 22: FAA as a function of procedure length for integer and floating-point input settings. FAA remains [PITH_FULL_IMAGE:figures/full_fig_p025_22.png] view at source ↗
Figure 22
Figure 22. Figure 22: Accuracy and prediction comparison types across increasing algorithm lengths. The green line (% view at source ↗
Figure 23
Figure 23. Figure 23: Accuracy across input data types (integer vs. floating-point) as a function of algorithm length. Accuracy view at source ↗
Figure 24
Figure 24. Figure 24: Accuracy across input ranges as a function of algorithm length. Performance degrades with increasing view at source ↗
Figure 25
Figure 25. Figure 25: FAA as a function of procedure length for integer and floating-point input settings. FAA drops as the [PITH_FULL_IMAGE:figures/full_fig_p026_25.png] view at source ↗
Figure 25
Figure 25. Figure 25: Accuracy across task types. The model achieves higher accuracy on addition (85.5%) and subtraction view at source ↗
Figure 26
Figure 26. Figure 26: Median expected output across steps for integer and floating-point inputs, separated by correct and view at source ↗
Figure 27
Figure 27. Figure 27: Median expected output across steps for different input ranges ([0,1], [1,10], [10,100]), separated view at source ↗
Figure 28
Figure 28. Figure 28: Median expected output across steps for different task types (addition, subtraction, multiplication, division, view at source ↗
Figure 29
Figure 29. Figure 29: FAA as a function of procedure length for integer and floating-point input settings. FAA drops as the [PITH_FULL_IMAGE:figures/full_fig_p027_29.png] view at source ↗
Figure 29
Figure 29. Figure 29: Accuracy and prediction comparison types across increasing algorithm lengths. The green line (% view at source ↗
Figure 30
Figure 30. Figure 30: FAA as a function of procedure length for integer and floating-point input settings. FAA drops as the [PITH_FULL_IMAGE:figures/full_fig_p027_30.png] view at source ↗
Figure 30
Figure 30. Figure 30: Accuracy across input data types (integer vs. floating-point) as a function of algorithm length. Accuracy view at source ↗
Figure 31
Figure 31. Figure 31: FAA as a function of procedure length for integer and floating-point input settings. FAA drops as the [PITH_FULL_IMAGE:figures/full_fig_p028_31.png] view at source ↗
Figure 31
Figure 31. Figure 31: Accuracy across input ranges as a function of algorithm length. Performance degrades with increasing view at source ↗
Figure 32
Figure 32. Figure 32: FAA as a function of procedure length for integer and floating-point input settings. FAA drops as the [PITH_FULL_IMAGE:figures/full_fig_p028_32.png] view at source ↗
Figure 32
Figure 32. Figure 32: Accuracy across task types. The model achieves higher accuracy on addition (65.3%) compared to view at source ↗
Figure 33
Figure 33. Figure 33: FAA across procedure lengths for different input ranges. Performance degrades rapidly with increasing [PITH_FULL_IMAGE:figures/full_fig_p029_33.png] view at source ↗
Figure 33
Figure 33. Figure 33: Median expected output across steps for integer and floating-point inputs, separated by correct and view at source ↗
Figure 34
Figure 34. Figure 34: FAA across procedure lengths for different input ranges. Performance degrades with increasing steps [PITH_FULL_IMAGE:figures/full_fig_p029_34.png] view at source ↗
Figure 34
Figure 34. Figure 34: Median expected output across steps for different input ranges ([0,1], [1,10], [10,100]), separated by view at source ↗
Figure 35
Figure 35. Figure 35: FAA across procedure lengths for different input ranges. Performance degrades with increasing steps [PITH_FULL_IMAGE:figures/full_fig_p029_35.png] view at source ↗
Figure 35
Figure 35. Figure 35: Median expected output across steps for different task types (addition, subtraction, multiplication, division, view at source ↗
Figure 36
Figure 36. Figure 36: FAA across procedure lengths for different input ranges. Performance remains uniformly low across all [PITH_FULL_IMAGE:figures/full_fig_p030_36.png] view at source ↗
Figure 36
Figure 36. Figure 36: Accuracy and prediction comparison types across increasing algorithm lengths. The green line (% view at source ↗
Figure 37
Figure 37. Figure 37: FAA across procedure lengths for different input ranges. Performance remains uniformly low across all [PITH_FULL_IMAGE:figures/full_fig_p030_37.png] view at source ↗
Figure 37
Figure 37. Figure 37: Accuracy across input data types (integer vs. floating-point) as a function of algorithm length. Accuracy view at source ↗
Figure 38
Figure 38. Figure 38: FAA across procedure lengths for different input ranges. Performance declines with increasing step [PITH_FULL_IMAGE:figures/full_fig_p030_38.png] view at source ↗
Figure 38
Figure 38. Figure 38: Accuracy across input ranges as a function of algorithm length. Performance remains uniformly low view at source ↗
Figure 39
Figure 39. Figure 39: FAA across procedure lengths for different input ranges. Performance declines with increasing step [PITH_FULL_IMAGE:figures/full_fig_p031_39.png] view at source ↗
Figure 39
Figure 39. Figure 39: Accuracy across task types. The model achieves uniformly low accuracy across all tasks, with only view at source ↗
Figure 40
Figure 40. Figure 40: FAA across procedure lengths for different input ranges. Performance declines with increasing step [PITH_FULL_IMAGE:figures/full_fig_p031_40.png] view at source ↗
Figure 40
Figure 40. Figure 40: Median expected output across steps for integer and floating-point inputs, separated by correct and view at source ↗
Figure 41
Figure 41. Figure 41: FAA across procedure lengths for different input ranges. Performance declines with increasing step [PITH_FULL_IMAGE:figures/full_fig_p031_41.png] view at source ↗
Figure 41
Figure 41. Figure 41: Median expected output across steps for different input ranges ([0,1], [1,10], [10,100]), separated by view at source ↗
Figure 42
Figure 42. Figure 42: FAA across procedure lengths for different input ranges. Performance declines with increasing step [PITH_FULL_IMAGE:figures/full_fig_p032_42.png] view at source ↗
Figure 42
Figure 42. Figure 42: Median expected output across steps for different task types (addition, subtraction, multiplication, division, view at source ↗
Figure 43
Figure 43. Figure 43: FAA across procedure lengths for different input ranges. Performance declines with increasing step [PITH_FULL_IMAGE:figures/full_fig_p032_43.png] view at source ↗
Figure 43
Figure 43. Figure 43: Accuracy and prediction comparison types across increasing algorithm lengths. The green line (% view at source ↗
Figure 44
Figure 44. Figure 44: FAA across procedure lengths for different input ranges. Performance declines with increasing step [PITH_FULL_IMAGE:figures/full_fig_p032_44.png] view at source ↗
Figure 44
Figure 44. Figure 44: Accuracy across input data types (integer vs. floating-point) as a function of algorithm length. Accuracy view at source ↗
Figure 45
Figure 45. Figure 45: FAA across procedure lengths for different input ranges. Performance declines with increasing step [PITH_FULL_IMAGE:figures/full_fig_p033_45.png] view at source ↗
Figure 45
Figure 45. Figure 45: Accuracy across input ranges as a function of algorithm length. Performance remains uniformly low view at source ↗
Figure 46
Figure 46. Figure 46: FAA across procedure lengths for different input ranges. Performance declines with increasing step [PITH_FULL_IMAGE:figures/full_fig_p033_46.png] view at source ↗
Figure 46
Figure 46. Figure 46: Accuracy across task types. The model achieves uniformly low accuracy across all tasks, with only view at source ↗
Figure 47
Figure 47. Figure 47: FAA (%) across arithmetic task variants as procedure length increases. We can se a sharp decline in FAA [PITH_FULL_IMAGE:figures/full_fig_p034_47.png] view at source ↗
Figure 47
Figure 47. Figure 47: Median expected output across steps for integer and floating-point inputs, separated by correct and view at source ↗
Figure 48
Figure 48. Figure 48: FAA (%) across arithmetic task variants as procedure length increases. We can see Model performed [PITH_FULL_IMAGE:figures/full_fig_p034_48.png] view at source ↗
Figure 48
Figure 48. Figure 48: Median expected output across steps for different input ranges ([0,1], [1,10], [10,100]), separated by view at source ↗
Figure 49
Figure 49. Figure 49: FAA (%) across arithmetic task variants as procedure length increases. Multiplication, Division, [PITH_FULL_IMAGE:figures/full_fig_p034_49.png] view at source ↗
Figure 49
Figure 49. Figure 49: Median expected output across steps for different task types (addition, subtraction, multiplication, division, view at source ↗
Figure 50
Figure 50. Figure 50: FAA (%) across arithmetic task variants as procedure length increases. The FAA values fluctuate [PITH_FULL_IMAGE:figures/full_fig_p035_50.png] view at source ↗
Figure 50
Figure 50. Figure 50: Accuracy and prediction comparison types across increasing algorithm lengths. The green line (% view at source ↗
Figure 51
Figure 51. Figure 51: FAA (%) across arithmetic task variants as procedure length increases. The FAA values fluctuate [PITH_FULL_IMAGE:figures/full_fig_p035_51.png] view at source ↗
Figure 51
Figure 51. Figure 51: Accuracy across input data types (integer vs. floating-point) as a function of algorithm length. Accuracy view at source ↗
Figure 52
Figure 52. Figure 52: FAA (%) across arithmetic task variants as procedure length increases. Multiplication, Division, and [PITH_FULL_IMAGE:figures/full_fig_p035_52.png] view at source ↗
Figure 52
Figure 52. Figure 52: Accuracy across input ranges as a function of algorithm length. Performance declines with increasing view at source ↗
Figure 53
Figure 53. Figure 53: FAA (%) across arithmetic task variants as procedure length increases. Multiplication, Division, and [PITH_FULL_IMAGE:figures/full_fig_p036_53.png] view at source ↗
Figure 53
Figure 53. Figure 53: Accuracy across task types. The model achieves higher accuracy on addition (91.1%) and subtraction view at source ↗
Figure 54
Figure 54. Figure 54: FAA (%) across arithmetic task variants as procedure length increases. Multiplication, Division, [PITH_FULL_IMAGE:figures/full_fig_p036_54.png] view at source ↗
Figure 54
Figure 54. Figure 54: Median expected output across steps for integer and floating-point inputs, separated by correct and view at source ↗
Figure 55
Figure 55. Figure 55: FAA (%) across arithmetic task variants as procedure length increases. Multiplication, Division, and [PITH_FULL_IMAGE:figures/full_fig_p036_55.png] view at source ↗
Figure 55
Figure 55. Figure 55: Median expected output across steps for different input ranges ([0,1], [1,10], [10,100]), separated by view at source ↗
Figure 56
Figure 56. Figure 56: FAA (%) across arithmetic task variants for Magistral-Small-2509. Multiplication, Division, and Mixed [PITH_FULL_IMAGE:figures/full_fig_p037_56.png] view at source ↗
Figure 56
Figure 56. Figure 56: Median expected output across steps for different task types (addition, subtraction, multiplication, division, view at source ↗
Figure 57
Figure 57. Figure 57: FAA (%) across arithmetic task variants as procedure length increases. Multiplication, Division, [PITH_FULL_IMAGE:figures/full_fig_p037_57.png] view at source ↗
Figure 57
Figure 57. Figure 57: Accuracy and prediction comparison types across increasing algorithm lengths. The green line (% view at source ↗
Figure 58
Figure 58. Figure 58: FAA (%) across arithmetic task variants for Sarvam-30B. Multiplication, Division, and Mixed tasks [PITH_FULL_IMAGE:figures/full_fig_p037_58.png] view at source ↗
Figure 58
Figure 58. Figure 58: Accuracy across input data types (integer vs. floating-point) as a function of algorithm length. Accuracy view at source ↗
Figure 59
Figure 59. Figure 59: FAA (%) across arithmetic task variants for Magistral-Small-2509. Multiplication, Division, and Mixed [PITH_FULL_IMAGE:figures/full_fig_p038_59.png] view at source ↗
Figure 59
Figure 59. Figure 59: Accuracy across input ranges as a function of algorithm length. Performance declines with increasing view at source ↗
Figure 60
Figure 60. Figure 60: FAA (%) across arithmetic task variants for Magistral-Small-2509. Multiplication, Division, and Mixed [PITH_FULL_IMAGE:figures/full_fig_p038_60.png] view at source ↗
Figure 60
Figure 60. Figure 60: Accuracy across task types. The model achieves higher accuracy on addition (88.9%) and subtraction view at source ↗
Figure 61
Figure 61. Figure 61: Median expected output across procedure lengths for integer and floating-point inputs, separated by [PITH_FULL_IMAGE:figures/full_fig_p039_61.png] view at source ↗
Figure 61
Figure 61. Figure 61: Median expected output across steps for integer and floating-point inputs, separated by correct and view at source ↗
Figure 62
Figure 62. Figure 62: Median expected output across procedure lengths for integer and floating-point inputs, separated by [PITH_FULL_IMAGE:figures/full_fig_p039_62.png] view at source ↗
Figure 62
Figure 62. Figure 62: Median expected output across steps for different input ranges ([0,1], [1,10], [10,100]), separated by view at source ↗
Figure 63
Figure 63. Figure 63: Median expected output across procedure lengths for integer and floating-point inputs, separated by [PITH_FULL_IMAGE:figures/full_fig_p040_63.png] view at source ↗
Figure 63
Figure 63. Figure 63: Median expected output across steps for different task types (addition, subtraction, multiplication, division, view at source ↗
Figure 64
Figure 64. Figure 64: Median expected output across procedure lengths for integer and floating-point inputs, separated by [PITH_FULL_IMAGE:figures/full_fig_p040_64.png] view at source ↗
Figure 64
Figure 64. Figure 64: Accuracy and prediction comparison types across increasing algorithm lengths. The green line (% view at source ↗
Figure 65
Figure 65. Figure 65: Median expected output across procedure lengths for integer and floating-point inputs, separated by [PITH_FULL_IMAGE:figures/full_fig_p041_65.png] view at source ↗
Figure 65
Figure 65. Figure 65: Accuracy across input data types (integer vs. floating-point) as a function of algorithm length. Accuracy view at source ↗
Figure 66
Figure 66. Figure 66: Median expected output across procedure lengths for integer and floating-point inputs, separated [PITH_FULL_IMAGE:figures/full_fig_p041_66.png] view at source ↗
Figure 66
Figure 66. Figure 66: Accuracy across input ranges as a function of algorithm length. Performance declines with increasing view at source ↗
Figure 67
Figure 67. Figure 67: Median expected output across procedure lengths for integer and floating-point inputs, separated [PITH_FULL_IMAGE:figures/full_fig_p042_67.png] view at source ↗
Figure 67
Figure 67. Figure 67: Accuracy across task types. The model achieves higher accuracy on addition (72.9%) compared to view at source ↗
Figure 68
Figure 68. Figure 68: Median expected output across procedure lengths for integer and floating-point inputs, separated [PITH_FULL_IMAGE:figures/full_fig_p042_68.png] view at source ↗
Figure 68
Figure 68. Figure 68: Median expected output across steps for integer and floating-point inputs, separated by correct and view at source ↗
Figure 69
Figure 69. Figure 69: Median expected output across procedure lengths for integer and floating-point inputs, separated [PITH_FULL_IMAGE:figures/full_fig_p043_69.png] view at source ↗
Figure 69
Figure 69. Figure 69: Median expected output across steps for different input ranges ([0,1], [1,10], [10,100]), separated view at source ↗
Figure 70
Figure 70. Figure 70: Median expected output across procedure lengths for integer and floating-point inputs, separated by [PITH_FULL_IMAGE:figures/full_fig_p043_70.png] view at source ↗
Figure 70
Figure 70. Figure 70: Median expected output across steps for different task types (addition, subtraction, multiplication, division, view at source ↗
Figure 71
Figure 71. Figure 71: Median expected output across procedure lengths for integer and floating-point inputs, separated by [PITH_FULL_IMAGE:figures/full_fig_p044_71.png] view at source ↗
Figure 71
Figure 71. Figure 71: Accuracy and prediction comparison types across increasing algorithm lengths. The green line (% view at source ↗
Figure 72
Figure 72. Figure 72: Median expected output across procedure lengths for integer and floating-point inputs, separated by [PITH_FULL_IMAGE:figures/full_fig_p044_72.png] view at source ↗
Figure 72
Figure 72. Figure 72: Accuracy across input data types (integer vs. floating-point) as a function of algorithm length. Accuracy view at source ↗
Figure 73
Figure 73. Figure 73: Median expected output across procedure lengths for integer and floating-point inputs, separated [PITH_FULL_IMAGE:figures/full_fig_p045_73.png] view at source ↗
Figure 73
Figure 73. Figure 73: Accuracy across input ranges as a function of algorithm length. Performance declines with increasing view at source ↗
Figure 74
Figure 74. Figure 74: Median expected output across procedure lengths for integer and floating-point inputs, separated by [PITH_FULL_IMAGE:figures/full_fig_p045_74.png] view at source ↗
Figure 74
Figure 74. Figure 74: Accuracy across task types. The model achieves higher accuracy on addition (86.7%) and subtraction view at source ↗
Figure 75
Figure 75. Figure 75: Median expected output across procedure lengths for different input ranges ([0,1], [1,10], [10,100]), [PITH_FULL_IMAGE:figures/full_fig_p046_75.png] view at source ↗
Figure 75
Figure 75. Figure 75: Median expected output across steps for integer and floating-point inputs, separated by correct and view at source ↗
Figure 76
Figure 76. Figure 76: Median expected output across procedure lengths for different input ranges ([0,1], [1,10], [10,100]), [PITH_FULL_IMAGE:figures/full_fig_p047_76.png] view at source ↗
Figure 76
Figure 76. Figure 76: Median expected output across steps for different input ranges ([0,1], [1,10], [10,100]), separated by view at source ↗
Figure 77
Figure 77. Figure 77: Median expected output across procedure lengths for different input ranges ([0,1], [1,10], [10,100]), [PITH_FULL_IMAGE:figures/full_fig_p048_77.png] view at source ↗
Figure 77
Figure 77. Figure 77: Median expected output across steps for different task types (addition, subtraction, multiplication, division, view at source ↗
Figure 78
Figure 78. Figure 78: Median expected output across procedure lengths for different input ranges ([0,1], [1,10], [10,100]), [PITH_FULL_IMAGE:figures/full_fig_p049_78.png] view at source ↗
Figure 78
Figure 78. Figure 78: Accuracy and prediction comparison types across increasing algorithm lengths. The green line (% view at source ↗
Figure 79
Figure 79. Figure 79: Median expected output across procedure lengths for different input ranges ([0,1], [1,10], [10,100]), [PITH_FULL_IMAGE:figures/full_fig_p050_79.png] view at source ↗
Figure 79
Figure 79. Figure 79: Accuracy across input data types (integer vs. floating-point) as a function of algorithm length. Accuracy view at source ↗
Figure 80
Figure 80. Figure 80: Median expected output across procedure lengths for different input ranges ([0,1], [1,10], [10,100]), [PITH_FULL_IMAGE:figures/full_fig_p051_80.png] view at source ↗
Figure 80
Figure 80. Figure 80: Accuracy across input ranges as a function of algorithm length. Performance declines with increasing view at source ↗
Figure 81
Figure 81. Figure 81: Median expected output across procedure lengths for different input ranges ([0,1], [1,10], [10,100]), [PITH_FULL_IMAGE:figures/full_fig_p052_81.png] view at source ↗
Figure 81
Figure 81. Figure 81: Accuracy across task types. The model achieves higher accuracy on addition (85.3%) and subtraction view at source ↗
Figure 82
Figure 82. Figure 82: Median expected output across procedure lengths for different input ranges ([0,1], [1,10], [10,100]), [PITH_FULL_IMAGE:figures/full_fig_p053_82.png] view at source ↗
Figure 82
Figure 82. Figure 82: Median expected output across steps for integer and floating-point inputs, separated by correct and view at source ↗
Figure 83
Figure 83. Figure 83: Median expected output across procedure lengths for different input ranges ([0,1], [1,10], [10,100]), [PITH_FULL_IMAGE:figures/full_fig_p054_83.png] view at source ↗
Figure 83
Figure 83. Figure 83: Median expected output across steps for different input ranges ([0,1], [1,10], [10,100]), separated by view at source ↗
Figure 84
Figure 84. Figure 84: Median expected output across procedure lengths for different input ranges ([0,1], [1,10], [10,100]), [PITH_FULL_IMAGE:figures/full_fig_p055_84.png] view at source ↗
Figure 84
Figure 84. Figure 84: Median expected output across steps for different task types (addition, subtraction, multiplication, division, view at source ↗
Figure 85
Figure 85. Figure 85: Median expected output across procedure lengths for different input ranges ([0,1], [1,10], [10,100]), [PITH_FULL_IMAGE:figures/full_fig_p056_85.png] view at source ↗
Figure 85
Figure 85. Figure 85: Accuracy and prediction comparison types across increasing algorithm lengths. The green line (% view at source ↗
Figure 86
Figure 86. Figure 86: Median expected output across procedure lengths for different input ranges ([0,1], [1,10], [10,100]), [PITH_FULL_IMAGE:figures/full_fig_p057_86.png] view at source ↗
Figure 86
Figure 86. Figure 86: Accuracy across input data types (integer vs. floating-point) as a function of algorithm length. Accuracy view at source ↗
Figure 87
Figure 87. Figure 87: Median expected output across procedure lengths for different input ranges ([0,1], [1,10], [10,100]), [PITH_FULL_IMAGE:figures/full_fig_p058_87.png] view at source ↗
Figure 87
Figure 87. Figure 87: Accuracy across input ranges as a function of algorithm length. Performance declines with increasing view at source ↗
Figure 88
Figure 88. Figure 88: Median expected output across procedure lengths for different input ranges ([0,1], [1,10], [10,100]), [PITH_FULL_IMAGE:figures/full_fig_p059_88.png] view at source ↗
Figure 88
Figure 88. Figure 88: Accuracy across task types. The model achieves higher accuracy on addition (98.1%) compared view at source ↗
Figure 89
Figure 89. Figure 89: Median expected output across procedure lengths for different task types (addition, subtraction, multi [PITH_FULL_IMAGE:figures/full_fig_p061_89.png] view at source ↗
Figure 89
Figure 89. Figure 89: Median expected output across steps for integer and floating-point inputs, separated by correct and view at source ↗
Figure 90
Figure 90. Figure 90: Median expected output across procedure lengths for different task types (addition, subtraction, multi [PITH_FULL_IMAGE:figures/full_fig_p062_90.png] view at source ↗
Figure 90
Figure 90. Figure 90: Median expected output across steps for different input ranges ([0,1], [1,10], [10,100]), separated by view at source ↗
Figure 91
Figure 91. Figure 91: Median expected output across procedure lengths for different task types (addition, subtraction, multi [PITH_FULL_IMAGE:figures/full_fig_p063_91.png] view at source ↗
Figure 91
Figure 91. Figure 91: Median expected output across steps for different task types (addition, subtraction, multiplication, division, view at source ↗
Figure 92
Figure 92. Figure 92: Median expected output across procedure lengths for different task types (addition, subtraction, multi [PITH_FULL_IMAGE:figures/full_fig_p064_92.png] view at source ↗
Figure 92
Figure 92. Figure 92: Accuracy and prediction comparison types across increasing algorithm lengths. The green line (% view at source ↗
Figure 93
Figure 93. Figure 93: Median expected output across procedure lengths for different task types (addition, subtraction, multi [PITH_FULL_IMAGE:figures/full_fig_p065_93.png] view at source ↗
Figure 93
Figure 93. Figure 93: Accuracy across input data types (integer vs. floating-point) as a function of algorithm length. Accuracy view at source ↗
Figure 94
Figure 94. Figure 94: Accuracy across input ranges as a function of algorithm length. Performance declines with increasing view at source ↗
Figure 95
Figure 95. Figure 95: Median expected output across procedure lengths for different task types (addition, subtraction, multi [PITH_FULL_IMAGE:figures/full_fig_p067_95.png] view at source ↗
Figure 95
Figure 95. Figure 95: Accuracy across task types. The model achieves higher accuracy on addition (40.3%) and subtraction view at source ↗
Figure 96
Figure 96. Figure 96: Median expected output across procedure lengths for different task types (addition, subtraction, multi [PITH_FULL_IMAGE:figures/full_fig_p068_96.png] view at source ↗
Figure 96
Figure 96. Figure 96: Median expected output across steps for integer and floating-point inputs, separated by correct and view at source ↗
Figure 97
Figure 97. Figure 97: Median expected output across procedure lengths for different task types (addition, subtraction, multi [PITH_FULL_IMAGE:figures/full_fig_p069_97.png] view at source ↗
Figure 97
Figure 97. Figure 97: Median expected output across steps for different input ranges ([0,1], [1,10], [10,100]), separated by view at source ↗
Figure 98
Figure 98. Figure 98: Median expected output across procedure lengths for different task types (addition, subtraction, multi [PITH_FULL_IMAGE:figures/full_fig_p070_98.png] view at source ↗
Figure 98
Figure 98. Figure 98: Median expected output across steps for different task types (addition, subtraction, multiplication, division, view at source ↗
Figure 99
Figure 99. Figure 99: Median expected output across procedure lengths for different task types (addition, subtraction, multi [PITH_FULL_IMAGE:figures/full_fig_p071_99.png] view at source ↗
Figure 99
Figure 99. Figure 99: Accuracy and prediction comparison types across increasing algorithm lengths. The green line (% view at source ↗
Figure 100
Figure 100. Figure 100: Median expected output across procedure lengths for different task types (addition, subtraction, [PITH_FULL_IMAGE:figures/full_fig_p072_100.png] view at source ↗
Figure 100
Figure 100. Figure 100: Accuracy across input data types (integer vs. floating-point) as a function of algorithm length. Accuracy view at source ↗
Figure 101
Figure 101. Figure 101: Median expected output across procedure lengths for different task types (addition, subtraction, [PITH_FULL_IMAGE:figures/full_fig_p073_101.png] view at source ↗
Figure 101
Figure 101. Figure 101: Accuracy across input ranges as a function of algorithm length. Performance declines with increasing view at source ↗
Figure 102
Figure 102. Figure 102: Median expected output across procedure lengths for different task types (addition, subtraction, [PITH_FULL_IMAGE:figures/full_fig_p074_102.png] view at source ↗
Figure 102
Figure 102. Figure 102: Accuracy across task types. The model achieves higher accuracy on addition (99.7%) and subtraction view at source ↗
Figure 103
Figure 103. Figure 103: FAA and prediction comparison types across increasing procedure lengths. The green line (% Exact) [PITH_FULL_IMAGE:figures/full_fig_p075_103.png] view at source ↗
Figure 103
Figure 103. Figure 103: Median expected output across steps for integer and floating-point inputs, separated by correct and view at source ↗
Figure 104
Figure 104. Figure 104: FAA and prediction comparison types across increasing procedure lengths. The green line (% Exact) [PITH_FULL_IMAGE:figures/full_fig_p075_104.png] view at source ↗
Figure 104
Figure 104. Figure 104: Median expected output across steps for different input ranges ([0,1], [1,10], [10,100]), separated by view at source ↗
Figure 105
Figure 105. Figure 105: FAA and prediction comparison types across increasing procedure lengths. The green line (% Exact) [PITH_FULL_IMAGE:figures/full_fig_p076_105.png] view at source ↗
Figure 105
Figure 105. Figure 105: Median expected output across steps for different task types (addition, subtraction, multiplication, view at source ↗
Figure 106
Figure 106. Figure 106: FAA and prediction comparison types across increasing procedure lengths. The green line (% Exact) [PITH_FULL_IMAGE:figures/full_fig_p076_106.png] view at source ↗
Figure 106
Figure 106. Figure 106: Accuracy and prediction comparison types across increasing algorithm lengths. The green line (% view at source ↗
Figure 107
Figure 107. Figure 107: FAA and prediction comparison types across increasing procedure lengths. The green line (% Exact) [PITH_FULL_IMAGE:figures/full_fig_p077_107.png] view at source ↗
Figure 107
Figure 107. Figure 107: Accuracy across input data types (integer vs. floating-point) as a function of algorithm length. Accuracy view at source ↗
Figure 108
Figure 108. Figure 108: FAA and prediction comparison types across increasing procedure lengths. The green line (% Exact) [PITH_FULL_IMAGE:figures/full_fig_p077_108.png] view at source ↗
Figure 108
Figure 108. Figure 108: Accuracy across input ranges as a function of algorithm length. Performance declines with increasing view at source ↗
Figure 109
Figure 109. Figure 109: FAA and prediction comparison types across increasing procedure lengths. The green line (% Exact) [PITH_FULL_IMAGE:figures/full_fig_p078_109.png] view at source ↗
Figure 109
Figure 109. Figure 109: Accuracy across task types. The model achieves higher accuracy on addition (99.9%) and subtraction view at source ↗
Figure 110
Figure 110. Figure 110: FAA and prediction comparison types across increasing procedure lengths. The green line (% Exact) [PITH_FULL_IMAGE:figures/full_fig_p078_110.png] view at source ↗
Figure 110
Figure 110. Figure 110: Median expected output across steps for integer and floating-point inputs, separated by correct and view at source ↗
Figure 111
Figure 111. Figure 111: FAA and prediction comparison types across increasing procedure lengths. The green line (% Exact) [PITH_FULL_IMAGE:figures/full_fig_p079_111.png] view at source ↗
Figure 111
Figure 111. Figure 111: Median expected output across steps for different input ranges ([0,1], [1,10], [10,100]), separated by view at source ↗
Figure 112
Figure 112. Figure 112: FAA and prediction comparison types across increasing procedure lengths. The green line (% Exact) [PITH_FULL_IMAGE:figures/full_fig_p079_112.png] view at source ↗
Figure 112
Figure 112. Figure 112: Median expected output across steps for different task types (addition, subtraction, multiplication, view at source ↗
Figure 113
Figure 113. Figure 113: FAA and prediction comparison types across increasing procedure lengths. The green line (% Exact) [PITH_FULL_IMAGE:figures/full_fig_p080_113.png] view at source ↗
Figure 113
Figure 113. Figure 113: Accuracy and prediction comparison types across increasing algorithm lengths. The green line (% view at source ↗
Figure 114
Figure 114. Figure 114: FAA and prediction comparison types across increasing procedure lengths. The green line (% Exact) [PITH_FULL_IMAGE:figures/full_fig_p080_114.png] view at source ↗
Figure 115
Figure 115. Figure 115: FAA and prediction comparison types across increasing procedure lengths. The green line (% Exact) [PITH_FULL_IMAGE:figures/full_fig_p081_115.png] view at source ↗
Figure 116
Figure 116. Figure 116: FAA and prediction comparison types across increasing procedure lengths. The green line (% Exact) [PITH_FULL_IMAGE:figures/full_fig_p081_116.png] view at source ↗
read the original abstract

Large language models (LLMs) often achieve strong performance on reasoning benchmarks, but final-answer accuracy alone does not show whether they faithfully execute the procedure specified in a prompt. We introduce a controlled diagnostic benchmark for procedural execution, where models are given a step-wise arithmetic procedure and two numeric inputs, and must return the final computed value. Complexity is varied through procedure length and look-back dependencies over intermediate variables. Average first-answer accuracy drops from 63% on 5-step procedures to 20% on 95-step procedures. Generation-level analysis shows that failures often involve missing answers, premature answers, self-correction after an initial error and under-executed traces. These findings suggest that apparent reasoning ability can mask substantial weaknesses in faithful long-horizon procedural execution.

Editorial analysis

A structured set of objections, weighed in public.

Desk editor's note, referee report, simulated authors' rebuttal, and a circularity audit. Tearing a paper down is the easy half of reading it; the pith above is the substance, this is the friction.

Referee Report

1 major / 2 minor

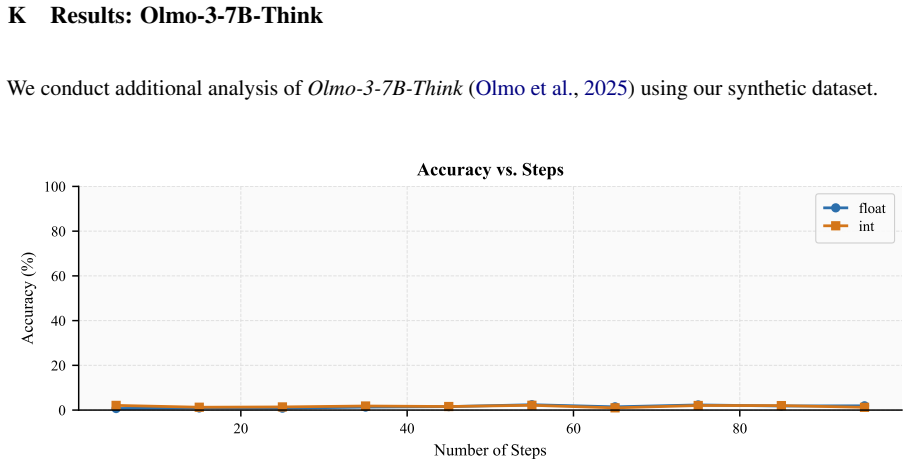
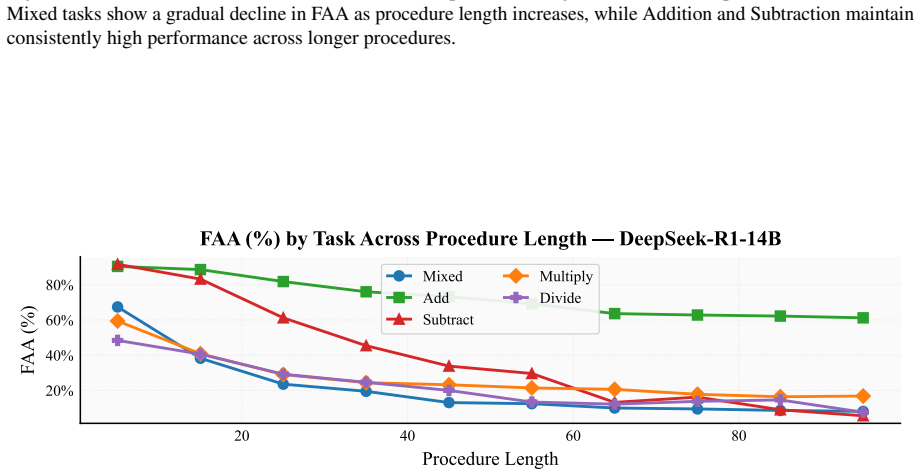
Summary. The manuscript introduces a controlled diagnostic benchmark to assess whether large language models faithfully execute step-by-step arithmetic procedures given in prompts, beyond merely producing correct final answers. The benchmark varies procedure length (5 to 95 steps) and look-back dependencies on intermediate variables while using simple arithmetic. Experiments across 14 models and 55 datasets show first-answer accuracy declining from 61% to 20%, with failure modes including missing or premature answers, self-corrections, under-executed traces, and hallucinated steps. The authors conclude that strong performance on reasoning tasks may conceal deficiencies in procedural instruction following.

Significance. If the results are robust, this study provides valuable evidence that current LLMs struggle with faithful execution of long procedures, which has implications for applications requiring reliable multi-step reasoning and instruction adherence. The broad evaluation across many models and datasets lends credibility to the observed trends and could guide future work on improving procedural fidelity in language models. The scale of the empirical evaluation is a clear strength.

major comments (1)
  1. [Benchmark construction] Benchmark construction (as described in the abstract): The central assumption that varying algorithm length and look-back dependencies over intermediate variables sufficiently isolates procedural execution failures from context tracking, attention dilution, or variable reference resolution is not fully supported by the design. Longer procedures (up to 95 steps) necessarily increase the number of intermediate variables and cumulative reference distances across the context window; models could fail due to these factors even while grasping the high-level steps. This assumption is load-bearing for attributing the accuracy drop (61% at 5 steps to 20% at 95 steps) specifically to weaknesses in faithful instruction execution rather than general context management limitations.
minor comments (2)
  1. [Abstract] The abstract states that trends are consistent across 14 models and 55 datasets but provides no details on statistical controls, variance, run-to-run variability, or how failure categories were annotated; adding these would improve clarity and verifiability.
  2. [Methods] Methods details on exact prompt templates, how datasets were generated to control for total context length, and model version specifics are not visible in the provided summary; these would aid reproducibility.

Simulated Author's Rebuttal

1 responses · 0 unresolved

We thank the referee for their positive evaluation of the work's significance and the breadth of our empirical evaluation across models and datasets. We address the single major comment on benchmark construction below and will incorporate revisions to clarify the design rationale and potential confounds.

read point-by-point responses
  1. Referee: Benchmark construction (as described in the abstract): The central assumption that varying algorithm length and look-back dependencies over intermediate variables sufficiently isolates procedural execution failures from context tracking, attention dilution, or variable reference resolution is not fully supported by the design. Longer procedures (up to 95 steps) necessarily increase the number of intermediate variables and cumulative reference distances across the context window; models could fail due to these factors even while grasping the high-level steps. This assumption is load-bearing for attributing the accuracy drop (61% at 5 steps to 20% at 95 steps) specifically to weaknesses in faithful instruction execution rather than general context management limitations.

    Authors: We appreciate this observation that procedure length inherently correlates with more intermediate variables and longer reference spans, which could interact with general context-management limitations. Our benchmark does attempt to isolate procedural fidelity by fixing the arithmetic operations to simple addition/subtraction while systematically varying both total length and the specific look-back distance to prior variables at each step; this allows us to observe whether models correctly retrieve and apply the referenced value rather than merely losing track of the overall context. The qualitative failure modes we document—such as skipping an explicit step, emitting a premature final answer before completing the trace, or hallucinating an operation not present in the prompt—suggest breakdowns in faithful step execution that go beyond uniform attention dilution. That said, we agree the current presentation does not fully rule out the confound. In the revision we will add a new subsection under Benchmark Design that (a) quantifies the distribution of reference distances across lengths, (b) reports error rates conditioned on reference distance within fixed-length subsets, and (c) discusses the implications for attributing the observed accuracy drop primarily to procedural instruction following. These additions will make the load-bearing assumption more transparent without requiring new experiments. revision: partial

Circularity Check

0 steps flagged

No circularity: purely empirical benchmark study with no derivations or fitted parameters.

full rationale

This paper constructs controlled benchmark datasets with arithmetic procedures of increasing length and look-back dependencies, then empirically measures LLM accuracy and error patterns across 14 models and 55 datasets. There are no mathematical derivations, parameter fittings, self-citations used as load-bearing premises, or uniqueness theorems invoked. The central claims rest on direct experimental observations of accuracy decline (e.g., 61% to 20%) and qualitative failure modes, which are self-contained against the external benchmark results and do not reduce to any input by construction.

Axiom & Free-Parameter Ledger

0 free parameters · 1 axioms · 0 invented entities

The central claim rests on the domain assumption that performance on these synthetic arithmetic procedures directly measures faithful procedural execution in general.

axioms (1)
  • domain assumption The benchmark tasks accurately measure procedural execution fidelity independent of other model capabilities.
    This premise is required to interpret accuracy drops as evidence of instruction-following failures rather than other limitations.

pith-pipeline@v0.9.0 · 5685 in / 1082 out tokens · 40464 ms · 2026-05-22T10:00:21.774910+00:00 · methodology

discussion (0)

Sign in with ORCID, Apple, or X to comment. Anyone can read and Pith papers without signing in.

Lean theorems connected to this paper

Citations machine-checked in the Pith Canon. Every link opens the source theorem in the public Lean library.

What do these tags mean?
matches
The paper's claim is directly supported by a theorem in the formal canon.
supports
The theorem supports part of the paper's argument, but the paper may add assumptions or extra steps.
extends
The paper goes beyond the formal theorem; the theorem is a base layer rather than the whole result.
uses
The paper appears to rely on the theorem as machinery.
contradicts
The paper's claim conflicts with a theorem or certificate in the canon.
unclear
Pith found a possible connection, but the passage is too broad, indirect, or ambiguous to say the theorem truly supports the claim.