REVIEW 2 major objections 5 minor 15 references
Cellular memory enhances bacterial chemotactic navigation in rugged environments
T0 review · 2 major / 5 minor · reviewed 2026-08-14 · deepseek-v4-flash
Pith's one-line read In rugged chemoattractant landscapes, bacteria with memory drift faster than the Keller–Segel gradient-sensing prediction by exploiting spatial correlations.
desk verdict The analytical correction in Eq. (25) is orders of magnitude too small under the reported parameters to explain the simulated enhancement, so the paper's central claim is not supported as written. read the letter →
The pith
A machine-rendered reading of the paper's core claim, the machinery that carries it, and where it could break.
The reading
What carries the argument
The central mechanism is the bi-lobed chemotactic memory kernel K(t) = (β/γ)$e^{{-t/γ}}$(t/γ − $t^{2}$/($2γ^{2}$)), which gives positive weight to recent attractant samples and negative weight to older ones, convolved with the perceived signal to set the tumbling rate λ(t) = 1 − Λ(t). The argument extends de Gennes' drift-velocity derivation by keeping the second-order term in the small-response expansion of the run-time average; that term couples the kernel to the spatial autocovariance Cη of the Ornstein–Uhlenbeck noise and produces the positive correction Δvµ. The load-bearing identity is the closed-form integral (Eq. 25) for Δvµ in terms of γ and µ, which turns the abstract idea of using correlations into a quantitative prediction and explains why the optimum sits at memory comparable to perceived fluctuation time.
What would settle it
Track individual E. coli in a microfluidic channel that superimposes spatial noise of known correlation length µ on a linear attractant gradient; if the measured mean drift does not exceed the Keller–Segel prediction for memories γ comparable to the correlation time, the claimed correlation-exploitation mechanism fails, and the region where the formula overpredicts (0.05<µ<0.5, γ<1/4) is a discriminating test.
Extended reading notes
Core claim
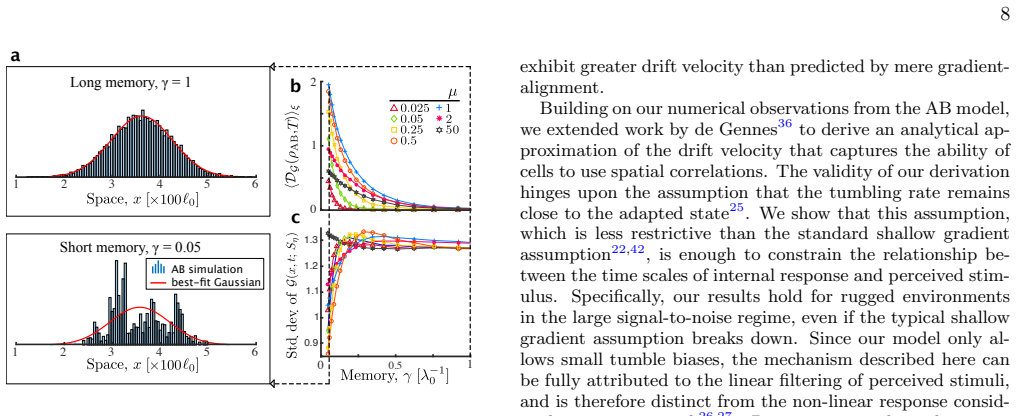
The central discovery is that cells with a bi-lobed memory kernel K(t) and constant run speed v0 achieve an average drift velocity ⟨vAB(Sη)⟩ξ ≈ vKS + Δvµ in a landscape Sη(x) = αx + η(x) with additive Ornstein–Uhlenbeck noise of correlation length µ, where vKS = 2βαγ/(1+2γ)^3 is the Keller–Segel drift and Δvµ is a positive correction (Eq. 25) arising from the overlap of the kernel with the spatial autocovariance of the noise. This means the cell uses the correlations it encounters while swimming, not just the instantaneous gradient, and the effect is largest when the memory time γ is commensurate with the perceived fluctuation time. The formula recovers KS in the limits µ→0, µ→∞, γ→0, γ→∞, and α→0, and it matches agent-based simulations across a broad range of memory and correlation length, with optimal memory γ*_µ ≥ 1/4 and maximum speed-up at µ ≈ 1/2. The paper also shows that short-memory cells in mildly rugged landscapes split into long-lived multimodal subpopulations, while long memory keeps the population unimodal Gaussian.
Load-bearing premise
The drift-velocity formula rests on treating the tumbling-rate response as a small perturbation (|Λ|≪1) and ignoring correlations of order higher than two and inputs preceding the last tumble.
Editorial extensions
If this is right
- In constant shallow gradients, agent-based cells match KS drift exactly, so memory gives no advantage when the environment is smooth.
- In rugged landscapes with correlation length near one run length, the KS model measurably underestimates population drift, by an amount the formula quantifies.
- The optimal memory for navigation is always at least the KS optimum γ*_KS = 1/4, and the largest speed-up over KS occurs when the correlation length is about half a run length.
- The enhancement disappears in the white-noise and constant-gradient limits, so the effect is specifically due to spatial correlations rather than noise alone.
- Short-memory cells in mildly rugged landscapes lose population coherence, forming long-lived multimodal distributions, while long-memory cells stay unimodal.
Reading between the lines
- If the correction term holds in two and three dimensions, memory tuning could act as a population-level bet-hedging mechanism, with subpopulations of different memory values scanning rugged territories at different rates—a testable prediction for heterogeneous microbial habitats.
- The same kernel–covariance coupling could be ported to other bi-lobed sensing systems, such as visual neurons in saccadic search, where the memory is the temporal response of the receptive field and the landscape is the image statistics.
- A direct experiment could validate the formula by placing E. coli in microfluidic gradients with engineered spatial noise of known correlation length and comparing measured drift to the KS baseline; the discrepancy should peak near correlation lengths of about 0.1–1 run lengths and vanish for smooth gradients.
- The authors' overprediction for short memories hints that higher-order response statistics or population heterogeneity must enter the closure; adding a third-order or variance term might resolve the discrepancy and yield a more accurate effective-drift equation.
Signed reviews
Editorial analysis
A structured set of objections, weighed in public.
Referee Report
Summary. The paper studies how cellular memory affects E. coli chemotaxis in one-dimensional rugged attractant landscapes. It introduces an agent-based (AB) model with a bi-lobed response kernel, validates it against the Keller-Segel (KS) model in constant shallow gradients, and reports that AB cells drift faster than the KS prediction when the spatial correlation length of the landscape is comparable to the run length and the cellular memory is of comparable magnitude. To explain this, the authors extend de Gennes' run-time derivation to second order, obtaining an analytic drift velocity Vmu = vKS + Delta v_mu (Eqs. 23-25). They also report that short-memory cells produce long-lived multimodal population distributions in rugged landscapes. Code and data are deposited with DOIs.
Significance. If the central claim held, the paper would be important: it proposes a parameter-free, analytically tractable mechanism by which cellular memory extracts information from spatial correlations, with falsifiable predictions for the dependence of drift enhancement on the memory gamma and correlation length mu. The manuscript has clear strengths: the analytic derivation is explicit in Supplementary Notes 3-5, the AB model is carefully checked against KS in constant gradients, the small-response condition is verified in the simulated regimes, and code and data are publicly available. However, the quantitative inconsistency described in the major comments means that the central claim, as stated, is not supported by the reported equations and parameters.
major comments (2)
- [Derivation of drift speed, Eq. (25); Figs. 3-4] The central result is internally inconsistent with the stated simulation parameters. For Fig. 3, the caption reports perceived gradient alpha beta = 0.05 and beta sigma_eta = 10^-3. With these values, v*KS = 0.148 alpha beta approximately 7.4 x 10^-3, while the dimensionless prefactor multiplying beta^2 sigma_eta^2 in Eq. (25) is at most about 10^-2 over the plotted gamma and mu ranges. Since beta^2 sigma_eta^2 = 10^-6, the maximum correction satisfies Delta v_mu / v*KS less than or similar to 10^-6; near gamma*KS it is even smaller. Yet Figs. 3c and 4a display enhancements of 5-30% above vKS and show a red Vmu curve tracking those data. Equation (25) as written therefore cannot produce the displayed enhancement. The authors should correct the prefactor or scaling of Eq. (25), state explicitly the parameters used to draw the red curves in Figs. 3-4, and re-verify the AB results against the corrected formula; if the large enhancement persists, an additional mechanism beyond the second-order correlation term must be identified.
- [The effect of memory on the drift speed, Fig. 3c] The paper's own stated limitation reinforces the quantitative concern. In the regime of short memory and mildly rugged landscapes (0.05 < mu < 0.5, gamma < gamma*KS; Fig. 3c), the authors state that Vmu overpredicts the AB drift and attribute the discrepancy to population heterogeneity not captured by the second-order moment. However, at the parameters of Fig. 3, the bracket in Eq. (25) in this regime is of order 10^-3 or smaller and can change sign; after multiplication by beta^2 sigma_eta^2 = 10^-6, the resulting correction is at most about 10^-9, far too small to be visible on the scale of the figure or to produce the claimed overprediction. This indicates that the second-order correlation term is not the controlling contribution to the observed deviations from KS, and the qualitative attribution to population heterogeneity is not quantitatively supported by the stated magnitudes.
minor comments (5)
- [Fig. 4 caption] Please state the values of beta, alpha, sigma_eta, mu, and m used for the curves and error bars in Fig. 4, so that Eq. (25) can be evaluated directly; currently only the Fig. 3 caption gives these parameters.
- [Eq. (22)] The definitions of tau, t-hat, and the integration order in Eq. (22) are only clear after reading Supplementary Note 5; add a sentence or pointer to Supplementary Figure 6 in the main text to guide the reader.
- [Figure captions, notation] The notation beta sigma_eta in the figure captions is ambiguous because it is the product beta times sigma_eta; please write it as beta sigma_eta consistently to avoid reading it as a single variable.
- [Supplementary Figure 4] The y-axis of Supplementary Figure 4 is labelled sigma^2_eta, but the quantity plotted is the normalised response variance sigma^2_Lambda; please correct the axis label to match the text.
- [Discussion, first paragraph] The statement that 'the KS model accurately predicts the behaviour of the AB population' should be qualified by the parameter range of the validation (here, alpha beta less than or similar to 0.1 and the small-response condition).
Circularity Check
No significant circularity: the analytical drift formula is a parameter-free extension of de Gennes' method with no coefficients fitted to the agent-based data.
full rationale
The paper's claimed derivation chain is self-contained and does not reduce to its inputs by construction. The central result, Eq. (23) with the correction Eq. (25), is obtained by starting from the same run-and-tumble response model used to define the agent-based simulations (Eqs. (1)-(2)), expanding the tumbling-rate response to second order in the small-response regime, and then explicitly evaluating the resulting integrals using the Ornstein-Uhlenbeck covariance of the landscape. No free parameter is fitted to the AB drift velocity data: the quantities β, γ, α, ση, and μ are stated inputs, and the AB comparison in Figs. 3-4 is a genuine, independent numerical check of the analytic integration. The vKS term in Eq. (23) arises from the first-order term exactly as in de Gennes' calculation, and Δvμ emerges from the second-order correlation term rather than being imposed to match the observed enhancement. The paper itself identifies a regime where the approximation overpredicts the AB drift (short memory, mildly rugged landscapes), which is an accuracy limitation and not evidence of circularity. The self-citation to Gosztolai et al. 2019 (Ref. 28) appears only in contextual remarks about non-local optimisation and search efficiency and is not load-bearing for the derivation. The skeptical concern that the stated parameters make Δvμ much smaller than the displayed numerical enhancement is a quantitative consistency/correctness issue, not a circularity of the kind defined here. Therefore no circular step is identified and the score is 0.
Assumptions & free parameters
free parameters (5)
- β (dimensionless signal gain)
- γ (cellular memory)
- α (attractant gradient)
- ση (noise amplitude)
- μ (spatial correlation length)
assumptions (5)
- domain assumption The chemotactic memory kernel has the bi-lobed form K(t) = β/γ e^{-t/γ}(t/γ - t^2/(2γ^2)), with ∫K dt = 0.
- domain assumption The tumble rate stays close to the adapted value, |Λ|≪1 (small-response condition), so the exponential in Eq. (19) can be expanded to second order.
- domain assumption The landscape is a linear gradient plus additive spatial noise modeled as a regularized Ornstein-Uhlenbeck process; analytical computations take the OU limit m→0.
- ad hoc to paper Inputs perceived before the last tumble do not contribute to the drift; the kernel is truncated at the tumble time and only causal delays are kept.
- domain assumption Runs are straight with constant speed, tumbles are instantaneous Poisson events with no directional persistence in 1D.
Cite this review
Pith. "Pith review of Cellular memory enhances bacterial chemotactic navigation in rugged environments." pith.science (2026). https://pith.science/paper/YXNSCS6S
@misc{pith2026190804316,
  author       = {Pith},
  title        = {Pith review of: Cellular memory enhances bacterial chemotactic navigation in rugged environments},
  year         = {2026},
  howpublished = {\url{https://pith.science/paper/YXNSCS6S}},
  note         = {Machine review of arXiv:1908.04316}
}
read the original abstract
The response of microbes to external signals is mediated by biochemical networks with intrinsic time scales. These time scales give rise to a memory that impacts cellular behaviour. Here we study theoretically the role of cellular memory in Escherichia coli chemotaxis. Using an agent-based model, we show that cells with memory navigating rugged chemoattractant landscapes can enhance their drift speed by extracting information from environmental correlations. Maximal advantage is achieved when the memory is comparable to the time scale of fluctuations as perceived during swimming. We derive an analytical approximation for the drift velocity in rugged landscapes that explains the enhanced velocity, and recovers standard Keller-Segel gradient-sensing results in the limits when memory and fluctuation time scales are well separated. Our numerics also show that cellular memory can induce bet-hedging at the population level resulting in long-lived multi-modal distributions in heterogeneous landscapes.
Figures


Figures from the paper (2 more)

Reference graph
Works this paper leans on
-
[1]
It is adaptive, that is ∫ K(t)dt = 0
-
[2]
Thus, one may exchange limits in the integral Eq
It is causal, i.e.K(t) = 0 for t< 0. Thus, one may exchange limits in the integral Eq. (S2) Λ(t) = ∫ t −∞ K(t−u)S(x(u))du = ∫ ∞ 0 K(u)S(x(t−u))du
-
[3]
The kernel computes the instantaneous derivative of the perceived signalS(t) in the limit of vanishing memory γ→ 0. Indeed, using property 2, we have ∫ ∞ 0 K(u)S(t−u)du = ∫ ∞ 0 K(u)(S(t)−udS(t) dt +O(u2))du = ∫ ∞ 0 K(γw)(S(t)−γwdS(t) dt +O(γw2))dw = dS(t) dt ∫ ∞ 0 |γK(γw)|dw−O ( γ ∫ ∞ 0 K(γw)w2dw ) =βdS(t) dt −O ( γ ∫ ∞ 0 K(γw)w2dw ) , where in the third ...
-
[4]
Symbols show Monte Carlo simulations using the linear dynamical system Eq
1 1 10 100 Analyti c Supplementary Figure 4: Tumbling rate varianceσ2 η as a function of Γ = γ/µ, the memory length γ relative to the correlation lengthµ of the Ornstein-Uhlenbeck inputη0. Symbols show Monte Carlo simulations using the linear dynamical system Eq. (S6) driven byη0 at various values of µ. Dashed line shows analytical computations using Eq. ...
-
[5]
Tu, Y., Shimizu, T. S. & Berg, H. C. Modeling the chemotactic response ofEscherichia coli to time- varying stimuli. Proc. Natl. Acad. Sci. USA 105, 14855–14860 (2008)
work page 2008
-
[6]
de Gennes, P. G. Chemotaxis: the role of internal delays.Eur. Biophys. J. 33, 691–693 (2004)
work page 2004
-
[7]
Brown, D. A. & Berg, H. C. Temporal stimulation of chemotaxis inEscherichia coli. Proc. Natl. Acad. Sci. USA 71 (1974)
work page 1974
-
[8]
Clark, D. A. & Grant, L. C. The bacterial chemotactic response reflects a compromise between transient and steady-state behavior. Proc. Natl. Acad. Sci. USA 102, 9150–9155 (2005)
work page 2005
Show all 15 references
-
[9]
& Vergassola, M
Celani, A. & Vergassola, M. Bacterial strategies for chemotaxis response.Proc. Natl. Acad. Sci. USA 107, 1391–1396 (2010)
2010
-
[10]
Time Lags in Biological Models (Springer-Verlag, Heidelberg, 1978)
MacDonald, N. Time Lags in Biological Models (Springer-Verlag, Heidelberg, 1978)
1978
-
[11]
Berg, H. C. E. coli in Motion (Springer-Verlag, New York, NY, 2004)
2004
-
[12]
& Samaey, G
Rousset, M. & Samaey, G. Individual-based models for bacterial chemotaxis in the diffusion asymp- totics. Math. Models Methods Appl. Sci. 23, 2005–2037 (2013)
2013
-
[13]
B., Mugler, A
Becker, N. B., Mugler, A. & ten Wolde, P. R. Optimal prediction by cellular signaling networks.Phys. Rev. Lett. 115, 258103 (2015)
2015
-
[14]
S., Fu, X., H.-N., L
Dufour, Y. S., Fu, X., H.-N., L. & Emonet, T. Limits of feedback control in bacterial chemotaxis. PLOS Comp. Biol. 10, 1–11 (2014)
2014
-
[15]
& Othmer, H
Erban, R. & Othmer, H. From individual to collective behavior in bacterial chemotaxis.SIAM J. Appl. Math 65, 361–391 (2004). 14
2004
Reviewed August 14, 2026 · model on record in the stance chip above.
Discussion (0). Continue with ORCID to comment.