REVIEW 5 major objections 6 minor 16 references
Linking Actor Behavior to Process Performance Over Time
T0 review · 5 major / 6 minor · reviewed 2026-08-06 · deepseek-v4-flash
Pith's one-line read The paper claims that actor handovers, idle or busy, Granger-cause later throughput time across three real-world event logs.
desk verdict A useful, reproducible integration of actor behavior decomposition with Granger causality, but the headline causal claim outruns the statistics because the lags are selected on the same data and the directionality evidence is near chance. read the letter →
The pith
A machine-rendered reading of the paper's core claim, the machinery that carries it, and where it could break.
The reading
What carries the argument
The load-bearing machinery is the four-way classification of each consecutive event pair inside a case: continuation (same actor, no other case in between), interruption (same actor but with intervening work on another case), handover idle (different actor, idle during the handover), and handover busy (different actor, already busy with another case). Daily counts of these four behaviors become behavioral time series aligned with daily average throughput time and outcome fractions. Granger causality then asks whether the past values of a behavioral series improve a linear autoregressive prediction of the KPI series, with the F-test comparing nested models; Group Lasso selects which lags enter as a group, keeping the model sparse and interpretable.
What would settle it
A concrete test: take one of the logs, re-run the behavior classification under an alternative multi-tasking model (for example, treating overlapping event intervals for the same actor as parallel work), and repeat the Group Lasso and Granger pipeline; if the handover-to-throughput-time links do not survive the reclassification, the reported causal links are artifacts of the busy/idle labeling rather than a property of the process.
Extended reading notes
Core claim
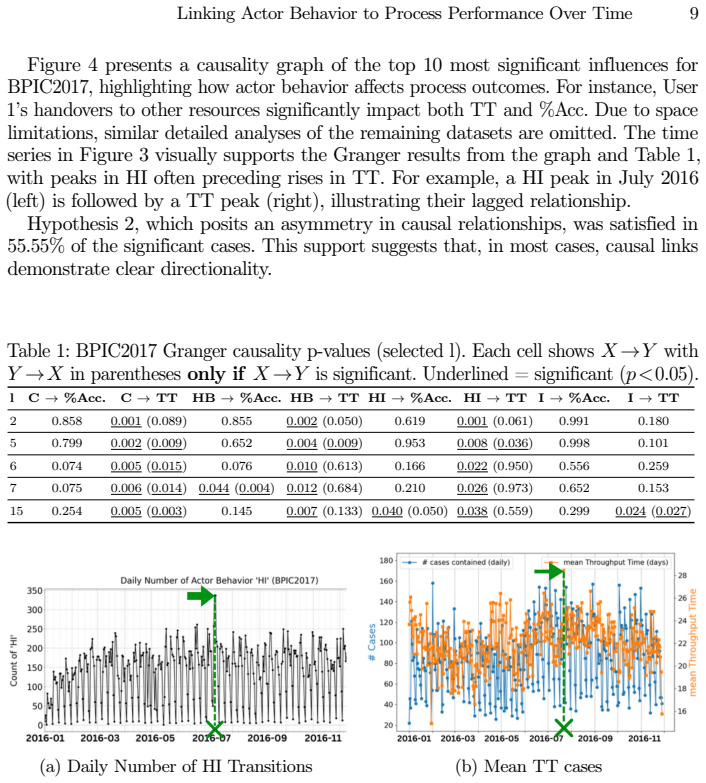
The paper's central claim is that actor behavior, decomposed into continuations, interruptions, handover-idle, and handover-busy transitions, has direct and time-lagged effects on process performance, and that the most consistent and strongest of these effects is the influence of both types of handover on average throughput time. The authors assert this follows from Granger causality tests on daily time series built from three real event logs: past handover counts significantly improve prediction of future throughput time beyond the history of throughput time itself, at lags selected by Group Lasso and usually in one direction. They report in the discussion that 'the most consistent finding is the strong causal influence of handovers, both HB and HI, on TT,' and take this as evidence that actor-centric, time-series-based analysis can uncover temporal dependencies that static aggregate process mining misses.
Load-bearing premise
The entire argument rests on the behavioral labels being correct: if actors perform multiple tasks at once, or timestamps are too coarse to say whether someone was busy between events, then the handover-busy and interruption counts are misclassified and the Granger links may be artifacts.
Editorial extensions
If this is right
- If the claim holds, daily handover counts become leading indicators: an operations team can forecast rising throughput time a few days before it appears in completed-case averages.
- Reducing idle and busy handovers, or smoothing their daily peaks, would be expected to lower future average throughput time.
- The same pipeline transfers to other event logs with actor and timestamp information, so hospital, finance, and procurement settings can be monitored with one common procedure.
- Since most significant links are one-directional, monitoring systems can treat behavior-to-KPI directions as the primary warning direction rather than worrying equally about feedback loops.
- A small set of lags (typically two to seven and occasionally fifteen to twenty-one days) captures most of the causal influence, so parsimonious models with a handful of lagged features are enough for prediction.
Reading between the lines
- My inference: because Granger causality only tests predictive improvement in linear models, the paper's phrase 'direct and measurable impacts' would need a randomized intervention, such as reassigning handovers between actors, to establish manipulation-level causality.
- My inference: the daily aggregation window is a modeling choice; weekly or shift-level buckets might reveal that handover effects are much shorter-lived than the selected lags imply, which would change where to place monitoring dashboards.
- My inference: the per-activity and per-user behavioral time series could feed directly into predictive monitoring models for remaining time, but multivariate Granger or vector autoregression would be needed to separate spurious cross-correlations among behavior types.
Editorial analysis
A structured set of objections, weighed in public.
Referee Report
Summary. The paper proposes an actor-centric time series framework that links actor behaviors (continuation, interruption, handover idle, handover busy) to process performance (throughput time and outcome fractions). For three BPIC event logs, the authors build daily behavioral and KPI time series, select influential lags with Group Lasso, and test Granger causality between behavior and outcome series. They report that handovers, especially HB and HI, Granger-cause throughput time across datasets, and that the causal direction is predominantly one-way. The claimed contribution is a new integration of actor behavior decomposition with temporal causality analysis.
Significance. If the findings were statistically valid, this would be a useful and novel contribution: it extends prior actor-behavior decomposition work by adding a temporal/causal dimension, uses real-world logs from three different domains, and makes the implementation publicly available. The behavioral taxonomy is interpretable, and the cross-log application is a clear strength. However, the current inferential pipeline does not support the central causal claims: p-values are obtained after model selection on the same data, no multiple-testing correction is applied, and the reported directionality evidence is at chance level. The open code and concrete KPI construction are valuable, but the statistical validation needs to be reworked before the conclusions can be accepted.
major comments (5)
- [Section 4.3 and Section 5.1] The Granger p-values in Tables 1-3 are post-selection statistics. The five lags are chosen by Group Lasso over all (lambda_g, lambda_1) combinations on the full series, and the F-test is then run on those same series at those same lags. This invalidates the nominal 0.05 threshold. The near-chance pattern in BPIC2019 (only two handover-to-TT p-values below 0.05 among the ten HB/HI-to-TT tests, at l=21 p=0.039 and l=2 p=0.031) is exactly what multiple testing would produce. Moreover, Figure 2c shows roughly equal selection frequencies across all lags for BPIC2011, so the decision to use the first five lags {1,2,3,4,5} is arbitrary and does not identify an influential set. The causal conclusion in Section 6 is not secured until a holdout period or nested data-splitting is used and the selection step is accounted for.
- [Section 5.2 and Section 6] Hypothesis 2 is reported as satisfied at 55.55% (BPIC2017), 50% (BPIC2019), and 53.33% (BPIC2011), and Section 6 states that 'one-directionality was satisfied in all datasets.' These percentages are indistinguishable from chance and do not provide evidence for one-directional Granger causality. The denominator of 'significant cases' is never defined (per pair, per lag, or per graph edge), and no confidence interval or null model is given. The reverse-direction test should be reported for all tested pairs, not only those where the forward test was significant, and the asymmetry rate should be compared with the null expectation.
- [Section 2.3 and Section 4.1] The behavioral time series are event-date counts, while TT(d) is the average duration of cases started on day d. Consequently, X_{t-l} describes handovers occurring before the cases whose outcome is Y_t begin, so the causal statement that past handovers Granger-cause later changes in TT mixes event-date and case-start-date alignment. The authors should clarify whether the intended mechanism is a system-level workload effect; if the claim is per-case causality, the KPI series should be aligned to the completion date or to the relevant case cohort.
- [Section 5.2 and Table 2] The selected lag set for BPIC2019 is reported as {2,10,11,19,2}, which contains a duplicate and omits 21, yet Table 2 reports results at l=21. In addition, the text says 'I → %OP shows significance' for BPIC2019, but Table 2 uses %GR as the outcome. These inconsistencies make the results non-reproducible as printed and must be corrected.
- [Section 2.2 and Section 6] The handover classification assumes that each actor performs one task at a time and that tasks are atomic events; the discussion acknowledges this but provides no sensitivity analysis. Since the headline finding is that handovers, especially HB, affect throughput time, a systematic misclassification due to timestamp granularity or multi-tasking could create or mask the effect. A robustness check using coarsened timestamps or excluding uncertain transitions would significantly strengthen the claim.
minor comments (6)
- [Section 4.3] The F-statistic uses L both as the number of lags in the numerator and in the degrees of freedom; please state explicitly whether each test uses a single lag or the full selected lag set, since the tables report p-values per lag.
- [Section 5.1] The roles of lambda_g and lambda_1 should be defined more explicitly in terms of the Group Lasso objective; the current text relies on a standard formulation without giving the objective.
- [Table 3] The header contains a stray period in 'HB → %OP .'; it should read 'HB → %OP'.
- [Section 6] The phrase 'one-directionality was satisfied in all datasets' conflicts with the percentages reported in Section 5.2; after reanalysis, a weaker statement such as 'reverse causality was detected in no more than chance proportion' would be appropriate.
- [Figure 4] The caption says 'causality graph' but does not define the threshold or ranking used for the 'top 10 most significant influences'; a legend with edge weights or p-value labels would improve interpretability.
- [Abstract and Section 6] The phrase 'direct and measurable impacts' is stronger than what Granger causality can establish; 'temporal predictive relationships' would be more accurate.
Circularity Check
No circularity; the behavior-to-TT link is an empirical Granger test whose time series are constructed independently of each other.
full rationale
This paper is an empirical study, not a derivation: actor-behavior time series (C, I, HI, HB counts) and performance time series (daily average throughput time and outcome fractions) are both extracted from the same event logs, but neither is defined in terms of the other, and no fitted parameter is used to construct the target series. The claim that handovers influence TT (Discussion: 'The most consistent finding is the strong causal influence of handovers, both HB and HI, on TT') is a summary of Granger F-test p-values, not a quantity that is equal to its inputs by construction. The behavioral taxonomy is attributed to prior external work [11] with no author overlap with this paper; the only author-overlapping citations ([16] and [17]) concern agent-system mining context and a visualization tool, respectively, and neither is load-bearing for the central result. The Group Lasso lag selection is performed on the same data later used for the F-tests, and Hypothesis 2 support is near chance (55.55%, 50%, 53.33%), but these are statistical-validity and evidence-strength concerns, not circularity under the definitions used here. No equation, definition, or fitted parameter reduces the claimed finding to its own inputs.
Assumptions & free parameters
free parameters (3)
- Maximum lag window M =
22 days
- Number of selected lags k =
5
- Significance threshold =
0.05
assumptions (5)
- domain assumption The actor behavior classification (C, I, HI, HB) based on consecutive events within a case correctly captures meaningful interaction types.
- domain assumption Daily aggregation of event counts and throughput times preserves the temporal dynamics relevant to process performance.
- domain assumption Granger causality on stationary, linear, bivariate time series can uncover causal influences between actor behavior and performance.
- domain assumption Actors work on a single task at a time and timestamps are precise enough to determine busy or idle states.
- standard math Standard statistical properties of the ADF test, F-test, and Group Lasso hold for the constructed time series.
Cite this review
Pith. "Pith review of Linking Actor Behavior to Process Performance Over Time." pith.science (2026). https://pith.science/paper/YYHUXQY5
@misc{pith2026250723037,
  author       = {Pith},
  title        = {Pith review of: Linking Actor Behavior to Process Performance Over Time},
  year         = {2026},
  howpublished = {\url{https://pith.science/paper/YYHUXQY5}},
  note         = {Machine review of arXiv:2507.23037}
}
read the original abstract
Understanding how actor behavior influences process outcomes is a critical aspect of process mining. Traditional approaches often use aggregate and static process data, overlooking the temporal and causal dynamics that arise from individual actor behavior. This limits the ability to accurately capture the complexity of real-world processes, where individual actor behavior and interactions between actors significantly shape performance. In this work, we address this gap by integrating actor behavior analysis with Granger causality to identify correlating links in time series data. We apply this approach to realworld event logs, constructing time series for actor interactions, i.e. continuation, interruption, and handovers, and process outcomes. Using Group Lasso for lag selection, we identify a small but consistently influential set of lags that capture the majority of causal influence, revealing that actor behavior has direct and measurable impacts on process performance, particularly throughput time. These findings demonstrate the potential of actor-centric, time series-based methods for uncovering the temporal dependencies that drive process outcomes, offering a more nuanced understanding of how individual behaviors impact overall process efficiency.
Figures


Figures from the paper (1 more)

Reference graph
Works this paper leans on
-
[11]
In: 2024 6th International Conference on Process Mining (ICPM)
Klijn, E.L., Tentina, I., Fahland, D., Mannhardt, F.: Decomposing process performance based on actor behavior. In: 2024 6th International Conference on Process Mining (ICPM). pp. 129–136 (2024).https://doi.org/10.1109/ICPM63005.2024.10680657
-
[8]
Hompes, B., Maaradji, A., La Rosa, M., Dumas, M., Buijs, J., Aalst, W.: Discovering causal factors explaining business process performance variation. pp. 177–192 (05 2017). https://doi.org/10.1007/978-3-319-59536-8_12
-
[1]
van der Aalst, W.M.P.: Process Mining: A 360 Degree Overview, pp. 3–34. Springer Inter- national Publishing, Cham (2022).https://doi.org/10.1007/978-3-031-08848-3_1 12 A. Leribaux et al
-
[2]
In: 2019 IEEE 23rd International Enterprise Distributed Object Computing Workshop (EDOCW)
Bemthuis, R.H., Koot, M., Mes, M.R.K., Bukhsh, F.A., Iacob, M.E., Meratnia, N.: An agent-based process mining architecture for emergent behavior analysis. In: 2019 IEEE 23rd International Enterprise Distributed Object Computing Workshop (EDOCW). pp. 54–64 (2019).https://doi.org/10.1109/EDOCW.2019.00022
arXiv 2019
-
[3]
In: International Conference on Process Mining
Benzin, J.V., Rinderle-Ma, S.: Towards standardized modeling of collaboration processes in collaboration process discovery. In: International Conference on Process Mining. pp. 171–183. Springer (2024)
work page 2024
-
[4]
Software and Systems Modeling23, 1323–1343 (02 2024)
Corradini, F., Pettinari, S., Re, B., Rossi, L., Tiezzi, F.: A technique for discovering bpmn collaboration diagrams. Software and Systems Modeling23, 1323–1343 (02 2024). https://doi.org/10.1007/s10270-024-01153-5
-
[5]
Process Mining Handbook448, 274–319 (2022)
Fahland, D.: Process mining over multiple behavioral dimensions with event knowledge graphs. Process Mining Handbook448, 274–319 (2022)
work page 2022
-
[6]
INFORMS Journal on Computing29, 438–456 (08 2017).https://doi.org/10.1287/ijoc.2016.0739
Fan, S., Li, X., Zhao, J.: Collaboration process pattern approach to improving teamwork performance: A data mining-based methodology. INFORMS Journal on Computing29, 438–456 (08 2017).https://doi.org/10.1287/ijoc.2016.0739
Show all 16 references
-
[7]
Econometrica37(3), 424–438 (1969)
Granger, C.: Investigating causal relations by econometric models and cross-spectral methods. Econometrica37(3), 424–438 (1969)
1969
-
[9]
Engineering Ap- plications of Artificial Intelligence 126, 106765 (2023)
Jooken, L., Depaire, B., Jans, M.: Mining recency–frequency–monetary enriched insights into resources’ collaboration behavior from event data. Engineering Ap- plications of Artificial Intelligence 126, 106765 (2023). https://doi.org/https: //doi.org/10.1016/j.engappai.2023.106765
2023
-
[12]
The Stata Journal 18(4), 804–818 (2018)
Lopez, A., Weber, E.: Testing for granger causality in panel data. The Stata Journal 18(4), 804–818 (2018)
2018
-
[13]
International Journal of Data Science and Analytics17, 1–14 (07 2023).https://doi.org/10.1007/s41060-023-00411-x
Pavasant, N., Morita, T., Numao, M., Fukui, K.i.: Granger causality-based cluster sequence mining for spatio-temporal causal relation mining. International Journal of Data Science and Analytics17, 1–14 (07 2023).https://doi.org/10.1007/s41060-023-00411-x
2023 doi
-
[14]
Schubert, P., Blatt, J., Just, M., Delfmann, P.: Social process mining: Deriving collaborative work processes from the event data of enterprise collaboration systems (2024)
2024
-
[15]
An- nual Review of Statistics and Its Application9(Volume 9, 2022), 289–319 (2022)
Shojaie, A., Fox, E.B.: Granger causality: A review and recent advances. An- nual Review of Statistics and Its Application9(Volume 9, 2022), 289–319 (2022). https://doi.org/https://doi.org/10.1146/annurev-statistics-040120-010930
2022 doi
-
[16]
IEEE Access9, 99480–99494 (2021).https://doi.org/10.1109/ACCESS
Tour, A., Polyvyanyy, A., Kalenkova, A.: Agent system mining: Vision, benefits, and challenges. IEEE Access9, 99480–99494 (2021).https://doi.org/10.1109/ACCESS. 2021.3095464
2021
-
[17]
In: Di Francescomarino, C., Burattin, A., Janiesch, C., Sadiq, S
Wuyts, B., Weytjens, H., vanden Broucke, S., De Weerdt, J.: Dylopro: Profiling the dynam- ics of event logs. In: Di Francescomarino, C., Burattin, A., Janiesch, C., Sadiq, S. (eds.) Business Process Management. pp. 146–162. Springer Nature Switzerland, Cham (2023)
2023
Reviewed August 6, 2026 · model on record in the stance chip above.
Discussion (0). Sign in to comment.