CIExplainer++: Generating Causal and Interpretable Explanations for Graph Neural Networks
Pith reviewed 2026-06-26 20:35 UTC · model grok-4.3
The pith
CIExplainer identifies the subgraph with the highest causal effects on GNN predictions using the Potential Outcome Framework.
A machine-rendered reading of the paper's core claim, the machinery that carries it, and where it could break.
Core claim
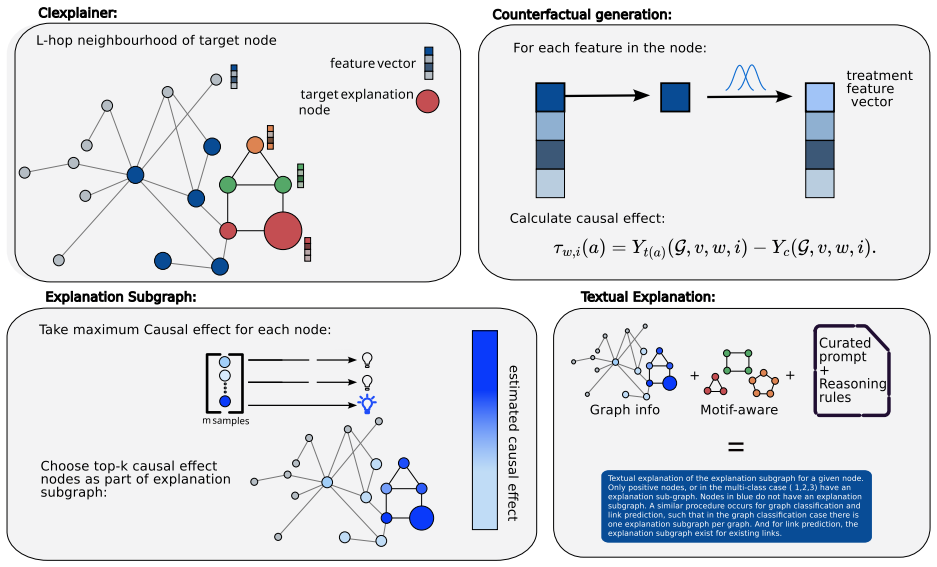
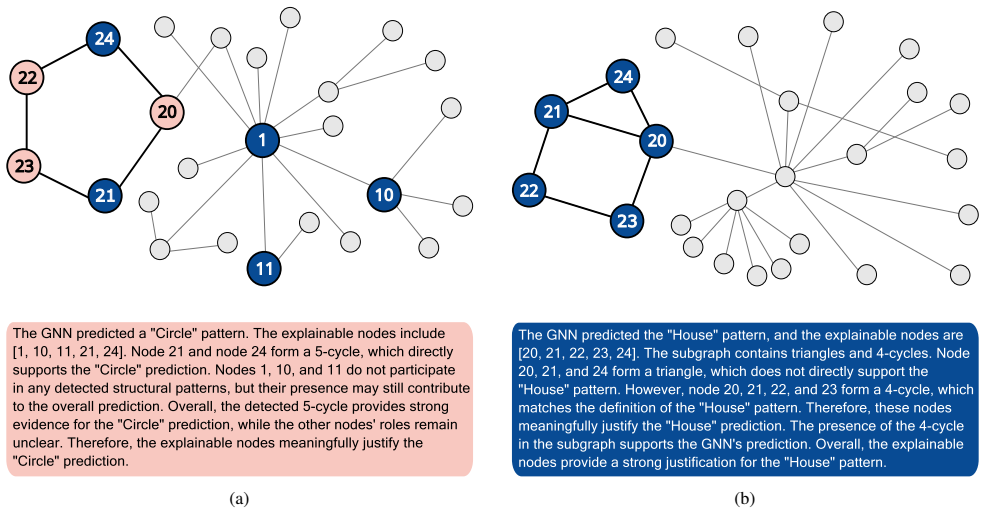
CIExplainer identifies the subgraph with the highest causal effects on GNN predictions using the Potential Outcome Framework. To bridge subgraph explanations with human interpretability, G2TeXplainer transforms causal subgraphs into natural language explanations that capture both feature-level and relational information.
What carries the argument
The Potential Outcome Framework applied via perturbations to isolate causal subgraph effects on GNN predictions.
If this is right
- Explanations are based on causal effects measured through the potential outcomes framework.
- The method is tested on GCN, GraphSAGE, GAT, and GIN architectures.
- Causal subgraphs are converted to natural language for interpretability.
Where Pith is reading between the lines
- Causal explanations may help identify biases in GNN training data or structure.
- The method could be adapted for other types of graph models or tasks.
- It opens the possibility of using causal subgraph analysis to improve model robustness.
Load-bearing premise
That the potential outcome framework can be directly applied to graph data via perturbations to isolate causal subgraph effects without additional unstated assumptions about interference, counterfactual definition, or hidden variables in the graph structure.
What would settle it
Observing that the subgraphs found by CIExplainer do not lead to larger changes in GNN predictions compared to those found by non-causal methods when the same perturbation is applied across multiple datasets.
Figures

read the original abstract
Explainable Artificial Intelligence aims to make black-box models more trustworthy by presenting, in a human-understandable manner, the elements that lead to the model's output. This involves both (i) identifying components and connections with genuine causal influence on outputs and (ii) translating such structures into an interpretable representation. For the former, we introduce CIExplainer, a novel perturbation-based method grounded in causal inference for explaining Graph Neural Networks (GNNs). CIExplainer identifies the subgraph with the highest causal effects on GNN predictions using the Potential Outcome Framework. We evaluate and compare CIExplainer on various GNN architectures (GCN, GraphSAGE, GAT, GIN) and datasets. To bridge subgraph explanations with human interpretability, we further propose G2TeXplainer, a method that transforms causal subgraphs into natural language explanations that capture both feature-level and relational information.
Editorial analysis
A structured set of objections, weighed in public.
Referee Report
Summary. The paper introduces CIExplainer, a perturbation-based explainer for GNNs that identifies the subgraph with maximal causal effect on model predictions via the Potential Outcome Framework. It additionally proposes G2TeXplainer to convert the identified causal subgraphs into natural-language explanations incorporating both node features and relational structure. The approach is evaluated across GCN, GraphSAGE, GAT and GIN architectures on multiple datasets.
Significance. A sound causal identification procedure that respects graph-specific dependence structures would strengthen the reliability of subgraph explanations relative to purely correlational perturbation methods. The natural-language translation component could improve human interpretability if the underlying causal subgraphs are correctly recovered.
major comments (1)
- [Abstract / Method] Abstract and method description: the central claim that CIExplainer isolates the subgraph with the highest causal effect rests on direct application of the Potential Outcome Framework to graph perturbations. The manuscript provides no indication that counterfactuals are defined in a manner that respects the message-passing dependencies of GNNs or that the Stable Unit Treatment Value Assumption (SUTVA) is maintained; node interference through edges is therefore unaddressed and load-bearing for the causal interpretation.
minor comments (1)
- The abstract states that evaluations were performed but reports neither quantitative metrics nor baseline comparisons; adding a concise summary of key results (e.g., fidelity or causal-effect scores) would improve the abstract.
Simulated Author's Rebuttal
We thank the referee for the constructive feedback on the causal foundations of our approach. We respond to the major comment below.
read point-by-point responses
-
Referee: [Abstract / Method] Abstract and method description: the central claim that CIExplainer isolates the subgraph with the highest causal effect rests on direct application of the Potential Outcome Framework to graph perturbations. The manuscript provides no indication that counterfactuals are defined in a manner that respects the message-passing dependencies of GNNs or that the Stable Unit Treatment Value Assumption (SUTVA) is maintained; node interference through edges is therefore unaddressed and load-bearing for the causal interpretation.
Authors: We agree that the manuscript does not explicitly discuss the definition of counterfactuals with respect to GNN message-passing dependencies or address potential violations of SUTVA arising from node interference via edges. This is a substantive point for the causal claims. In the revised version we will add a new subsection to the Methods section that (i) formally defines the potential outcomes under subgraph perturbation, (ii) states the maintained assumptions including the approximation that treats the selected subgraph as the treatment unit while holding the remainder of the graph fixed, and (iii) acknowledges that edge-mediated interference may violate SUTVA and is therefore a limitation of the current causal interpretation. We will also update the abstract to reflect this clarification. revision: yes
Circularity Check
No circularity detected; derivation applies standard causal framework without self-reduction
full rationale
The provided abstract and description introduce CIExplainer as a perturbation-based method using the Potential Outcome Framework to identify high-causal-effect subgraphs for GNN explanations, followed by G2TeXplainer for natural language translation. No equations, parameter fits, self-citations, or uniqueness theorems are quoted that reduce the central claim to its own inputs by construction. The approach is presented as an application of existing causal inference tools to graph perturbations, remaining self-contained against external benchmarks without load-bearing self-referential steps.
Axiom & Free-Parameter Ledger
Reference graph
Works this paper leans on
-
[1]
From nodes to narratives: Explain- ing graph neural networks with llms and graph context
Peyman Baghershahi, Gregoire Fournier, Pranav Nyati, and Sourav Medya. From nodes to narratives: Explain- ing graph neural networks with llms and graph context. arXiv:2508.07117,
-
[2]
ISSN 2666-6758. doi: doi.org/10. 1016/j.xinn.2025.101253. Will Hamilton, Zhitao Ying, and Jure Leskovec. Inductive representation learning on large graphs.Advances in neural information processing systems, 30,
arXiv 2025
-
[3]
doi: 10.1109/TKDE.2022.3187455
ISSN 1041-4347. doi: 10.1109/TKDE.2022.3187455. Guangyin Jin, Qi Wang, Cunchao Zhu, Yanghe Feng, Jincai Huang, and Jiangping Zhou. Addressing crime situation forecasting task with temporal graph convolutional neural network approach. In2020 12th International Conference on Measuring Technology and Mechatronics Automation (ICMTMA), pages 474–478,
-
[4]
Causal inference explanations for graph neural networks
Francisco Caldas Sahil Kumar and Claudia Soares. Causal inference explanations for graph neural networks. In9th Causal Inference Workshop at UAI 2024,
2024
-
[5]
Avanti Shrikumar, Peyton Greenside, Anna Shcherbina, and Anshul B Kundaje
URL https: //www.rand.org/content/dam/rand/pubs/ research_memoranda/2008/RM670.pdf. Avanti Shrikumar, Peyton Greenside, Anna Shcherbina, and Anshul B Kundaje. Not just a black box: Learning impor- tant features through propagating activation differences. ArXiv, abs/1605.01713,
Pith/arXiv arXiv 2008
-
[6]
Karen Simonyan, Andrea Vedaldi, and Andrew Zisserman. Deep inside convolutional networks: Visualising image classification models and saliency maps.arXiv preprint arXiv:1312.6034,
-
[7]
URL https://goo. gle/Gemma3Report. Filipa Valdeira, Stevo Rackovi´c, Valeria Danalachi, Qiwei Han, and Cláudia Soares. Extreme multilabel classifica- tion for specialist doctor recommendation with implicit feedback and limited patient metadata.arXiv preprint arXiv:2308.11022,
-
[8]
A Comprehensive Survey on Graph Neural Networks,
Chenyu Wang, Zongyu Lin, Xiaochen Yang, Jiao Sun, Mingxuan Yue, and Cyrus Shahabi. Hagen: Homophily- aware graph convolutional recurrent network for crime forecasting. InProceedings of the AAAI Conference on Artificial Intelligence, volume 36, pages 4193–4200, 2022a. Xiang Wang, Ying Xin Wu, An Zhang, Fuli Feng, Xiang- nan He, and Tat seng Chua. Reinforce...
-
[9]
Zhitao Ying, Dylan Bourgeois, Jiaxuan You, Marinka Zitnik, and Jure Leskovec
doi: 10.1109/TKDE.2022.3148299. Zhitao Ying, Dylan Bourgeois, Jiaxuan You, Marinka Zitnik, and Jure Leskovec. Gnnexplainer: Generating explana- tions for graph neural networks.Advances in neural information processing systems, 32,
-
[10]
Beyond Yes and No: Improving Zero-Shot Pointwise LLM Rankers via Scoring Fine-Grained Relevance Labels
Honglei Zhuang, Zhen Qin, Kai Hui, Junru Wu, Le Yan, Xuanhui Wang, and Michael Bendersky. Beyond Yes and No: Improving Zero-Shot Pointwise LLM Rankers via Scoring Fine-Grained Relevance Labels . InProceedings of the 2024 Conference of the North American Chapter of the Association for Computational Linguistics (NAACL),
2024
-
[11]
BA-2motif.On this synthetic motif-based dataset, CIExplainer achieves the highest or second-highest IoU and precision for GCN, GIN, and GraphSAGE backbones
Supplementary Material Francisco Caldas1 Sahil Satish Kumar1 Ruben Belo1 Cláudia Soares1 1NOV A LINCS, NOV A School of Science and Technology, Lisbon, Portugal A GRAPH CLASSIFICATION EXPLAINATION RESULTS Table 5 reports detailed explanation performance for graph classification across backbone architectures and datasets. BA-2motif.On this synthetic motif-b...
2020
-
[12]
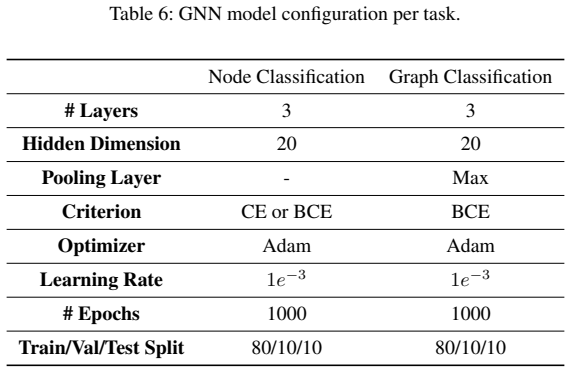
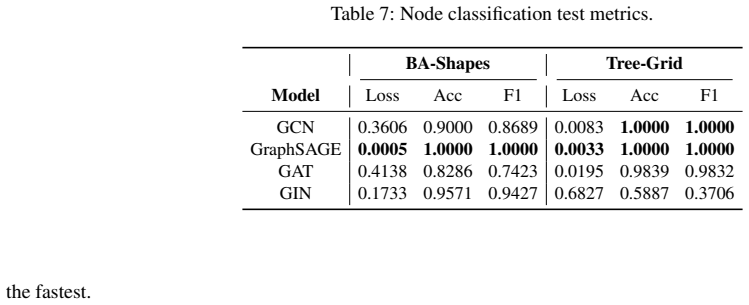
The perfect accuracy results are to be expected, since the features of these datasets are specially created to make it easier for the model to learn and predict. GraphSAGE again has the lowest loss on the test set, and trains Table 6: GNN model configuration per task. Node Classification Graph Classification # Layers3 3 Hidden Dimension20 20 Pooling Layer...
discussion (0)
Sign in with ORCID, Apple, or X to comment. Anyone can read and Pith papers without signing in.