REVIEW 2 major objections 4 minor 17 references
This paper claims that a two-stage surrogate pipeline—principal component analysis to compress spatial flood maps, followed by Gaussian process regression on the compressed coefficients—makes uncertainty propagation and global sensitivity a
Reviewed by Pith at T0; open to challenge. T0 means a machine referee read the full paper against a public rubric. the ladder, T0–T4 →
T0 review · deepseek-v4-flash
2026-08-01 12:49 UTC pith:Z6OFRTS5
load-bearing objection A competent and transparent first application of PCA+GPR surrogate UQ/GSA to tailings dam-breach flows — the methodology holds up, but the headline downstream yield-stress claim is more conditional than the sensitivity maps suggest. the 2 major comments →
Metamodel-based methodology for uncertainty propagation and global sensitivity analysis of tailings dam-breach flows
The pith
A machine-rendered reading of the paper's core claim, the machinery that carries it, and where it could break.
Core claim
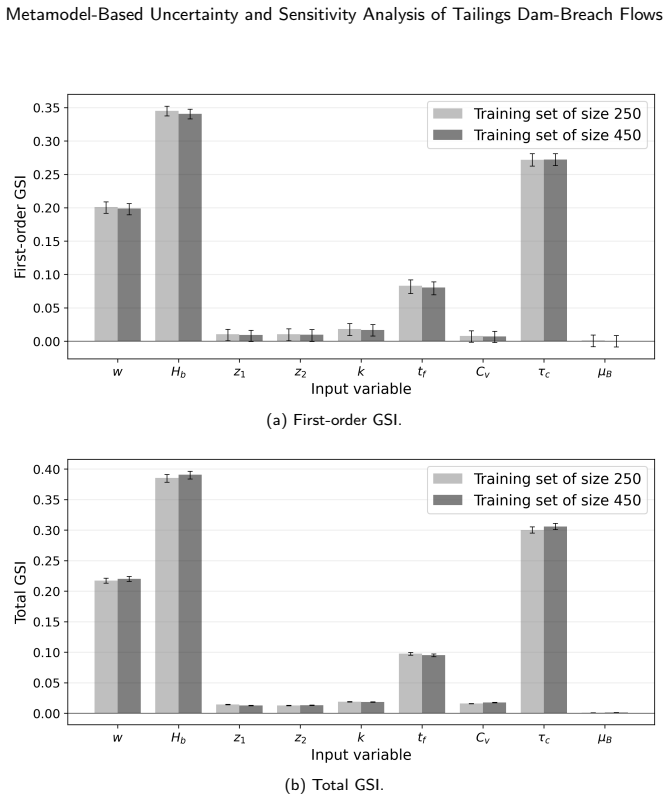
On the paper's own terms, the contribution is a modular, non-intrusive probabilistic framework: build a training design of 250 input scenarios, run HEC-RAS once per scenario, compress the resulting depth and arrival-time maps with PCA (15 components explain 99% of depth variance; 40 explain about 94% of arrival-time variance after mean imputation), train an independent Gaussian-process regressor on each component, then reconstruct arbitrary new maps at negligible cost. Sobol indices are then estimated with pick-freeze schemes—basis-derived for depth maps, dimension-wise for arrival times—and validated as stable against training-set size, pick-freeze sample size, and a 250-scenario validation
What carries the argument
Principal component analysis provides a linear basis expansion of the high-dimensional output maps; one Gaussian process regressor (Matérn 5/2 kernel, per-input length scales, marginal-likelihood tuning) is trained on each retained coefficient. Uncertainty propagation uses the reconstructed posterior-mean maps; Sobol–Hoeffding variance decomposition is estimated by pick-freeze schemes, with a basis-derived formula that projects coefficient covariance matrices back through the PCA basis (used for depth maps) and a dimension-wise formula that operates on reconstructed maps (used for arrival-time maps, whose NaN handling—mean imputation plus recovery of the wet/dry interface from predicted dept
Load-bearing premise
The load-bearing premise is that the surrogate's posterior-mean predictions are accurate enough in every cell—including downstream and boundary cells where validation quality is lower—for the Sobol indices and output distributions to be trustworthy, with bootstrap intervals that ignore PCA truncation and GPR error; secondarily, the uniform ranges assigned to breach and rheology inputs are assumed to be the true epistemic ranges.
What would settle it
Pick a downstream cell where the validation Q2 is lowest, compute the first-order Sobol index for yield stress directly from the 250 held-out HEC-RAS runs via a pick-freeze scheme applied to the simulator itself, and compare with the surrogate-derived index. If the difference exceeds the reported bootstrap confidence interval in that cell, the surrogate-based sensitivity map for the downstream region is not reliable.
If this is right
- Flood-hazard maps that show flooding probability and quantile depth/arrival-time bands become routine products, since 10,000 scenarios cost essentially nothing once the surrogate is trained.
- Because the framework is non-intrusive, the same pipeline can wrap any deterministic flood-routing model, and any map-type output (velocity, shear stress, damage) can be substituted for depth and arrival time.
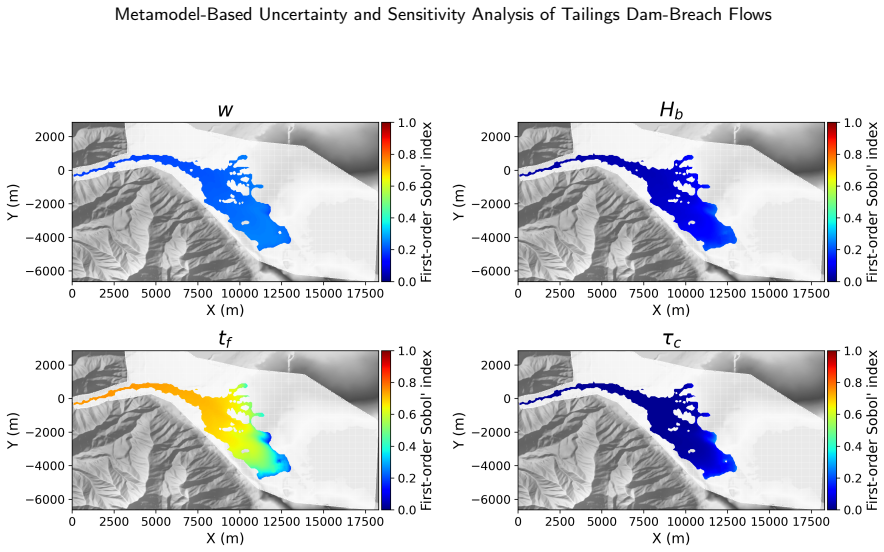
- The sensitivity maps single out where data collection would reduce uncertainty most: upstream breach-parameter characterization near the dam, rheometric measurement of yield stress toward the downstream end.
- Arrival-time control by breach formation time motivates putting effort into estimating the breach hydrograph timing for early-warning systems.
- The wet/dry boundary treatment means that 'always flooded' cells receive well-defined arrival-time Sobol indices; cells that sometimes flood are excluded, so the map of arrival-time sensitivity is restricted.
Where Pith is reading between the lines
- The decisive test is off-benchmark: for a real site, the fixed input ranges and the terrain-specific training set would need to be redrawn and validated with fresh HEC-RAS runs, so the claimed speed-up is credible only after that validation.
- The reported bootstrap intervals measure pick-freeze sampling variability conditional on the surrogate; total uncertainty would be larger once PCA truncation and GPR prediction error are propagated (the paper itself flags this as a limitation).
- The two-regime sensitivity pattern gives a physically testable prediction for real breach events: near-field inundation should correlate with breach geometry, whereas downstream runout limit should correlate with yield stress, which could be checked against back-analyses of past tailings dam failures.
- A cheaper extension would be to train the surrogate directly on flooding probability (a binary map) instead of thresholding predicted depths, which could cover the transition zone more honestly.
Editorial analysis
A structured set of objections, weighed in public.
Referee Report
Summary. The paper develops a non-intrusive probabilistic framework for tailings dam-breach analysis (TDBA) that combines principal component analysis (PCA) with Gaussian process regression (GPR) to predict high-dimensional HEC-RAS outputs (maximum flow depth and arrival time maps), and then uses variance-based global sensitivity analysis to produce spatially distributed Sobol maps. The methodology is demonstrated on the ICOLD benchmark test case with 500 stochastic simulations (250 training, 250 validation). The authors report that breach parameters dominate uncertainty near the dam, while yield stress dominates farther downstream, and they provide flooding-probability maps, cross-sectional distributions, and generalized sensitivity indices. The paper includes validation checks for training-set size, PF sample size, PCA explained variance, and spatially resolved Q2 metrics.
Significance. If the claims hold, the paper makes a useful applied contribution by showing that a standard PCA+GPR surrogate can make probabilistic TDBA computationally tractable, and by providing sensitivity maps that give spatially resolved physical insight into a dam-breach hazard problem. The manuscript is transparent about many methodological choices and ships a substantial validation effort: 250 held-out scenarios, independent validation of predictions via Q2, training-size checks, and PF sample-size checks. The main caveat is that the headline sensitivity conclusions are derived from GPR posterior means, and the reported confidence intervals exclude PCA truncation and GPR prediction error; this is acknowledged but remains a load-bearing limitation because the downstream yield-stress dominance claim appears in cells where Q2 is low.
major comments (2)
- [§3.2.2, §4 (first paragraph), Appendix B (Fig. 17a)] The bootstrap confidence intervals on the sensitivity indices condition on the trained metamodel and do not include PCA truncation error or GPR prediction error, as the authors explicitly state. This is not just a theoretical caveat: the headline result that yield stress dominates far downstream is located in the cells where Fig. 17a shows lower Q2 values, and the sensitivity maps in Fig. 6 are medians of GPR posterior means. Consequently, the claimed breach-parameter to yield-stress transition could in principle be an artifact of surrogate error in those cells. I do not see a formal inconsistency, but the central physical conclusion needs a robustness check. Please add one of the following: (i) propagate GPR predictive uncertainty and PCA truncation into the Sobol confidence bounds; (ii) compare the GPR-based Sobol ranking against direct HEC-RAS evaluations on the 250 held-out scenarios
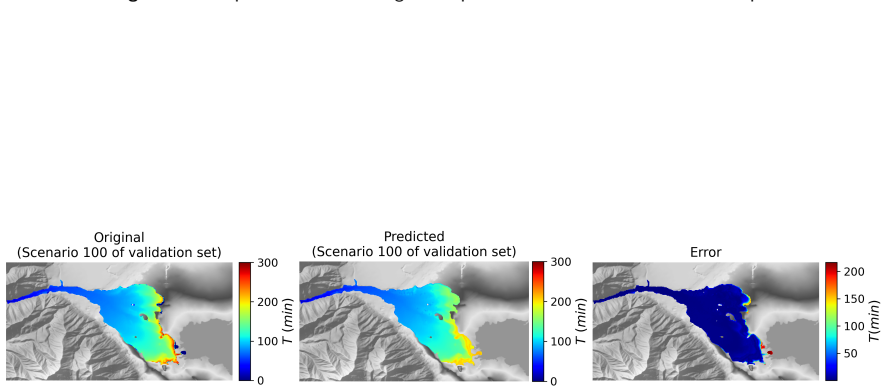
- [§3.2.3, Appendix A, Appendix B (Fig. 18b)] The arrival-time analysis relies on mean imputation of NaN values, PCA with n_b=40 that explains only about 95% of variance, and masking by predicted depth maps. Appendix A reports that errors are largest near the wet-dry interface. Restricting the arrival-time Sobol maps to always-flooded cells mitigates the interface problem, but there is no check that the choice n_b=40 or the imputation step does not change the generalized sensitivity indices or sensitivity-map rankings. Since the arrival-time conclusions (e.g., t_f dominance) are based on this preprocessing chain, the authors should add a sensitivity analysis over n_b and/or compare the current imputation-based results with an alternative treatment (e.g., weighted PCA or retaining additional components). Without this, the arrival-time sensitivity conclusions are conditional on an untested preprocessing choice.
minor comments (4)
- [Eq. (3.7)] The notation v_{.,l} is not defined explicitly. Please clarify that it denotes the l-th column of V^T, i.e., the vector of l-th output-coordinate loadings across the retained principal components.
- [Table 1] The justification column for w, z1, and z2 only says 'Geometry constraint'. A sentence explaining the admissible physical ranges would increase confidence in the chosen uniform supports.
- [Page footers] The running footer 'Y.T. Sáo: Preprint submitted to Elsevier' appears throughout the manuscript and should be removed for journal submission.
- [Data availability] The statement 'Data will be made available on request' is vague. A repository with the simulated maps and code would strengthen reproducibility, especially given the paper's emphasis on a modular framework.
Circularity Check
No significant circularity: sensitivity results are computed from independently validated metamodel predictions, not from fitted targets or self-referential definitions.
full rationale
The paper's derivation chain is not circular. The target quantities (maximum flow depth, arrival time, Sobol/GSA maps) are never used as inputs to fit the PCA+GPR metamodel: the metamodel is trained on a 250-scenario LHS training set and checked against a separate 250-scenario validation set (§3.1, Appendix B), so the reported Q2 scores are genuine held-out predictions. The Sobol indices are computed from GPR posterior means at new pick-freeze sample points (§3.3, §4), with the input distributions fixed a priori in Table 1; no sensitivity index is fitted to reproduce a desired map. The basis-derived GSI formulas (Eqs. 3.7-3.8) are mathematical identities for a linear basis expansion, not empirical results tailored to this case. Self-citations to Sáo et al. (2025a, 2025b) supply methodological background and future error-propagation avenues, but the core benchmark conclusion — breach parameters near the dam and yield stress downstream — is obtained from the trained model on independent samples rather than imported from those citations. The paper transparently acknowledges that PCA and GPR errors are not propagated into the bootstrap confidence bounds (§3.2.2, §4) and that downstream/boundary cells have lower Q2 (Appendix B); these are accuracy and uncertainty-quantification limitations, not circular reasoning. No predicted quantity reduces by construction to a fitted parameter or to a self-citation chain.
Axiom & Free-Parameter Ledger
free parameters (4)
- GPR hyperparameters (Matérn 5/2 length scales, kernel variance, noise variance for each retained coefficient) =
Estimated per coefficient by maximum marginal likelihood using GPflow/SciPy
- Uniform input-distribution supports from Table 1 =
Hb∈[220,250] m; w∈[0.01,100] m; z1,z2∈[0.1,2.0]; tf∈[0.08,2.0] h; k∈[1.1,1.8]; τc∈[1,200] Pa; μB∈[0.1,15] Pa·s; Cv∈[20,6
- PCA truncation size n_b =
15 components for maximum depth (99% variance); 40 components for arrival times (~95% variance)
- Flooding threshold H_f =
0.31 m
axioms (6)
- standard math Sobol–Hoeffding decomposition of the simulator output exists and pick-freeze estimators are unbiased for mutually independent inputs
- domain assumption One-phase shallow-water equations with Bingham rheology in HEC-RAS adequately represent low-to-medium concentration tailings dam-breach flows
- domain assumption The nine uncertain inputs are mutually independent
- domain assumption Uniform PDFs on the chosen supports correctly represent epistemic uncertainty in breach and rheological parameters
- ad hoc to paper GPR posterior means are accurate enough for GSA; PCA truncation and GPR prediction errors are negligible
- ad hoc to paper Mean imputation of arrival-time NaNs plus masking by predicted depth maps recovers the flooded region and wet-dry interface
read the original abstract
Tailings dam-breach analyses are essential for flood-hazard assessment, emergency planning and risk estimation, but their results are strongly affected by uncertainties in breach development, released volume and tailings rheology. This study proposes an efficient probabilistic methodology that integrates uncertainty quantification and global sensitivity analysis for tailings dam-breach studies. High-dimensional outputs (spatial maps) and the computational cost of deterministic simulations are addressed through dimensionality reduction and metamodeling. The methodology is demonstrated on a benchmark case with complex terrain using HEC-RAS v6.6 and considering uncertainties in breach parameters and rheological properties. The results quantify uncertainty in maximum flow depth and arrival time, characterize their statistical distributions and identify the spatial influence of the main input variables through sensitivity maps. Sensitivity indices reveal the dominance of breach parameters near the dam and yield stress farther downstream. The modular and non-intrusive framework can be coupled with other deterministic models and applied to different dam-breach scenarios, supporting more standardized and risk-informed assessments.
Figures







Reference graph
Works this paper leans on
-
[7]
SIAM/ASA Journal on Uncertainty Quantification 2, 336–363
A bayesian approach for global sensitivity analysis of (multifidelity) computer codes. SIAM/ASA Journal on Uncertainty Quantification 2, 336–363. Li,M.,Wang,R.Q.,Jia,G.,2020.Efficientdimensionreductionandsurrogate-basedsensitivityanalysisforexpensivemodelswithhigh-dimensional outputs. Reliability Engineering & System Safety 195, 106725. Ligier, P.L.,
2020
-
[10]
Advances in non-newtonian dam break studies, in: Proceedings of, 22nd International Conf on Paste, Thickened and Filtered Tailings, https://papers. acg. uwa. edu. au/p/1910_09_Boshoff/. Accessed. Nagel,J.B.,Rieckermann,J.,Sudret,B.,2020. Principalcomponentanalysisandsparsepolynomialchaosexpansionsforglobalsensitivityanalysis and model calibration: Applica...
2020
-
[12]
Engineering Geology 303, 106657
A new look at the statistics of tailings dam failures. Engineering Geology 303, 106657. Piette,J.,Moud,A.A.,Poisson,J.,Derakhshandeh,B.,Hudson,Z.M.,Hatzikiriakos,S.G.,2022. Rheologyofmaturefinetailings. PhysicsofFluids
2022
-
[13]
Internationaljournalofappliedearth observation and geoinformation 90, 102119
The 2019 brumadinho tailingsdamcollapse:Possiblecauseandimpactsoftheworsthumanandenvironmentaldisasterinbrazil. Internationaljournalofappliedearth observation and geoinformation 90, 102119. Saltelli,A.,Ratto,M.,Andres,T.,Campolongo,F.,Cariboni,J.,Gatelli,D.,Saisana,M.,Tarantola,S.,2008. Globalsensitivityanalysis:Theprimer. John Wiley & Sons. Sáo,Y.T.,Pere...
arXiv 2019
-
[14]
Earth-science reviews 194, 1–18
What has global sensitivity analysis ever done for us? a systematic review to support scientific advancement and to inform policy-making in earth system modelling. Earth-science reviews 194, 1–18. Walsh,A.,McDougall,S.,Evans,S.,Take,W.,2021. Effectofupstreamdamgeometryonpeakdischargeduringovertoppingbreachinnoncohesive homogeneous embankment dams; implica...
2021
-
[15]
Journal of Geotechnical and Geoenvironmental Engineering 135, 1957–1970
Breaching parameters for earth and rockfill dams. Journal of Geotechnical and Geoenvironmental Engineering 135, 1957–1970. Zegers, G., Mendoza, P.A., Garces, A., Montserrat, S.,
1957
-
[16]
Natural Hazards and Earth System Sciences 20, 1919–1930
Sensitivity and identifiability of rheological parameters in debris flow modeling. Natural Hazards and Earth System Sciences 20, 1919–1930. Zenz, G. & Goldgruber, M.,
1919
-
[2009]
CRC press
Geotechnical engineering for mine waste storage facilities. CRC press. Boger,D.V.,2013. Rheologyofslurriesandenvironmentalimpactsintheminingindustry. Annualreviewofchemicalandbiomolecularengineering 4, 239–257. do Carmo, F.F., Kamino, L.H.Y., Junior, R.T., de Campos, I.C., do Carmo, F.F., Silvino, G., Mauro, M.L., Rodrigues, N.U.A., de Souza Miranda, M.P....
2013
-
[2012]
Relating atterberg limits to rheology, in: Paste 2012: Proceedings of the 15th International Seminar on Paste and Thickened Tailings, Australian Centre for Geomechanics. pp. 273–284. Fonseca, D.J., Navaresse, D.O., Moynihan, G.P.,
2012
-
[2013]
Benchmark workshop on numerical analysis of dams, in: ICOLD proceedings, pp. 211–220. Zhao,H.,Kowalski,J.,2020. Topographicuncertaintyquantificationforflow-likelandslidemodelsviastochasticsimulations. NaturalHazardsand Earth System Sciences 20, 1441–1461. Y.T. Sáo:Preprint submitted to ElsevierPage 17 of 17 Metamodel-Based Uncertainty and Sensitivity Anal...
2020
-
[2014]
Applied geochemistry 51, 229–245
Mine tailings dams: Characteristics, failure, environmental impacts, and remediation. Applied geochemistry 51, 229–245. Lamboni,M.,Monod,H.,Makowski,D.,2011. Multivariatesensitivityanalysistomeasureglobalcontributionofinputfactorsindynamicmodels. Reliability engineering & system safety 96, 450–459. Le Gratiet, L., Cannamela, C., Iooss, B.,
2011
-
[2016]
Journal of Hydrologic Engineering 21, 04016041
Predicting peak discharge from gradually breached embankment dam. Journal of Hydrologic Engineering 21, 04016041. Ghahramani,N.,Adria,D.A.,Rana,N.M.,Llano-Serna,M.,McDougall,S.,Evans,S.G.,Take,W.A.,2024. Analysisofuncertaintyandsensitivity in tailings dam breach-runout numerical modelling. Mine Water and the Environment 43, 87–103. Ghahramani,N.,Mitchell,...
2024
-
[2018]
Water Resources Research 54, 4376–4400
Development of probabilistic dam breach model using bayesian inference. Water Resources Research 54, 4376–4400. Petticrew,E.L.,Albers,S.J.,Baldwin,S.A.,Carmack,E.C.,Déry,S.J.,Gantner,N.,Graves,K.E.,Laval,B.,Morrison,J.,Owens,P.N.,etal.,2015. The impact of a catastrophic mine tailings impoundment spill into one of north america’s largest fjord lakes: Quesn...
2015
-
[2019]
Advances in Civil Engineering 2019, 4159306
A comprehensive review on reasons for tailings dam failures based on case history. Advances in Civil Engineering 2019, 4159306. Machado, N.C.,
2019
-
[2020]
2020 TELEMAC-MASCARET ,
Implementation of non-newtonian rheological models in telemac-2d. 2020 TELEMAC-MASCARET ,
2020
-
[2022]
Environmental Modelling & Software 152, 105398
Global sensitivity analysis in hydrodynamic modeling and flood inundation mapping. Environmental Modelling & Software 152, 105398. Beven,K.J.,Almeida,S.,Aspinall,W.P.,Bates,P.D.,Blazkova,S.,Borgomeo,E.,Freer,J.,Goda,K.,Hall,J.W.,Phillips,J.C.,etal.,2018. Epistemic uncertainties and natural hazard risk assessment–part 1: A review of different natural hazar...
2018
-
[2023]
Natural Hazards and Earth System Sciences 23, 3111–3124
Sensitivity analysis of erosion on the landward slope of an earthen flood defense located in southern france submitted to wave overtopping. Natural Hazards and Earth System Sciences 23, 3111–3124. Huang,X.,Zhang,Z.,Xiang,G.,2023. Sensitivityanalysisofabuiltenvironmentexposedtothesyntheticmonophasicviscousdebrisflowimpacts with 3-d numerical simulations. N...
2023
discussion (0)
Sign in with ORCID, Apple, or X to comment. Anyone can read and Pith papers without signing in.