REVIEW 4 major objections 8 minor 30 references
Texture and Structure Two-view Classification of Images
T0 review · 4 major / 8 minor · reviewed 2026-08-14 · deepseek-v4-flash
Pith's one-line read Two-view classification, with texture modeled as fractional Brownian motion and structure as geometry or phase, then fusing SVM decisions in a shallow network, beats single-view, concatenated, and deep baselines.
desk verdict A sensible lightweight two-view classifier with a plausible empirical win, but the fBm theory is overclaimed and the comparisons need stronger statistical grounding. read the letter →
The pith
A machine-rendered reading of the paper's core claim, the machinery that carries it, and where it could break.
The reading
What carries the argument
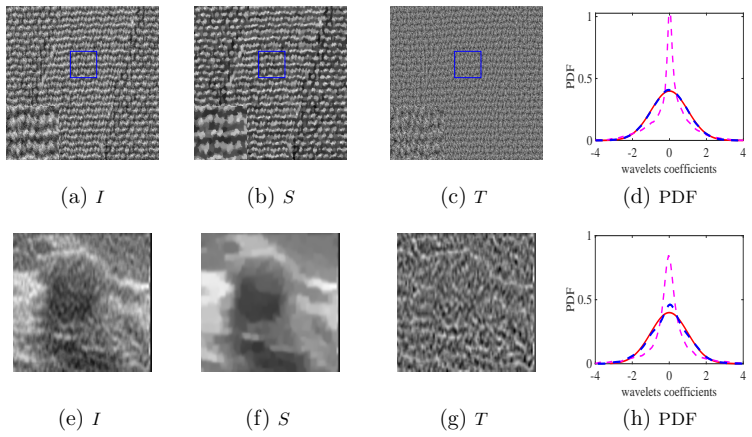
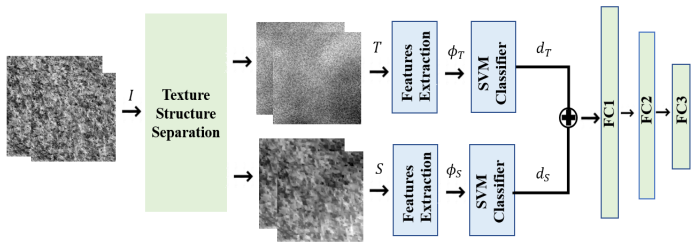
The load-bearing object is the two-view representation built from a structure-extraction decomposition: the input image is split into a structure layer and a residual texture layer. The texture view is the Hurst parameter of a 2D fractional Brownian field, estimated by linear regression of the log structure function of the residual; the structure view is a phase-or-geometry descriptor of the structural layer. The fusion mechanism is a shallow three-layer neural network whose input is the concatenation of the signed distances of each example from the two SVM hyperplanes, trained on examples held out from SVM training. This design lets the network learn how much to trust each view rather than forcing the views into a single feature vector.
What would settle it
Compute the wavelet-coefficient KL divergence on real residual layers using non-parametric density estimates instead of the Gaussian formula, and test Gaussianity on small patches; clear scale dependence or non-Gaussianity would contradict the fractional-Brownian-motion premise. A simpler control is to rerun the BUSIS experiment with a generic roughness measure, such as local variance or gradient magnitude, in place of the Hurst parameter; if accuracy is unchanged, the model assumption is not doing the work attributed to it.
Extended reading notes
Core claim
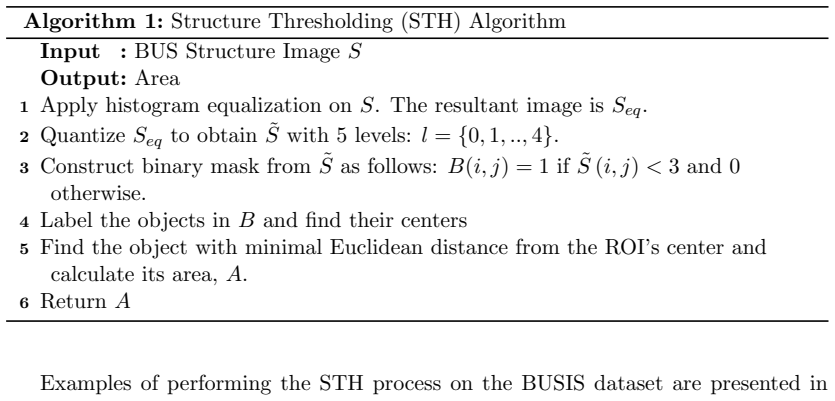
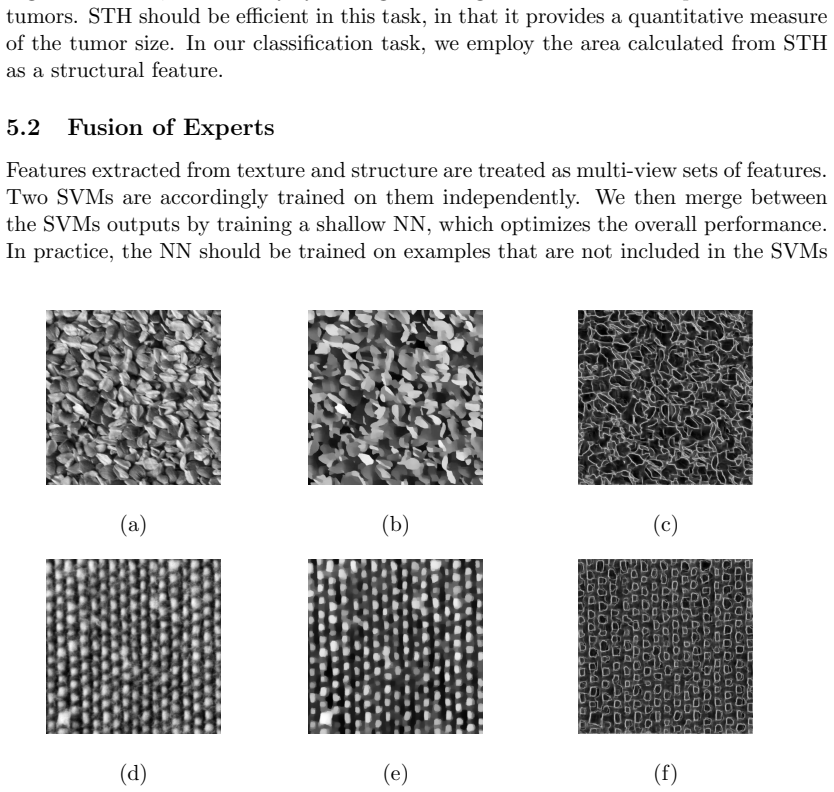
On the paper's own terms, the discovery is that late fusion of two independent classifiers, one fed by fractional-Brownian-motion-based texture features and the other by structure features, outperforms any single view and also outperforms early fusion by concatenating features. The texture view is the Hurst exponent estimated from small patches of the residual after structure extraction, under the assumption that this residual is a Gaussian, statistically self-similar natural stochastic texture; the structure view is mean phase congruency for general textures and, for breast ultrasound, the tumor area obtained by the paper's structure-thresholding algorithm. The reported accuracies are 95.7 percent on the six-class Kylberg subset, versus 76.2 percent for texture alone, 81.2 percent for structure alone, and 94 percent for concatenated features, and 91.0 percent on BUSIS, versus 82.5, 88.0, and 88.2 percent. In the head-to-head comparison on BUSIS, the method's 0.91 accuracy, 0.88 precision, 0.88 recall, and 0.87 F-measure are stated to be the best among the stacked-denoising-autoencoder and four deep networks taken from the cited comparison.
Load-bearing premise
The load-bearing premise is that the leftover layer after stripping out the structure of an image is a pure random texture that is Gaussian and statistically self-similar; if that layer still contains edges or other structure, the roughness feature used as the texture view no longer means what the model claims.
Editorial extensions
If this is right
- Each view by itself is too weak: texture alone reaches 76.2 percent and structure alone 81.2 percent on Kylberg, while the fused decision view reaches 95.7 percent.
- Late fusion of classifier margins beats early concatenation of features: 95.7 versus 94 percent on Kylberg and 91.0 versus 88.2 percent on BUSIS.
- The method is competitive with or better than deep networks on small medical datasets, where deep nets often overfit; the shallow fusion network needs only a few neurons and trains quickly.
- The Hurst exponent is a usable roughness descriptor for natural stochastic textures when the residual is well modeled by fractional Brownian motion, and it provides a separable feature for benign versus malignant ultrasound tissue.
Reading between the lines
- A testable extension is to replace the handcrafted structure view with a learned embedding from the structural layer; if the benefit of two-view fusion survives that substitution, the argument would generalize beyond the specific phase and geometric features used here.
- The same decomposition could be used for other small-data medical tasks, such as mammography, where the paper notes that curvature-based shape features would be needed; the two-view architecture would then be a drop-in classifier for those features.
- The paper's results suggest that the main value of the fractional-Brownian-motion assumption here is the compact roughness feature it supplies rather than exact fidelity to the stochastic process; a deliberately mis-specified roughness statistic would serve as a control experiment to isolate what the model assumption contributes.
Signed reviews
Editorial analysis
A structured set of objections, weighed in public.
Referee Report
Summary. This paper proposes a two-view image classification method. Each image is decomposed by relative total variation (RTV) into a structural layer S and a textural residual T = I − S. The textural view is represented by the Hurst parameter H estimated from 32×32 patches of T under an assumed 2D fractional Brownian motion (fBm) model, together with patch-level mean/variance of H. The structural view is represented by phase congruency for the Kylberg texture dataset and by a threshold-based tumor-area feature (STH algorithm) for the BUSIS breast ultrasound dataset. Two SVMs are trained independently on the two views, and their signed distances to the hyperplanes are concatenated and fed into a shallow three-layer neural network that fuses the two decisions. Experiments on a six-class Kylberg subset and on binary benign/malignant BUSIS classification report mean accuracies of 95.7% and 91.0%, respectively, outperforming single-view SVMs, feature concatenation, and several deep networks reported in the literature.
Significance. If the results hold, the paper demonstrates a low-complexity, interpretable alternative to deep learning for small-data image classification, particularly for breast ultrasound where training data are scarce. The two-view fusion mechanism — training two SVMs and merging their hyperplane distances with a shallow NN — is simple and potentially generalizable beyond the two feature sets used here. The paper has several strengths: the Hurst estimator is validated on synthetic fBm (Fig. 1c, max bias 0.014, std 0.028), the experiments use public benchmarks, the STH algorithm is stated explicitly, and comparisons with external DNN results are included. The main limitation is that the paper's central novelty — the claim that the textural layer is genuinely modeled as fBm — rests on a partially circular validation, and the empirical gains over feature concatenation are reported without error bars or significance tests. These issues are fixable and do not necessarily invalidate the empirical pipeline, but they currently weaken the force of the contribution.
major comments (4)
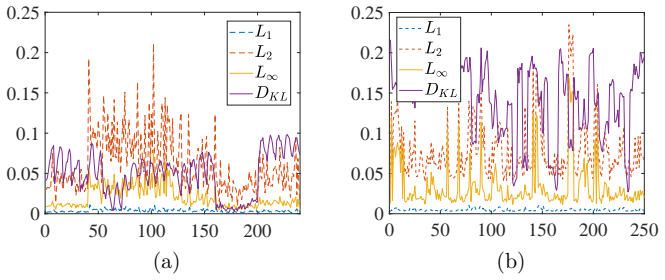
- [Section 4, Eq. (5), Prop. 2] The validation of self-similarity in Section 4 is circular. Eq. (5) is the KL divergence between two zero-mean Gaussians derived under the explicit assumption that the wavelet coefficients come from an fBm process, and the H used to rescale level j−1 is estimated from the same variance scaling (Eq. (3)) that the KL test is supposed to confirm. Proposition 2 only restates that two consistent ML estimators of the same variance become close for large samples; it does not provide independent evidence that T is fBm. Consequently, Fig. 3 does not establish the fBm nature of the RTV residual, and the Hurst parameter used in §5.1.1 may be a generic roughness statistic whose value depends on the RTV parameters and patch size. To support the paper's stated contribution of texture modeling, please add independent validation of Gaussianity and self-similarity of T (e.g., normality tests on wavelet coefficients, wavelet-domain log-cumulants, or a comparison of the H distribution estimated from T with that from synthetic fBm of matched H and patch size), or explicitly reframe H as a heuristic roughness feature and adjust the claims accordingly.
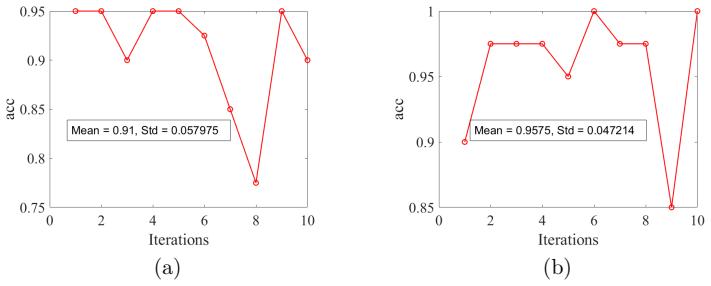
- [Table 1, §5.3] The central empirical claim rests on 10 random splits, but Table 1 reports only mean accuracies. The improvement of dT⊕dS over T⊕S is 1.7 percentage points on Kylberg (95.7 vs 94.0) and 2.8 points on BUSIS (91.0 vs 88.2). Without standard deviations, confidence intervals, or a paired significance test across the 10 splits (e.g., Wilcoxon signed-rank test), the reader cannot judge whether the fusion gain is real or within split-level variance. Please report per-split variability, state whether the splits are stratified by class and whether the test set is identical across all compared configurations, and provide significance tests for the differences that support the main claim.
- [Table 2, §5.3] The comparison with SADE and four DNNs in Table 2 is taken from Lee et al. [12] and is not head-to-head unless the training/validation/test protocol, class balance, image preprocessing, and evaluation metrics are identical. Differences in any of these factors can easily exceed the reported margins. Please either re-evaluate the baselines under the exact protocol of this paper (ideally with the same 10 splits used for Table 1) or restrict the claim to an external comparison with explicit caveats about protocol mismatch.
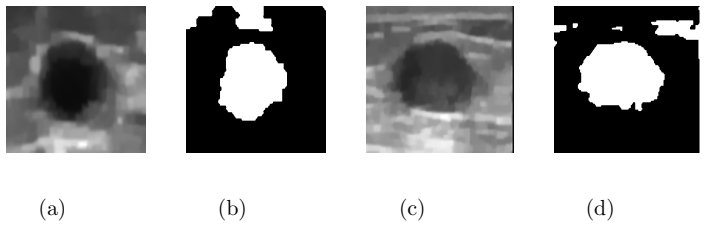
- [Section 5.1.2, Algorithm 1] The STH algorithm relies on the assumption that the tumor is the low-gray-level connected component nearest the ROI center, with a fixed 5-level quantization and a binarization threshold at level 3. This assumption is not validated quantitatively on BUSIS; if it fails for a nontrivial subset, the structural feature ΦS is corrupted, and since ΦS alone achieves 88.0% accuracy in Table 1, it is the stronger view on this dataset. Please report the success rate of the STH localization on the full BUSIS set, show failure cases, and provide a sensitivity analysis for the quantization levels and threshold. This is load-bearing for the medical classification claim.
minor comments (8)
- [Abstract and Introduction] There is a typo in the abstract and introduction: 'regraded' should be 'regarded', and 'Wen then' should be 'We then'.
- [Section 5.3 and throughout] The dataset name is spelled inconsistently as 'Kylbreg' in several places (e.g., §5.3, Fig. 8) and 'Kylberg' elsewhere; please unify the spelling.
- [Section 4.1] The text says 'we calculate the first 3 levels... We focus only on levels 1 and 2', but Fig. 3 is described as distances between levels 1 and 3; this discrepancy should be clarified.
- [Section 5.3] For BUSIS, the paper does not report the number of images per class, the class balance, or the image resolution; this information is needed for reproducibility and for assessing the validity of the STH assumption.
- [Section 5.2 and Algorithm 1] The STH parameters (5 quantization levels and threshold at level 3) are chosen without sensitivity analysis; the paper should state whether the results are stable with respect to these choices.
- [Section 7.2, Proof of Prop. 2] The proof contains minor notation errors: 'Ø' should be 'O' in the Taylor expansion, and 'As a sequence' should be 'As a consequence'.
- [Figure 3] The distance values in Fig. 3 are presented without error bars or units; clarify how the distances were aggregated over images and whether the differences between metrics are statistically meaningful.
- [General] No code or data-link is provided; releasing the feature extraction and fusion scripts would substantially improve reproducibility.
Circularity Check
The two-view classification itself is independently tested, but the fBm model validation in Section 4 is partly circular: Eq. (5) compares wavelet levels rescaled by the same H fitted from the data.
-
fitted input called prediction
[Section 4 / Eq. (5), Section 4.1, Proposition 2]
"Given that the underlying process is fBm, and under the assumption of zero-mean coefficients, the Kullback–Leibler (KL) divergence between two levels is given by [10]: DKL(p1||p2) = log(σ2/σ1) + σ1^2/(2σ2^2) − 1/2, where p1 and p2 are the PDFs of the coefficients cj,k and 2^{−H}cj−1,k of the multiresolution wavelet representation, respectively. ... Then, the KL divergence between their PDFs is calculated according to (5)."
The H that appears in the rescaling 2^{−H} c_{j−1,k} is the Hurst parameter estimated from the same data via the variance-increment scaling of Eq. (3), with slope 2H in log-log regression. Comparing wavelet level j with level j−1 rescaled by the fitted H forces the second moments of the two Gaussian PDFs to match; under the Gaussianity assumed in Eq. (5), the KL divergence then tends to zero largely by construction. Proposition 2 adds only a bound derived from consistency of two estimators of the same variance, so it does not independently confirm that the RTV residual is fBm. Thus the paper's validation of the texture premise reduces to a fitted rescaling, and the Hurst feature may be a generic roughness statistic rather than a verified fBm parameter.
full rationale
The central classification claim is not circular: the two-view system is evaluated on held-out test data, repeated over 10 random splits, and compared in Table 2 with external DNN baselines from Lee et al. The gains of dT⊕dS over single-view and concatenated-feature SVMs are empirical and would stand even if the Hurst feature were only an ad hoc roughness statistic. The circularity is confined to the theoretical support for the texture view: Section 4 validates self-similarity with Eq. (5), which assumes the fBm model and uses the fitted H to rescale the compared wavelet levels, so the small KL distances shown in Fig. 3 are partly imposed by the fitting procedure. Proposition 2 is near-tautological. This weakens the claim that the NST layer is genuinely fBm, but it does not force the classification results, which retain independent content.
Assumptions & free parameters
free parameters (7)
- Hurst parameter H =
per-patch estimates; BUSIS class means roughly 0.24 to 0.32 (Fig. 5a)
- RTV decomposition weight and iteration count =
not reported
- STH quantization and threshold (5 levels, binarize below level 3) =
5 levels, threshold 3
- ROI-center proximity rule for tumor selection =
minimal Euclidean distance from ROI center
- SVM RBF hyperparameters (C, gamma) =
not reported; LIBSVM defaults implied
- NN architecture and training schedule =
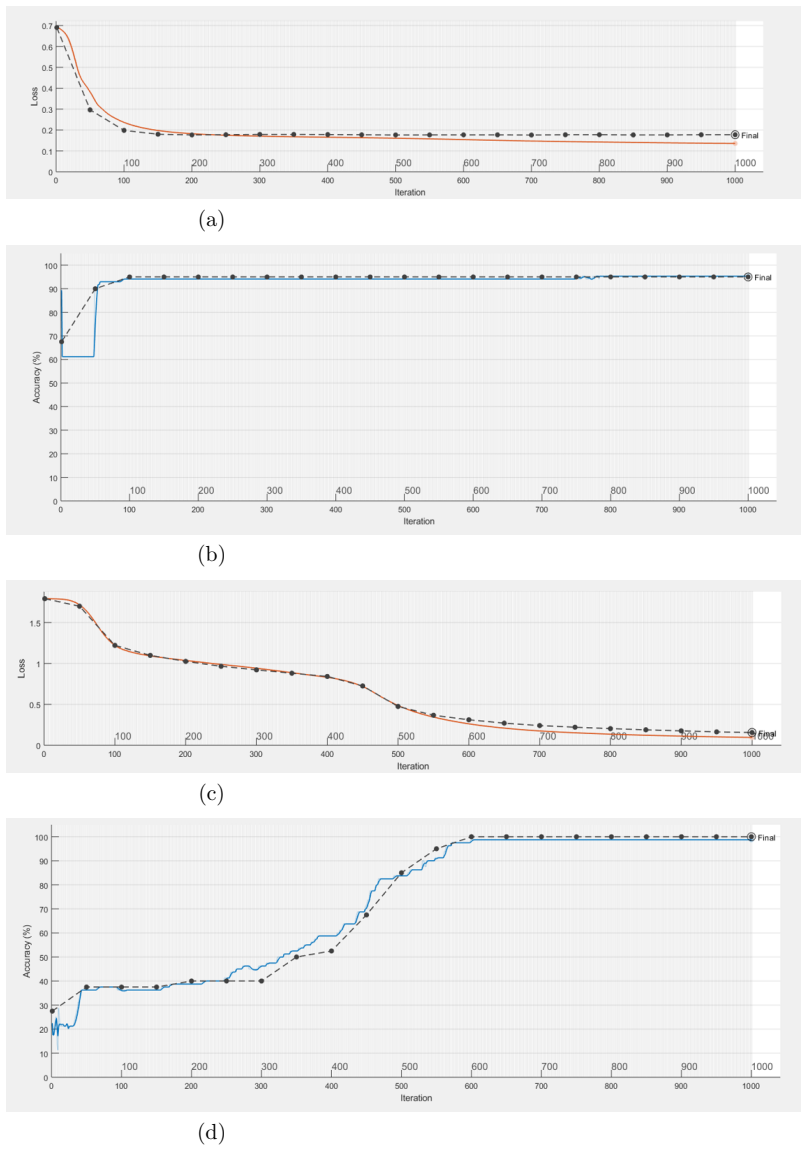
3 FC layers (sizes k(k-1), 8, 4, k), ReLU, 1000 epochs
- Analysis settings: patch size, wavelet family, levels =
32x32 patches; Haar wavelet; levels 1 to 3
assumptions (6)
- domain assumption The RTV residual T = I - S is a pure NST layer obeying Gaussianity and fBm statistics.
- domain assumption 2D fBm with covariance (2) and structure function f(theta)(r)^{2H} is a valid model for the NST layer.
- standard math Wavelet coefficients of the fBm process are zero-mean Gaussian, so the KL divergence between levels is given by Eq. (5).
- standard math Self-similar fBm has scale-invariant wavelet coefficients (Prop. 1), i.e. c_{j,k} = 2^{-H} c_{j-1,k} in distribution.
- standard math ML variance estimators are consistent, so the KL bound of Prop. 2 follows.
- ad hoc to paper For BUSIS, the tumor region is the low-gray-level connected component nearest the ROI center.
Cite this review
Pith. "Pith review of Texture and Structure Two-view Classification of Images." pith.science (2026). https://pith.science/paper/ZB7KYH4H
@misc{pith2026190809264,
  author       = {Pith},
  title        = {Pith review of: Texture and Structure Two-view Classification of Images},
  year         = {2026},
  howpublished = {\url{https://pith.science/paper/ZB7KYH4H}},
  note         = {Machine review of arXiv:1908.09264}
}
read the original abstract
Textural and structural features can be regraded as "two-view" feature sets. Inspired by the recent progress in multi-view learning, we propose a novel two-view classification method that models each feature set and optimizes the process of merging these views efficiently. Examples of implementation of this approach in classification of real-world data are presented, with special emphasis on medical images. We firstly decompose fully-textured images into two layers of representation, corresponding to natural stochastic textures (NST) and structural layer, respectively. The structural, edge-and-curve-type, information is mostly represented by the local spatial phase, whereas, the pure NST has random phase and is characterized by Gaussianity and self-similarity. Therefore, the NST is modeled by the 2D self-similar process, fractional Brownian motion (fBm). The Hurst parameter, characteristic of fBm, specifies the roughness or irregularity of the texture. This leads us to its estimation and implementation along other features extracted from the structure layer, to build the "two-view" features sets used in our classification scheme. A shallow neural net (NN) is exploited to execute the process of merging these feature sets, in a straightforward and efficient manner.
Figures

Figures from the paper (7 more)

Reference graph
Works this paper leans on
-
[12]
Lee, C.Y., Chen, G.L., Zhang, Z.X., Chou, Y.H., Hsu, C.C.: Is intensity inhomogeneity correction useful for classification of breast cancer in sonograms using deep neural network? Journal of healthcare engineering 2018 (2018)
work page 2018
-
[1]
In: Benoit Mandelbrot: A Life in Many Dimensions, pp
Abry, P., Jaffard, S., Wendt, H.: Irregularities and scaling in signal and image processing: multi- fractal analysis. In: Benoit Mandelbrot: A Life in Many Dimensions, pp. 31–116. World Scientific (2015)
work page 2015
-
[2]
In: 2007 15th European Signal Processing Conference
Alexander, S.K., Kovaˇ ciˇ c, S., Vrscay, E.R.: A simple model for image self-similarity and the possible use of mutual information. In: 2007 15th European Signal Processing Conference. pp. 975–979. IEEE (2007)
work page 2007
-
[3]
IEEE Transactions on Signal Processing 40(4), 736–743 (1992)
Behar, J., Porat, M., Zeevi, Y.Y.: Image reconstruction from localized phase. IEEE Transactions on Signal Processing 40(4), 736–743 (1992)
work page 1992
-
[4]
springer (2006)
Bishop, C.M.: Pattern recognition and machine learning. springer (2006)
2006
-
[5]
IEEE transactions on medical imaging 34(7), 1474–1485 (2015)
Boublil, D., Elad, M., Shtok, J., Zibulevsky, M.: Spatially-adaptive reconstruction in computed tomography using neural networks. IEEE transactions on medical imaging 34(7), 1474–1485 (2015)
work page 2015
-
[6]
ACM transactions on intelligent systems and technology (TIST) 2(3), 27 (2011)
Chang, C.C., Lin, C.J.: Libsvm: A library for support vector machines. ACM transactions on intelligent systems and technology (TIST) 2(3), 27 (2011)
work page 2011
-
[7]
On the Self-Similarity of Natural Stochastic Textures
Khawaled, S., Zeevi, Y.Y.: On the self-similarity of natural stochastic textures. arXiv preprint arXiv:1906.06768 (2019)
work page Pith review arXiv 2019
Show all 30 references
-
[8]
Kovesi, P.: Matlab code for calculating phase congruency and phase symmetry/asymmetry (1996)
1996
-
[9]
Videre: Journal of computer vision research 1(3), 1–26 (1999)
Kovesi, P., et al.: Image features from phase congruency. Videre: Journal of computer vision research 1(3), 1–26 (1999)
1999
-
[10]
The annals of mathematical statistics 22(1), 79–86 (1951)
Kullback, S., Leibler, R.A.: On information and sufficiency. The annals of mathematical statistics 22(1), 79–86 (1951)
1951
-
[11]
Kylberg, G.: The kylberg texture dataset v. 1.0. External report (Blue series) 35, Centre for Image Analysis, Swedish University of Agricultural Sciences and Uppsala University, Uppsala, Sweden (September 2011), http://www.cb.uu.se/˜gustaf/texture/
2011
-
[13]
In: International Symposium on Neural Networks
Lian, H.C., Lu, B.L.: Multi-view gender classification using local binary patterns and support vector machines. In: International Symposium on Neural Networks. pp. 202–209. Springer (2006)
2006
-
[14]
Lin, W.C., Hays, J., Wu, C., Kwatra, V., Liu, Y.: A comparison study of four texture synthesis algorithms on regular and near-regular textures. Tech. Rep. (2004)
2004
-
[15]
SIAM review 10(4), 422–437 (1968)
Mandelbrot, B.B., Van Ness, J.W.: Fractional brownian motions, fractional noises and applica- tions. SIAM review 10(4), 422–437 (1968)
1968
-
[16]
Signal Processing 104, 248–257 (2014)
Nasiri, J.A., Charkari, N.M., Mozafari, K.: Energy-based model of least squares twin support vector machines for human action recognition. Signal Processing 104, 248–257 (2014)
2014
-
[17]
In: 2005 IEEE Engineering in Medicine and Biology 27th Annual Conference
Nguyen, T.M., Rangayyan, R.M.: Shape analysis of breast masses in mammograms via the fractal dimension. In: 2005 IEEE Engineering in Medicine and Biology 27th Annual Conference. pp. 3210–3213. IEEE (2006)
2006
-
[18]
IEEE Transactions on Pattern Anal- ysis & Machine Intelligence (6), 661–674 (1984)
Pentland, A.P.: Fractal-based description of natural scenes. IEEE Transactions on Pattern Anal- ysis & Machine Intelligence (6), 661–674 (1984)
1984
-
[19]
In: Fractals in Engineering, pp
Pesquet-Popescu, B., Larzabal, P.: 2d self-similar processes with stationary fractional increments. In: Fractals in Engineering, pp. 138–151. Springer (1997)
1997
-
[20]
IEEE Signal Procesing Magazine 19(5), 48–62 (2002)
Pesquet-Popescu, B., V´ ehel, J.L.: Stochastic fractal models for image processing. IEEE Signal Procesing Magazine 19(5), 48–62 (2002)
2002
-
[21]
Journal of Digital Imaging 20(3), 223–237 (2007)
Rangayyan, R.M., Nguyen, T.M.: Fractal analysis of contours of breast masses in mammograms. Journal of Digital Imaging 20(3), 223–237 (2007)
2007
-
[22]
In: Proceedings 1998 International Conference on Image Processing
Sochen, N., Zeevi, Y.Y.: Representation of colored images by manifolds embedded in higher dimen- sional non-euclidean space. In: Proceedings 1998 International Conference on Image Processing. ICIP98 (Cat. No. 98CB36269). vol. 1, pp. 166–170. IEEE (1998)
1998
-
[23]
In: International Conference on Advanced Data Mining and Applications
Sun, S.: Multi-view laplacian support vector machines. In: International Conference on Advanced Data Mining and Applications. pp. 209–222. Springer (2011)
2011
-
[24]
IEEE Transactions on Information Theory 45(3), 878–897 (1999) 15
Veitch, D., Abry, P.: A wavelet-based joint estimator of the parameters of long-range dependence. IEEE Transactions on Information Theory 45(3), 878–897 (1999) 15
1999
-
[25]
In: Advances in neural information processing systems
Wainwright, M.J., Simoncelli, E.P.: Scale mixtures of gaussians and the statistics of natural images. In: Advances in neural information processing systems. pp. 855–861 (2000)
2000
-
[26]
Infinite Study (2018)
Xian, M., Zhang, Y., Cheng, H.D., Xu, F., Huang, K., Zhang, B., Ding, J., Ning, C., Wang, Y.: A benchmark for breast ultrasound image segmentation (BUSIS). Infinite Study (2018)
2018
-
[27]
ACM Transactions on Graphics (SIGGRAPH Asia) (2012)
Xu, L., Yan, Q., Xia, Y., Jia, J.: Structure extraction from texture via natural variation measure. ACM Transactions on Graphics (SIGGRAPH Asia) (2012)
2012
-
[28]
IEEE transactions on image processing 23(5), 2096–2108 (2014)
Zachevsky, I., Zeevi, Y.Y.: Single-image superresolution of natural stochastic textures based on fractional brownian motion. IEEE transactions on image processing 23(5), 2096–2108 (2014)
2014
-
[29]
IEEE Transactions on Image Processing 25(5), 2130–2145 (2016)
Zachevsky, I., Zeevi, Y.Y.J.: Statistics of natural stochastic textures and their application in image denoising. IEEE Transactions on Image Processing 25(5), 2130–2145 (2016)
2016
-
[30]
Zhao, J., Xie, X., Xu, X., Sun, S.: Multi-view learning overview: Recent progress and new challenges. Information Fusion 38, 43–54 (2017) 16 (a) (b) (c) (d) Figure 9: Loss and accuracy of the NN as a function of the number of epochs (iterations) in the case of BUSIS images (a,...
2017
Reviewed August 14, 2026 · model on record in the stance chip above.
Discussion (0). Continue with ORCID to comment.