REVIEW 4 major objections 5 minor 73 references
Identifying Key Drivers of Heatwaves: A Novel Spatio-Temporal Framework for Extreme Event Detection
T0 review · 4 major / 5 minor · reviewed 2026-08-12 · deepseek-v4-flash
Pith's one-line read Clustering plus evolution identifies heatwave drivers at 0.79 F1.
desk verdict Interesting feature-selection framework, but the central evaluation is compromised by tuning the agreement threshold on the test set, so take the reported F1 and the 'key drivers' list with a grain of salt. read the letter →
The pith
A machine-rendered reading of the paper's core claim, the machinery that carries it, and where it could break.
The reading
What carries the argument
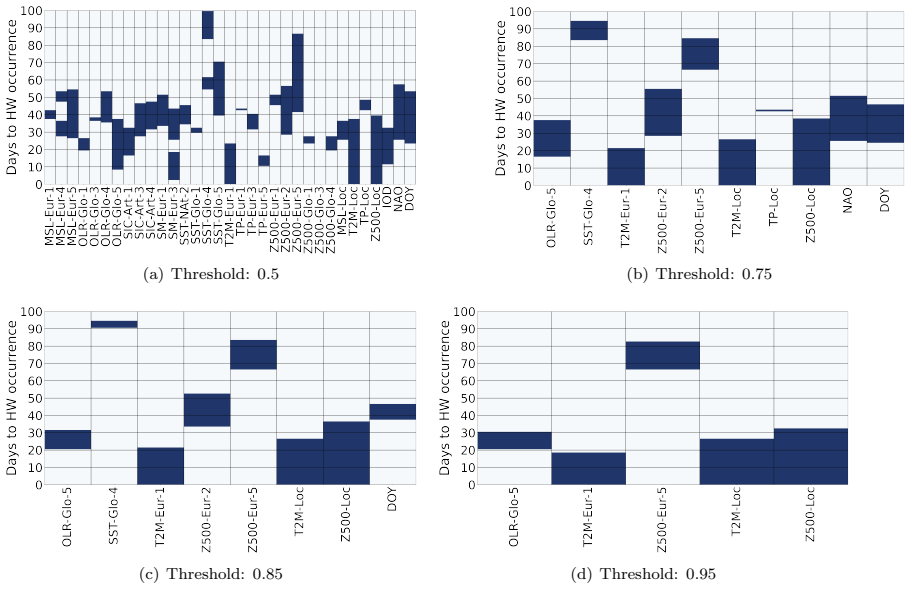
The central machinery is a two-stage spatio-temporal feature-selection pipeline. First, K-means clustering groups the nodes of each ERA5 variable field into five regions of similar temporal behavior, reducing 12 gridded variables to 60 cluster-mean time series; adding 11 unclustered local variables and climate indices gives 71 candidate drivers. Second, the PCRO-SL ensemble evolutionary algorithm encodes each candidate solution as, for every driver, a time lag (0-180 days), a sequence length (1-60 days), and a binary include/discard flag. The fitness of a solution is the five-fold cross-validated F1 score of a fast logistic-regression nowcast of heatwave days, so the search favors compact lagged feature sets. Robustness is enforced by running the optimizer ten times, keeping the best 10% of all 150,000 solutions, and retaining only time-lag steps that appear in at least 85% of those good solutions.
What would settle it
Shuffle the heatwave labels in time and rerun the full STCO-FS pipeline; if similar driver sets with comparable F1 scores still emerge, the method is tracking seasonality or trends rather than event-specific precursors, and the driver-identification claim collapses.
Extended reading notes
Core claim
On its own terms, the paper discovers that the key short-term heatwave drivers for the Adda river basin are: regional 2m temperature over the cluster containing the basin, local soil moisture and precipitation with lags up to about 20 days; sub-seasonal predictors including OLR over the western-central Pacific (20-30 days), Z500 over the eastern Mediterranean (30-50 days), NAO and IOD (20-55 days); and seasonal predictors including Z500 over the North Atlantic (70-85 days) and tropical Pacific SST (90-100 days). The paper claims these features are robust because they appear in nearly all of the best-performing solutions out of 150,000 evaluated, and that the final feature set, selected at an 85% agreement threshold, yields a nowcasting F1 of 0.7906 with a gradient-boosting classifier. It presents STCO-FS as a general method for extreme-event driver detection, not a one-off analysis of this basin.
Load-bearing premise
The load-bearing premise is that a variable that improves a binary classifier's F1 score for nowcasting heatwave days is genuinely a 'driver' of heatwaves; if predictive skill and physical causation come apart, the selected features could simply be seasonal markers or trend-correlated variables.
Editorial extensions
If this is right
- The identified short-term drivers (regional temperature, soil moisture, precipitation) give a concrete input list for heatwave nowcast and early-warning systems in the Po Valley region.
- The sub-seasonal and seasonal drivers (NAO, IOD, tropical Pacific SST, North Atlantic Z500) specify lead times at which remote conditions are informative, which can guide the design of sub-seasonal-to-seasonal forecast models.
- Because the pipeline is modular with respect to target and predictor data, the same two-stage search can be applied to other extreme events (e.g., droughts, heavy rainfall) to generate candidate driver sets for those hazards.
- The framework's frequency-based threshold provides a principled way to separate consistently selected drivers from noise, so users can trade off the size of the feature set against detection skill.
Reading between the lines
- Because 'driver' is defined operationally by nowcast F1, the selected set may include variables that track seasonality or warming trends rather than cause heatwaves; re-running the search with a causal objective would tell which of the identified features are genuinely mechanistic.
- The agreement threshold that fixes the final feature set is tuned on the test period (Table 3), so the reported 0.7906 F1 is likely optimistic; a fully nested validation with the threshold chosen inside cross-validation would give a fairer estimate of out-of-sample skill.
- The framework's output is a hypothesis generator: the specific Z500 clusters and NAO lags it selects point to precursor wave-train configurations that could be tested in dynamical model experiments.
- A transfer test would strengthen the generality claim: applying STCO-FS to a different basin or a different extreme and checking whether the selected driver geography matches known physical teleconnections would show whether the method discovers mechanisms or only region-specific correlations.
Signed reviews
Editorial analysis
A structured set of objections, weighed in public.
Referee Report
Summary. The paper presents STCO-FS, a two-stage framework for identifying short-term heatwave drivers. Meteorological fields from ERA5 are first reduced in spatial dimension via K-means clustering (k=5 per field), and the resulting 71 candidate driver time series (clusters plus local variables and climate indices) are then subjected to a wrapper feature selection driven by the PCRO-SL evolutionary algorithm, where the fitness is the 5-fold cross-validated F1 of a logistic regression for daily heatwave occurrence over the Adda river basin. The final driver set is obtained by keeping time steps selected in at least 85% of the best 10% of 150,000 candidate solutions, and this set is then used to train ten ML classifiers. The best test F1 is 0.7906 (gradient boosting). The paper reports that regional 2m temperature, local soil moisture, precipitation, Z500 patterns, NAO, IOD, and tropical Pacific SST are key short-term and sub-seasonal-to-seasonal drivers.
Significance. If the central evaluation were clean, the contribution would be useful: the framework is modular, code is promised (GitHub link), and it combines spatial clustering with evolutionary temporal-lag selection, which is a sensible way to reduce a large spatio-temporal search space. The frequency-map analysis over 150,000 solutions is a nice attempt to move beyond a single optimization run. However, the claimed skill and the identified driver list rest on an evaluation that is not fully out-of-sample: the agreement threshold is chosen by inspecting test-set F1. In addition, no baseline or ablation is provided, so the reported F1 cannot be attributed to the framework's driver identification rather than to the simple presence of contemporaneous local temperature and calendar-day features. The paper acknowledges that DOY and CO2 are widely selected with arbitrary lags, which independently confirms that F1-maximizing selection does not by itself yield physically interpretable drivers. The central claim, as stated in the abstract and conclusions, is therefore not yet supported by the evidence as presented.
major comments (4)
- [Section 4.1, Table 3 and Figure 7] The final driver set is chosen by sweeping the agreement threshold and selecting 0.85 because it maximizes the test-set F1 (Table 3, Figure 7). This makes the reported test F1 of 0.7615 for the logistic regression, and by extension the feature set used in Section 4.2, optimistically biased: the test set has been used for model selection, not only for evaluation. The authors state in Section 4 that the test set is "reserved exclusively for evaluating model performance," which is contradicted by this threshold selection. A clean evaluation would require selecting the threshold inside cross-validation on the training period, or reporting both the training-selected threshold and the resulting test F1, with the threshold fixed before any test-set inspection.
- [Section 4.2, Table 4; Section 2.2] The headline test F1 of 0.7906 is reported without any baseline or ablation, and the test period has a very different positive-class rate (15.1%) from the training period (5.1%). Without a climatological or persistence baseline, a no-driver model that always predicts the majority class, or a model using only local T2M and day-of-year, the reader cannot tell whether the framework's driver-selection procedure adds skill. An ablation (e.g., using all 71 variables with no selection, random feature subsets, or the 0.5-threshold set) would be needed to support the claim that STCO-FS identifies skilful drivers.
- [Section 3.2 and Section 4.1] The framework defines 'driver importance' operationally as the contribution to logistic-regression F1 under 5-fold CV. The paper's own observation that DOY and global CO2 are widely selected, but that 'the selection of a specific lag time for each is considered arbitrary,' shows that F1-optimized selection does not by itself separate physically meaningful drivers from seasonal or trend confounders. The conclusions nevertheless state that the framework 'identifies key heatwave drivers' and 'important time frames.' This is an overinterpretation: the output is a set of statistically useful predictors for a nowcasting classifier, not established causal drivers. The text should either restrict its claims to 'predictive features' or provide an explicit discussion of why F1-based selection is expected to track physical driver importance.
- [Section 4.1, Figure 6 and Figure 8] The frequency map and threshold analysis are based on the best 10% of 150,000 solutions, but the paper does not report any uncertainty across the ten independent PCRO-SL runs. For instance, it is unclear whether the 0.85-threshold feature set is stable across runs or dominated by a single run's best solution. Reporting the distribution of F1 across runs, and the overlap of the selected features across runs, would substantiate the claim of robustness and guard against overfitting to the stochastic optimization path.
minor comments (5)
- [Abstract / Conclusions] The abstract says 'key immediate (short-term) HW drivers' while the method is a detection/nowcasting exercise with h=0; the conclusions later mention 'nowcasting error metrics of 0.8363,' but the test F1 in Table 4 is 0.7906. Please clarify which metric is being reported and reconcile the numbers.
- [Section 2.2] The preprocessing states that anomalies are computed by removing the local seasonal cycle, but the day-of-year variable is still included as a candidate driver. Since HW occurrence is defined only for May-August and has a strong seasonal cycle, DOY can easily become a high-F1 predictor. Please discuss why DOY is not treated as a confounder to be removed or controlled rather than a candidate 'driver'.
- [Section 3.1] The choice k=5 for K-means is acknowledged as arbitrary, but the sensitivity of the final driver set and the test F1 to k is not examined. A sentence noting that k is a free parameter to be tuned per application is not sufficient; at least one sensitivity experiment (e.g., k=3 and k=7) would help.
- [Figure 4 and Figure 5] Figures 4 and 5 are not fully self-explanatory: Figure 4 shows one 'potential solution' but the color scale for blue/red is not defined in the caption in a way that distinguishes selected/unselected time steps, and Figure 5 does not state whether the red points are the best 10% by CV F1 or by some other criterion. Please expand the captions.
- [References] Reference [9] is used for the heatwave definition, but the precise percentile threshold and duration criterion used to construct the binary target from the cumulative normalized TX exceedances are not given in the text. Please specify these details, as the target definition directly affects all reported F1 values.
Circularity Check
Driver list and reported F1 are defined by the F1-optimization itself, with the feature threshold tuned on the test set.
-
self definitional
[Section 3.2 'Candidate Selection: the optimization problem' and abstract; Section 4.1]
"The F1-score achieved by each candidate driver served as the fitness function for selecting optimal clustered and unclustered variables, with their corresponding time lags and sequence length, and other variables."
The paper's central product is a list of 'key HW drivers'. But Section 3.2 defines a driver operationally as any variable whose inclusion improves the F1 score of a logistic-regression nowcast of the heatwave index. The abstract then re-labels these F1-optimized predictors as 'significant variables influencing HWs'. Selection by classifier score is not an independent physical or causal criterion, so the output list is by construction the set of features that maximize F1, and cannot by itself validate the claim that these variables physically drive heatwaves. The paper's own admission that DOY and CO2 are widely selected with arbitrary lags (Section 4.1) confirms that F1-optimized selection does not by itself identify physical drivers.
-
fitted input called prediction
[Section 4.1, Table 3 and Figure 7; Section 4.2, Table 4]
"The impact of varying the input variables on classifier performance can be observed in Table 3, which presents the evolution of the F1-score metric on the test dataset as the threshold increases. [...] Figure 7 depicts how the performance of the LR classifier improves with the threshold until an upper limit (0.85, i.e. 85 % of the time is selected), beyond which predictions worsen. [...] Finally, the optimum combination of drivers, corresponding to a threshold equal to 0.85, is used to train a pool of ML classifiers (Section 3.3). The test error metrics for these methods are shown in Table 4."
The agreement threshold of 0.85 is chosen by sweeping candidate thresholds and reading off the highest test-set F1 (Table 3, Figure 7). Thus the 146-feature driver set is partly fitted to the test period. When the same test period is then used for the final model comparison (Table 4), the headline GB F1 of 0.7906 is not an independent out-of-sample prediction; it is the outcome of a test-set selection procedure. The 'prediction' is statistically forced by the preceding fit of the threshold to the same test data.
1 more flagged steps
-
self definitional
[Section 2.1-2.2 (target definition, T2M predictor) and Section 4.1]
"This work follows the widely-used HW definition given in [9] based on cumulative normalized daily maximum temperature (TX) exceedances. [...] Three of the most frequently chosen drivers all have short lag times (<20 days): T2M-Eur-1 (the regional cluster in which the Adda basin is found), and local values of SM and TP."
The target variable is a temperature-based heatwave index built from daily maximum temperature exceedances, and T2M is 2m temperature. Selecting T2M-Eur-1 and local T2M as top 'drivers' is therefore partly a definitional overlap: the predictor and the target are the same physical quantity (surface air temperature), so this selection is guaranteed by construction and does not constitute evidence of a separate causal driver. The reported framework cannot use T2M's selection to support the 'key driver' claim without independent causal analysis.
full rationale
The core circularity is in the operational definition of 'driver' and in the evaluation protocol. Section 3.2 defines driver selection as maximizing the F1 of a logistic-regression nowcast, and Section 4.1 sets the final feature threshold by maximizing test F1 (Table 3, Figure 7). The same test set then produces Table 4, so the reported F1=0.7906 is an optimistically selected number, not a clean holdout result. The paper itself flags that DOY and CO2 are widely selected with arbitrary lags, which shows F1-optimization does not by itself recover physical drivers. On the other hand, the framework is not built on self-citations: PCRO-SL [35] is an optimization tool, not an unverified premise, and the cluster analysis and frequency maps add independent descriptive content. The selection of T2M as a top driver is additionally a target-predictor overlap, since the heatwave target is derived from daily maximum temperature. Overall, several central outputs reduce to the F1-fitting procedure, so the circularity score is 6 rather than 0; however the method has transparent, reproducible components and the physical plausibility of many selected variables (SM, TP, NAO, IOD, tropical Pacific SST) is supported by external literature, which prevents a higher score.
Assumptions & free parameters
free parameters (4)
- Number of K-means clusters per predictor field (k) =
5
- Maximum time lag =
180 days
- Maximum sequence length =
60 days
- Agreement threshold for final driver set =
0.85
assumptions (4)
- domain assumption ERA5 reanalysis represents the true climate state over 1950-2022 with sufficient accuracy for heatwave driver identification.
- domain assumption The chosen predictor variables and geographical domains are appropriate because prior studies link them to European heatwaves.
- ad hoc to paper K-means clustering with k=5 preserves physically meaningful spatial patterns in each climate field.
- ad hoc to paper A logistic regression's F1 score under 5-fold cross-validation is a valid proxy for driver importance.
Cite this review
Pith. "Pith review of Identifying Key Drivers of Heatwaves: A Novel Spatio-Temporal Framework for Extreme Event Detection." pith.science (2026). https://pith.science/paper/ZBIE5S2W
@misc{pith2026241110108,
  author       = {Pith},
  title        = {Pith review of: Identifying Key Drivers of Heatwaves: A Novel Spatio-Temporal Framework for Extreme Event Detection},
  year         = {2026},
  howpublished = {\url{https://pith.science/paper/ZBIE5S2W}},
  note         = {Machine review of arXiv:2411.10108}
}
read the original abstract
Heatwaves (HWs) are extreme atmospheric events that produce significant societal and environmental impacts. Predicting these extreme events remains challenging, as their complex interactions with large-scale atmospheric and climatic variables are difficult to capture with traditional statistical and dynamical models. This work presents a general method for driver identification in extreme climate events. A novel framework (STCO-FS) is proposed to identify key immediate (short-term) HW drivers by combining clustering algorithms with an ensemble evolutionary algorithm. The framework analyzes spatio-temporal data, reduces dimensionality by grouping similar geographical nodes for each variable, and develops driver selection in spatial and temporal domains, identifying the best time lags between predictive variables and HW occurrences. The proposed method has been applied to analyze HWs in the Adda river basin in Italy. The approach effectively identifies significant variables influencing HWs in this region. This research can potentially enhance our understanding of HW drivers and predictability.
Figures


Figures from the paper (7 more)




Reference graph
Works this paper leans on
-
[1]
S. E. Perkins, A review on the scientific understanding of heatwaves-their measurement, driving mechanisms, and changes at the global scale, Atmo- spheric Research 164 (2015) 242–267
work page 2015
-
[2]
D. R. Easterling, J. Evans, P. Y. Groisman, T. R. Karl, K. E. Kunkel, P. Ambenje, Observed variability and trends in extreme climate events: a brief review, Bulletin of the American Meteorological Society 81 (3) (2000) 417–426
work page 2000
-
[3]
G. A. Meehl, C. Tebaldi, More intense, more frequent, and longer lasting heat waves in the 21st century, Science 305 (5686) (2004) 994–997
work page 2004
- [4]
-
[5]
F. G. Kuglitsch, A. Toreti, E. Xoplaki, P. M. Della-Marta, C. S. Zerefos, M. T¨ urke¸ s, J. Luterbacher, Heat wave changes in the eastern mediterranean since 1960, Geophysical Research Letters 37 (4) (2010)
work page 2010
-
[6]
P. M. Della-Marta, M. R. Haylock, J. Luterbacher, H. Wanner, Doubled length of western european summer heat waves since 1880, Journal of Geo- physical Research: Atmospheres 112 (D15) (2007)
work page 2007
-
[7]
R. Garc ´ ıa-Herrera, J. D ´ ıaz, R. M. Trigo, J. Luterbacher, E. M. Fischer, A review of the european summer heat wave of 2003, Critical Reviews in Environmental Science and Technology 40 (4) (2010) 267–306
work page 2010
-
[8]
S. Russo, A. Dosio, R. G. Graversen, J. Sillmann, H. Carrao, M. B. Dunbar, A. Singleton, P. Montagna, P. Barbola, J. V. Vogt, Magnitude of extreme heat waves in present climate and their projection in a warming world, Journal of Geophysical Research: Atmospheres 119 (22) (2014) 12–500
work page 2014
Show all 73 references
-
[9]
Russo, J
S. Russo, J. Sillmann, E. M. Fischer, Top ten European heatwaves since 1950 and their occurrence in the coming decades, Environmental Research Letters 10 (12) (2015) 124003
2015
-
[10]
Barriopedro, E
D. Barriopedro, E. M. Fischer, J. Luterbacher, R. M. Trigo, R. Garc ´ ıa- Herrera, The hot summer of 2010: redrawing the temperature record map of europe, Science 332 (6026) (2011) 220–224
2011
-
[11]
Sillmann, V
J. Sillmann, V. V. Kharin, F. W. Zwiers, X. Zhang, D. Bronaugh, Climate extremes indices in the cmip5 multimodel ensemble: Part 2. future climate projections, Journal of geophysical research: atmospheres 118 (6) (2013) 2473–2493. 22
2013
-
[12]
P. A. Stott, G. S. Jones, N. Christidis, F. W. Zwiers, G. Hegerl, H. Sh- iogama, Single-step attribution of increasing frequencies of very warm re- gional temperatures to human influence, Atmospheric Science Letters 12 (2) (2011) 220–227
2011
-
[13]
D. S. Battisti, R. L. Naylor, Historical warnings of future food insecurity with unprecedented seasonal heat, Science 323 (5911) (2009) 240–244
2009
-
[14]
Coumou, A
D. Coumou, A. Robinson, Historic and future increase in the global land area affected by monthly heat extremes, Environmental Research Letters 8 (3) (2013) 034018
2013
-
[15]
E. M. Fischer, U. Beyerle, R. Knutti, Robust spatially aggregated projec- tions of climate extremes, Nature Climate Change 3 (12) (2013) 1033–1038
2013
-
[16]
D. I. Domeisen, E. A. Eltahir, E. M. Fischer, R. Knutti, S. E. Perkins- Kirkpatrick, C. Sch¨ ar, S. I. Seneviratne, A. Weisheimer, H. Wernli, Predic- tion and projection of heatwaves, Nature Reviews Earth & Environment 4 (1) (2023) 36–50
2023
-
[17]
Barriopedro, R
D. Barriopedro, R. Garc ´ ıa-Herrera, C. Ord´ o˜ nez, D. Miralles, S. Salcedo- Sanz, Heat waves: Physical understanding and scientific challenges, Re- views of Geophysics (2023) e2022RG000780
2023
-
[18]
Sillmann, T
J. Sillmann, T. Thorarinsdottir, N. Keenlyside, N. Schaller, L. V. Alexan- der, G. Hegerl, S. I. Seneviratne, R. Vautard, X. Zhang, F. W. Zwiers, Understanding, modeling and predicting weather and climate extremes: Challenges and opportunities, Weather and climate extremes 18 ...
2017
-
[19]
Hoskins, T
B. Hoskins, T. Woollings, Persistent extratropical regimes and climate ex- tremes, Current Climate Change Reports 1 (2015) 115–124
2015
-
[20]
D. G. Miralles, P. Gentine, S. I. Seneviratne, A. J. Teuling, Land– atmospheric feedbacks during droughts and heatwaves: state of the sci- ence and current challenges, Annals of the New York Academy of Sciences 1436 (1) (2019) 19–35
2019
-
[21]
Brunner, N
L. Brunner, N. Schaller, J. Anstey, J. Sillmann, A. K. Steiner, Dependence of present and future european temperature extremes on the location of atmospheric blocking, Geophysical research letters 45 (12) (2018) 6311– 6320
2018
-
[22]
P. M. Sousa, R. M. Trigo, D. Barriopedro, P. M. Soares, J. A. Santos, European temperature responses to blocking and ridge regional patterns, Climate Dynamics 50 (2018) 457–477
2018
-
[23]
Prodhomme, S
C. Prodhomme, S. Materia, C. Ardilouze, R. H. White, L. Batt´ e, V. Gue- mas, G. Fragkoulidis, J. Garc ´ ıa-Serrano, Seasonal prediction of european summer heatwaves, Climate Dynamics (2021) 1–18. 23
2021
-
[24]
S. I. Seneviratne, X. Zhang, M. Adnan, W. Badi, C. Dereczynski, A. Di Luca, S. Ghosh, I. Iskander, J. Kossin, S. Lewis, et al., Weather and climate extreme events in a changing climate (chapter 11) (2021)
2021
-
[25]
S. B. H. S. Asadollah, N. Khan, A. Sharafati, S. Shahid, E.-S. Chung, X.-J. Wang, Prediction of heat waves using meteorological variables in di- verse regions of iran with advanced machine learning models, Stochastic environmental research and risk assessment (2021) 1–16
2021
-
[26]
Buschow, J
S. Buschow, J. Keller, S. Wahl, Explaining heatwaves with machine learn- ing, arXiv preprint arXiv:2305.15170 (2023)
2023 arXiv
-
[27]
T. F. Loughran, S. E. Perkins-Kirkpatrick, L. V. Alexander, Understanding the spatio-temporal influence of climate variability on australian heatwaves, International Journal of Climatology 37 (10) (2017) 3963–3975
2017
-
[28]
Wehrli, B
K. Wehrli, B. P. Guillod, M. Hauser, M. Leclair, S. I. Seneviratne, Identify- ing key driving processes of major recent heat waves, Journal of Geophysical Research: Atmospheres 124 (22) (2019) 11746–11765
2019
-
[29]
H. Tao, S. M. Awadh, S. Q. Salih, S. S. Shafik, Z. M. Yaseen, Integration of extreme gradient boosting feature selection approach with machine learn- ing models: application of weather relative humidity prediction, Neural Computing and Applications 34 (1) (2022) 515–533
2022
-
[30]
J. S. Hagen, E. Leblois, D. Lawrence, D. Solomatine, A. Sorteberg, Identi- fying major drivers of daily streamflow from large-scale atmospheric circu- lation with machine learning, Journal of Hydrology 596 (2021) 126086
2021
-
[31]
Chaqdid, A
A. Chaqdid, A. Tuel, A. El Fatimy, N. El Mo¸ cayd, Extreme rainfall events in morocco: Spatial dependence and climate drivers, Weather and climate extremes 40 (2023) 100556
2023
-
[32]
I. R. Orimoloye, A. O. Olusola, J. A. Belle, C. B. Pande, O. O. Olo- lade, Drought disaster monitoring and land use dynamics: identification of drought drivers using regression-based algorithms, Natural Hazards 112 (2) (2022) 1085–1106
2022
-
[33]
Dalal, T
G. Dalal, T. Pathania, A. Koppa, V. Hari, Drivers and mechanisms of heatwaves in south west india, Climate Dynamics (2024) 1–15
2024
-
[34]
Hersbach, B
H. Hersbach, B. Bell, P. Berrisford, G. Biavati, A. Hor´ anyi, J. Mu˜ noz Sabater, J. Nicolas, C. Peubey, R. Radu, I. Rozum, et al., Era5 hourly data on single levels from 1979 to present, Copernicus Cli- mate Change Service (C3S) Climate Data Store (CDS) 10 (2018)
2018
-
[35]
P´ erez-Aracil, C
J. P´ erez-Aracil, C. Camacho-G´ omez, E. Lorente-Ramos, C. M. Marina, L. M. Cornejo-Bueno, S. Salcedo-Sanz, New probabilistic, dynamic multi- method ensembles for optimization based on the cro-sl, Mathematics 11 (7) (2023) 1666. 24
2023
-
[36]
Eurostat, Agri-environmental indicator – irrigation, https: //ec.europa.eu/eurostat/statistics-explained/index.php/ Agri-environmental_indicator_-_irrigation#Analysis_at_ regional_level, accessed: 2024-11-07
2024
-
[37]
Kenyon, G
J. Kenyon, G. C. Hegerl, Influence of modes of climate variability on global temperature extremes, Journal of Climate 21 (15) (2008) 3872–3889
2008
-
[38]
Giuliani, M
M. Giuliani, M. Zaniolo, A. Castelletti, G. Davoli, P. Block, Detecting the state of the climate system via artificial intelligence to improve sea- sonal forecasts and inform reservoir operations, Water Resources Research 55 (11) (2019) 9133–9147
2019
-
[39]
Luo, N.-C
M. Luo, N.-C. Lau, Summer heat extremes in northern continents linked to developing enso events, Environmental Research Letters 15 (7) (2020) 074042
2020
-
[40]
Luo, N.-C
M. Luo, N.-C. Lau, Amplifying effect of enso on heat waves in china, Cli- mate Dynamics 52 (5) (2019) 3277–3289
2019
-
[41]
Martija-D ´ ıez, B
M. Martija-D ´ ıez, B. Rodr ´ ıguez-Fonseca, J. L´ opez-Parages, Enso influence on western european summer and fall temperatures, Journal of Climate 34 (19) (2021) 8013–8031
2021
-
[42]
P. J. Reddy, S. E. Perkins-Kirkpatrick, J. J. Sharples, Interactive influ- ence of enso and iod on contiguous heatwaves in australia, Environmental Research Letters 17 (1) (2021) 014004
2021
-
[43]
M. Li, Y. Yao, I. Simmonds, D. Luo, L. Zhong, X. Chen, Collaborative impact of the nao and atmospheric blocking on european heatwaves, with a focus on the hot summer of 2018, Environmental Research Letters 15 (11) (2020) 114003
2020
-
[44]
Mukherjee, M
S. Mukherjee, M. Ashfaq, A. K. Mishra, Compound drought and heatwaves at a global scale: The role of natural climate variability-associated synoptic patterns and land-surface energy budget anomalies, Journal of Geophysical Research: Atmospheres 125 (11) (2020) e2019JD031943
2020
-
[45]
Kueh, C.-Y
M.-T. Kueh, C.-Y. Lin, The 2018 summer heatwaves over northwestern europe and its extended-range prediction, Scientific reports 10 (1) (2020) 19283
2020
-
[46]
Lemordant, P
L. Lemordant, P. Gentine, M. St´ efanon, P. Drobinski, S. Fatichi, Mod- ification of land-atmosphere interactions by co2 effects: Implications for summer dryness and heat wave amplitude, Geophysical Research Letters 43 (19) (2016) 10–240
2016
-
[47]
P. Li, Y. Yu, D. Huang, Z.-H. Wang, A. Sharma, Regional heatwave pre- diction using graph neural network and weather station data, Geophysical Research Letters 50 (7) (2023) e2023GL103405. 25
2023
-
[48]
Stefanon, F
M. Stefanon, F. D’Andrea, P. Drobinski, Heatwave classification over eu- rope and the mediterranean region, Environmental Research Letters 7 (1) (2012) 014023
2012
-
[49]
Zhang, Z
J. Zhang, Z. Yang, L. Wu, Skillful prediction of hot temperature extremes over the source region of ancient silk road. sci. rep., 8, 6677 (2018)
2018
-
[50]
J. Sun, S. Liu, J. Cohen, S. Yu, Influence and prediction value of arctic sea ice for spring eurasian extreme heat events, Communications Earth & Environment 3 (1) (2022) 172
2022
-
[51]
Gastineau, C
G. Gastineau, C. Frankignoul, Influence of the north atlantic sst variability on the atmospheric circulation during the twentieth century, Journal of Climate 28 (4) (2015) 1396–1416
2015
-
[52]
Duchez, E
A. Duchez, E. Frajka-Williams, S. A. Josey, D. G. Evans, J. P. Grist, R. Marsh, G. D. McCarthy, B. Sinha, D. I. Berry, J. J. Hirschi, Drivers of exceptionally cold north atlantic ocean temperatures and their link to the 2015 european heat wave, Environmental Research Letters 1...
2016
-
[53]
Bischof, R
S. Bischof, R. Pilch Kedzierski, M. H¨ ansch, S. Wahl, K. Matthes, The role of the north atlantic for heat wave characteristics in europe, an echam6 study, Geophysical Research Letters 50 (23) (2023) e2023GL105280
2023
-
[54]
J. MacQueen, et al., Some methods for classification and analysis of mul- tivariate observations, in: Proceedings of the fifth Berkeley symposium on mathematical statistics and probability, Vol. 1, Oakland, CA, USA, 1967, pp. 281–297
1967
-
[55]
Salcedo-Sanz, A review on the coral reefs optimization algorithm: new development lines and current applications, Progress in Artificial Intelli- gence 6 (1) (2017) 1–15
S. Salcedo-Sanz, A review on the coral reefs optimization algorithm: new development lines and current applications, Progress in Artificial Intelli- gence 6 (1) (2017) 1–15
2017
-
[56]
G. Wu, R. Mallipeddi, P. N. Suganthan, Ensemble strategies for population- based optimization algorithms–a survey, Swarm and evolutionary compu- tation 44 (2019) 695–711
2019
-
[57]
Salcedo-Sanz, J
S. Salcedo-Sanz, J. Del Ser, I. Landa-Torres, S. Gil-L´ opez, J. Portilla- Figueras, The coral reefs optimization algorithm: a novel metaheuristic for efficiently solving optimization problems, The Scientific World Journal 2014 (2014)
2014
-
[58]
Del Ser, E
J. Del Ser, E. Osaba, D. Molina, X.-S. Yang, S. Salcedo-Sanz, D. Cama- cho, S. Das, P. N. Suganthan, C. A. C. Coello, F. Herrera, Bio-inspired computation: Where we stand and what’s next, Swarm and Evolutionary Computation 48 (2019) 220–250
2019
-
[59]
Kirkpatrick, C
S. Kirkpatrick, C. D. Gelatt Jr, M. P. Vecchi, Optimization by simulated annealing, science 220 (4598) (1983) 671–680. 26
1983
-
[60]
D. G. Kleinbaum, K. Dietz, M. Gail, M. Klein, M. Klein, Logistic regres- sion, Springer, 2002
2002
-
[61]
G. Ke, Q. Meng, T. Finley, T. Wang, W. Chen, W. Ma, Q. Ye, T.-Y. Liu, Lightgbm: A highly efficient gradient boosting decision tree, Advances in neural information processing systems 30 (2017)
2017
-
[62]
Sch¨ olkopf, A
B. Sch¨ olkopf, A. J. Smola, R. C. Williamson, P. L. Bartlett, New support vector algorithms, Neural Computation 12 (2000) 1207–1245. doi:10. 1162/089976600300015565. URL https://doi.org/10.1162/089976600300015565
2000 doi
-
[63]
Loh, Classification and regression trees, Wiley interdisciplinary re- views: data mining and knowledge discovery 1 (1) (2011) 14–23
W.-Y. Loh, Classification and regression trees, Wiley interdisciplinary re- views: data mining and knowledge discovery 1 (1) (2011) 14–23
2011
-
[64]
Breiman, Random forests, Machine learning 45 (1) (2001) 5–32
L. Breiman, Random forests, Machine learning 45 (1) (2001) 5–32
2001
-
[65]
Zhang, The optimality of naive bayes, Aa 1 (2) (2004) 3
H. Zhang, The optimality of naive bayes, Aa 1 (2) (2004) 3. URL www.aaai.org
2004
-
[66]
Mucherino, P
A. Mucherino, P. J. Papajorgji, P. M. Pardalos, K-nearest neighbor classi- fication, in: Data mining in agriculture, Springer, 2009, pp. 83–106
2009
-
[67]
Freund, R
Y. Freund, R. Schapire, Experiments with a new boosting algorithm, Ma- chine Learning: Proceedings of the Thirteenth International Conference (1996) 148–156
1996
-
[68]
M. W. Gardner, S. R. Dorling, Artificial neural networks (multilayer perceptron)– a review of applications in the atmospheric sciences, Atmo- spheric Environment 32 (1998) 2627–2636
1998
-
[69]
J. H. Friedman, Greedy function approximation: a gradient boosting ma- chine, Annals of statistics (2001) 1189–1232
2001
-
[70]
G. B. Huang, Q. Y. Zhu, C. K. Siew, Extreme learning machine: Theory and applications, Neurocomputing 70 (2006) 489–501. doi:10.1016/j. neucom.2005.12.126
2006 doi
-
[71]
Ardilouze, L
C. Ardilouze, L. Batt´ e, M. D´ equ´ e, E. van Meijgaard, B. van den Hurk, Investigating the impact of soil moisture on european summer climate in ensemble numerical experiments, Climate Dynamics 52 (2019) 4011–4026
2019
-
[72]
Drouard, K
M. Drouard, K. Kornhuber, T. Woollings, Disentangling dynamic contri- butions to summer 2018 anomalous weather over europe, Geophysical Re- search Letters 46 (21) (2019) 12537–12546
2019
-
[73]
Behera, J
S. Behera, J. V. Ratnam, Y. Masumoto, T. Yamagata, Origin of extreme summers in europe: the indo-pacific connection, Climate dynamics 41 (2013) 663–676. 27
2013
Reviewed August 12, 2026 · model on record in the stance chip above.
Discussion (0). Continue with ORCID to comment.