The Asymptotic Distribution of Sample Canonical Directions in Gaussian Spiked High-dimensional CCA
Pith reviewed 2026-06-27 14:54 UTC · model grok-4.3
The pith
In spiked high-dimensional Gaussian CCA, squared alignment between sample and population canonical directions converges to an explicit deterministic limit with fluctuations obeying a central limit theorem.
A machine-rendered reading of the paper's core claim, the machinery that carries it, and where it could break.
Core claim
For each simple population spike, the squared alignment between a sample canonical direction and its population counterpart admits a deterministic first-order limit that measures retained directional information at the population level. Fluctuations of this alignment around the limit obey a central limit theorem whose asymptotic variance is expressed through deterministic limits of resolvent trace functionals. Plug-in estimators for both the limiting mean and the asymptotic variance are obtained by inverting the deterministic outlier eigenvalue map and are shown to be consistent.
What carries the argument
Deterministic first-order limit of the squared alignment between sample and population canonical directions, together with the associated central limit theorem derived from resolvent trace functionals.
If this is right
- The limiting alignment supplies an explicit quantitative measure of population directional information retained by each sample direction.
- The central limit theorem supplies asymptotic normality that can be used for inference on directional recovery quality.
- Consistent plug-in estimators allow computation of both the limit and its variance directly from observed data without knowledge of population parameters.
- The same inversion technique that produces the estimators also yields computable expressions for the resolvent-based variance.
Where Pith is reading between the lines
- The explicit form of the alignment limit suggests a simple correction factor that could be applied to improve estimation of population directions from the sample ones.
- Because the variance depends on resolvent traces, the same machinery may extend to other linear statistics of the sample canonical vectors.
- The results indicate that directional recovery quality can be assessed and reported routinely in applied CCA analyses once the plug-in estimators are implemented.
Load-bearing premise
The observations come from a Gaussian population with finite-rank spiked structure and the two block dimensions grow proportionally with sample size.
What would settle it
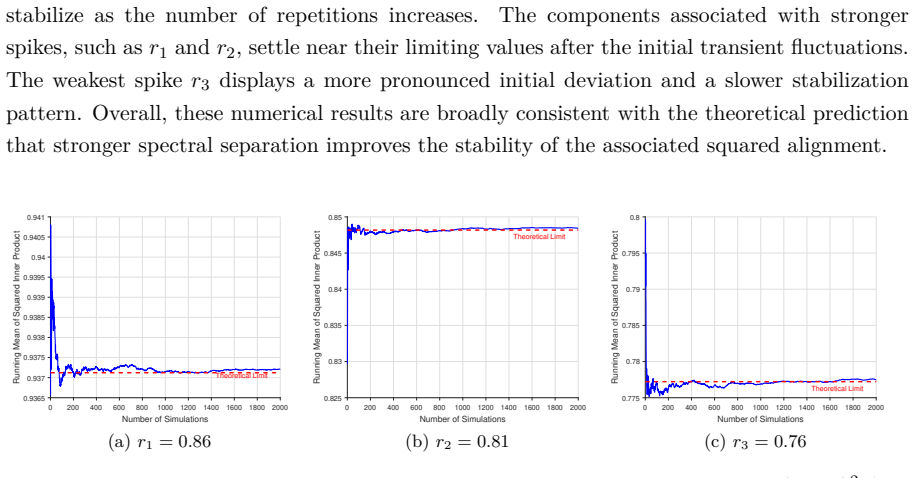
Empirical squared alignments computed on data generated from the model that deviate systematically from the predicted deterministic limit as dimensions and sample size increase.
Figures
read the original abstract
This paper studies the asymptotic behavior of sample canonical directions in a finite-rank spiked high-dimensional canonical correlation analysis model under a Gaussian population assumption. Under the asymptotic regime in which the dimensions of the two data blocks grow proportionally with the sample size, sample canonical directions are generally not consistent estimators of their population counterparts, even when the corresponding sample canonical correlations separate from the bulk spectrum. To quantify directional recovery, we investigate the squared alignment between a sample canonical direction and its associated population direction. For each simple population spike, we first establish a deterministic first-order limit for this squared alignment, which gives an explicit measure of the population-level directional information retained by the sample direction. We then prove a central limit theorem for its fluctuations around the deterministic limit, with an explicit asymptotic variance expressed through deterministic limits of resolvent trace functionals. To make the theoretical quantities computable from data, we further construct plug-in estimators for both the limiting mean and the asymptotic variance by inverting the deterministic outlier eigenvalue map, and prove their consistency. Numerical simulations and a real-data illustration support the theoretical results and demonstrate how the proposed estimators assess the recovery quality of sample canonical directions.
Editorial analysis
A structured set of objections, weighed in public.
Referee Report
Summary. The paper studies the asymptotic behavior of sample canonical directions in a finite-rank spiked high-dimensional CCA model under Gaussian population assumptions and proportional growth of dimensions with sample size. It derives a deterministic first-order limit for the squared alignment between sample and population directions for each simple spike, proves a CLT for fluctuations around this limit with asymptotic variance expressed via resolvent trace functionals, and constructs consistent plug-in estimators for the limit and variance by inverting the deterministic outlier eigenvalue map.
Significance. If the derivations hold, the work supplies explicit, computable measures of directional recovery quality in high-dimensional CCA, where sample directions are typically inconsistent. The deterministic-equivalent approach and resolvent-based variance, together with the consistency proof for the plug-in estimators, provide a practical tool for assessing retained population information; this extends standard RMT techniques to CCA and is supported by simulations and real-data examples.
minor comments (4)
- The introduction would benefit from an early, explicit statement of the main theorems (including the precise form of the deterministic limit and the CLT variance expression) to orient the reader before the technical sections.
- Notation for the two data-block dimensions and the spike strengths should be introduced with a single consolidated table or display equation near the model definition to avoid repeated cross-references.
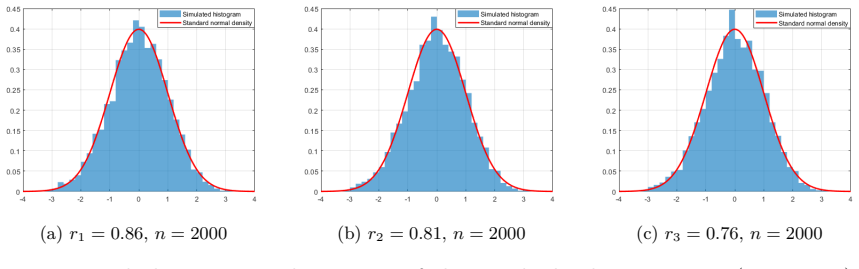
- In the simulation section, the number of Monte Carlo replications and the precise parameter values used to generate the population covariance blocks should be stated explicitly so that the reported alignment histograms can be reproduced.
- The real-data illustration would be strengthened by reporting the estimated spike strengths and the resulting plug-in estimates of alignment and variance alongside the raw canonical correlations.
Simulated Author's Rebuttal
We thank the referee for the supportive review, accurate summary of our contributions, and recommendation for minor revision. The report correctly identifies the key results on the deterministic limit and CLT for squared alignments of sample canonical directions, as well as the plug-in estimators.
Circularity Check
No significant circularity
full rationale
The derivation establishes deterministic first-order limits and a CLT for squared alignment of sample canonical directions under the Gaussian finite-rank spiked model with proportional growth, using resolvent trace functionals for the variance. Plug-in estimators are obtained by inverting the outlier eigenvalue map with separate consistency proofs. These steps follow standard non-circular RMT techniques and do not reduce any claimed limit or prediction to a fitted input or self-citation by construction. The central results remain independent of the data-driven estimators.
Axiom & Free-Parameter Ledger
axioms (3)
- domain assumption Gaussian population assumption for the two data blocks
- domain assumption Finite-rank spiked structure in the population covariance
- domain assumption Proportional growth regime where dimensions grow linearly with sample size
Reference graph
Works this paper leans on
-
[1]
Anderson, T. W. (2003). An introduction to multivariate statistical analysis , volume 3. Wiley New York
2003
-
[2]
and feng Yao, J
Bai, Z. and feng Yao, J. (2008). Central limit theorems for eigenvalues in a spiked population model. Annales de l’Institut Henri Poincaré, Probabilités et Statistiques , 44(3):447 – 474
2008
-
[3]
Bai, Z., Hou, Z., Hu, J., Jiang, D., and Zhang, X. (2022). Limiting canonical distribution of two large-dimensional random vectors. In Methodology and Applications of Statistics: A Volume in Honor of CR Rao on the Occasion of his 100th Birthday , pages 213–238. Springer
2022
-
[4]
Bai, Z., Miao, B., and Pan, G. (2007). On asymptotics of eigenvectors of large sample covariance matrix. The Annals of Probability , 35(4):1532–1572
2007
-
[5]
Bai, Z. D. and Silverstein, J. W. (2004). CLT for linear spectral statistics of large-dimensional sample covariance matrices. The Annals of Probability , 32(1A):553 – 605
2004
-
[6]
Bao, Z., Ding, X., Wang, J., and Wang, K. (2022). Statistical inference for principal com- ponents of spiked covariance matrices. The Annals of Statistics , 50(2):1144–1169
2022
-
[7]
Bao, Z., Ding, X., and Wang, K. (2021). Singular vector and singular subspace distribution for the matrix denoising model. Ann. Statist. , 49(1):370–392
2021
-
[8]
Bao, Z., Hu, J., Pan, G., and Zhou, W. (2019). Canonical correlation coefficients of high- dimensional gaussian vectors: Finite rank case. The Annals of Statistics , 47(1):612–640
2019
-
[9]
Bao, Z., Wang, D., and Zhu, Y. (2026). Eigenvector distribution of random matrices under critical finite-rank deformations
2026
-
[10]
Bykhovskaya, A. and Gorin, V. (2023). High-dimensional canonical correlation analysis. arXiv preprint arXiv:2306.16393
-
[11]
Fan, J., Fan, Y., Han, X., and Lv, J. (2022). Asymptotic theory of eigenvectors for random matrices with diverging spikes. Journal of the American Statistical Association, 117(538):996– 1009
2022
-
[12]
Gittins, R. (1985). Canonical Analysis: A Review with Applications in Ecology , volume 12 of Biomathematics. Springer, Berlin, Heidelberg
1985
-
[13]
Harold, H. (1936). Relations between two sets of variables. Biometrika, 28(3):321–377
1936
-
[14]
Hotelling, H. (1935). The most predictable criterion. Journal of educational Psychology , 26(2):139
1935
-
[15]
Hou, Z., Zhang, X., Bai, Z., and Hu, J. (2023). Spiked eigenvalues of noncentral fisher matrix with applications. Bernoulli, 29(4):3171–3197
2023
-
[16]
Lei, J. (2016). A goodness-of-fit test for stochastic block models. The Annals of Statistics , 44(1):401–424. 45
2016
-
[17]
Li, Y., Zhou, H., and Hu, J. (2023). The eigenvector lsd of information plus noise matrices and its application to linear regression model. Statistics & Probability Letters , 197:109811
2023
- [18]
-
[19]
and Pastur, L
Lytova, A. and Pastur, L. (2009). Central limit theorem for linear eigenvalue statistics of random matrices with independent entries. The Annals of Probability , 37(5):1778 – 1840
2009
-
[20]
and Yang, F
Ma, Z. and Yang, F. (2023). Sample canonical correlation coefficients of high-dimensional random vectors with finite rank correlations. Bernoulli, 29(3):1905–1932
2023
-
[21]
Muirhead, R. J. (1982). Aspects of multivariate statistical theory . John Wiley & Sons
1982
-
[22]
Paul, D. (2007). Asymptotics of sample eigenstructure for a large dimensional spiked covariance model. Statist. Sinica , 17(4):1617–1642
2007
- [23]
-
[24]
Wachter, K. W. (1980). The Limiting Empirical Measure of Multiple Discriminant Ratios. The Annals of Statistics , 8(5):937 – 957
1980
-
[25]
Xi, H., Yang, F., and Yin, J. (2020). Convergence of eigenvector empirical spectral distri- bution of sample covariance matrices. The Annals of Statistics , 48(2):953–982
2020
-
[26]
Xia, N., Qin, Y., and Bai, Z. (2013). Convergence rates of eigenvector empirical spec- tral distribution of large dimensional sample covariance matrix. The Annals of Statistics , 41(5):2572–2607
2013
-
[27]
Yang, F. (2022). Limiting distribution of the sample canonical correlation coefficients of high-dimensional random vectors. Electronic Journal of Probability , 27:1–71
2022
-
[28]
and Pan, G
Yang, Y. and Pan, G. (2012). The convergence of the empirical distribution of canonical correlation coefficients. Electronic Journal of Probability , 17:1–13
2012
-
[29]
and Pan, G
Yang, Y. and Pan, G. (2015). Independence test for high dimensional data based on regularized canonical correlation coefficients. The Annals of Statistics , 43(2):467–500
2015
- [30]
discussion (0)
Sign in with ORCID, Apple, or X to comment. Anyone can read and Pith papers without signing in.