REVIEW 3 major objections 5 minor 20 references
An 11-site, 49-minute eclipse sequence maps inner-corona plasma flows and clocks a polar downflow at 37 km/s.
Reviewed by Pith at T0; open to challenge. T0 means a machine referee read the full paper against a public rubric. the ladder, T0–T4 →
T0 review · deepseek-v4-flash
2026-08-02 06:13 UTC pith:ZGPIRSV3
load-bearing objection A useful, honest multi-site eclipse dataset and a credible polar downflow measurement; the optical-flow velocity map is suggestive but less supported than the headline suggests. the 3 major comments →
Structure and Dynamics of the Inner Corona Measured from the DEB Initiative 2024 Eclipse Image Sequence
The pith
A machine-rendered reading of the paper's core claim, the machinery that carries it, and where it could break.
Core claim
At the core of the paper is a claim that the apparent motions of coronal brightness features in the DEB image sequence are real plasma flows. The authors use optical flow to produce radial velocity maps of the inner corona. They measure a downflow near the north pole at position angle 16 degrees, moving inward from about 2.12 to 1.97 solar radii with an average speed of 37.2 ± 2.9 km/s and a deceleration of 13.7 ± 2.7 m/s², values that agree with the predictions of the 2026 data-constrained MHD simulation. The same maps show the predicted mixture of outflows and downflows at low heights, outflows in the southwestern and northwestern corona, and a fast outflow of 105 km/s above the east limb
What carries the argument
The load-bearing tool is a time-lapse image sequence: 11 telescopes along the 2024 eclipse path, spread over 2700 km, produced HDR images every 5 seconds, which were aligned to a common frame using phase-correlation and affine transforms. Onto this registered sequence the authors apply optical-flow tracking, which estimates the apparent displacement of brightness patterns between frames and thereby yields a velocity field. They validate the method against the known motion of a star, and against a height-time track of the polar downflow. For the static structure, they measure the Ludendorff flattening parameter by fitting isophote diameters at fixed position angles, and also fit ellipses to t
Load-bearing premise
The central assumption is that the apparent motion of brightness features tracked by optical flow equals the line-of-sight-integrated plasma velocity, rather than the propagation of waves or the evolution of structures.
What would settle it
A decisive test would be to observe the same coronal region simultaneously in white light and in a Doppler-sensitive coronal emission line (such as Fe XIV) and compare the radial velocity component of the optical-flow map with the Doppler shift; a systematic disagreement larger than the stated uncertainties would rule out the plasma-flow interpretation.
If this is right
- Future eclipse networks can combine white-light intensity and radial-velocity maps to constrain inner-corona MHD models more tightly.
- The polar downflow measurement provides a quantitative test for data-constrained MHD simulations of the 2024 corona.
- The direct Ludendorff index measurement implies that published extrapolation techniques yield biased values; compiling a corrected index series may change apparent correlations with the solar cycle.
- The optical-flow method, once validated, can be applied to archival eclipse image sequences to look for long-term changes in inner-corona flow patterns.
Where Pith is reading between the lines
- If the optical-flow velocities are accepted as plasma motions, the same technique could be turned on any multi-site eclipse sequence, producing a historical archive of inner-corona flows without new instrumentation.
- The disagreement between direct and extrapolated Ludendorff values suggests that some reported correlations between the flattening index and solar-cycle phase may need re-examination.
- The 105 km/s east-limb outflow, if it is a transient jet, could be identifiable in other 2024 eclipse data as a moving feature in the pseudostreamer region, offering an independent check.
- Because white-light observations integrate along the line of sight, comparing velocity maps with Doppler measurements from coronal emission lines would separate projection effects from true flows.
Editorial analysis
A structured set of objections, weighed in public.
Referee Report
Summary. This paper uses 11 clear-sky DEB Initiative sites spanning 2700 km to observe the 2024 April 8 total solar eclipse over 49 minutes. It builds HDR images, coaligns them, and derives azimuthally averaged brightness profiles from 1.2 to 3.7 solar radii that are internally consistent and calibrated to the Boe et al. (2025) continuum profile. The paper measures the Ludendorff flattening index directly at 2.0 solar radii as 0.0761 ± 0.0007, argues that linear/parabolic extrapolation recipes used by prior authors disagree with this direct measurement, and proposes ellipticity and position angle of fitted isophotes as more stable structure descriptors. For dynamics, the paper applies Farneback optical flow to the image sequence and height-time tracking to a dark polar feature, reporting a polar downflow of -37 ± 3 km/s with deceleration 14 ± 3 m/s², and compares the observed radial velocity map qualitatively with the MHD predictions of Li et al. (2026). The fastest outflow, 105 km/s over the east limb, is attributed to a transient not captured by the model.
Significance. If the results hold, this paper demonstrates that a coordinated citizen-science network can produce photometrically consistent inner-corona brightness profiles and a first observational velocity map for the 2024 eclipse. The direct Ludendorff-index measurement is a useful check on historical extrapolation methods, and the polar downflow is a rare white-light measurement of a coronal flow at heights where MHD models make specific predictions. The paper has real strengths: 11-site redundancy for the static structure, an external photometric calibration, a two-method cross-check for the polar downflow, and a clear restriction of the photometric analysis to heights below 3.7 solar radii. The main risk is the dynamical claim: the optical-flow velocity map is validated only against a point source with an 18.5° direction error and a single extended feature, and the model comparison is qualitative. These concerns are specific and addressable, so the paper merits revision rather than rejection.
major comments (3)
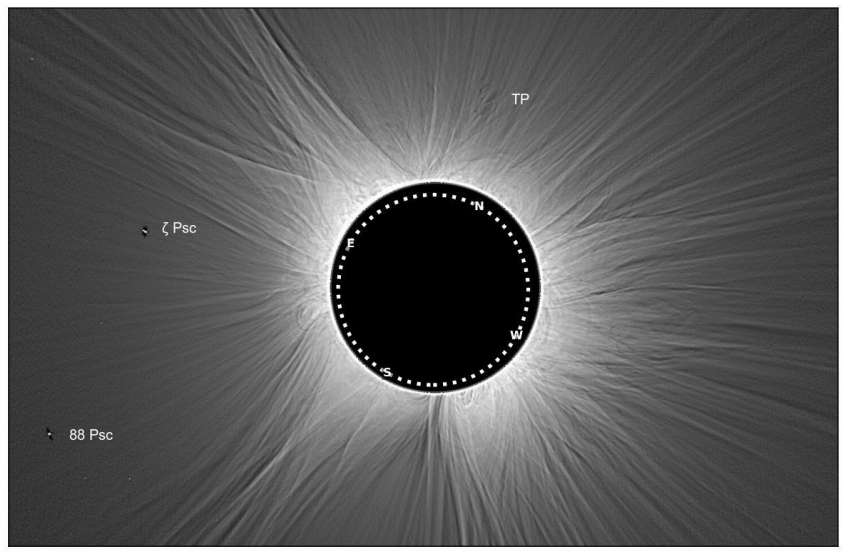
- [Section 4, Fig. 4] The validation of the optical-flow map is not sufficient for the central claim that Fig. 4 measures coronal plasma velocity. The point-source check (ζ Psc) gives a direction 18.5° off the ephemeris with the same 30×30-pixel box used for the coronal map; the authors attribute this to box size but do not quantify the bias for extended features. The only extended-feature check is the single north-polar downflow (39.7 vs 37.2±2.9 km/s). No per-pixel uncertainties or synthetic tests are provided. Since the radial component is the quantity compared with Li et al., a systematic directional error of even 10° could change the comparison substantially. Please add uncertainty maps or synthetic validation and quantify the directional sensitivity of the radial velocity map.
- [Section 4, model comparison] The agreement with Li et al. is explicitly qualitative, and the paper notes that the model prediction is a meridional slice while the observations are line-of-sight integrated and that this difference 'likely introduces disagreements.' The abstract nevertheless states the downflow 'agrees' with the model, and Fig. 4 is not overlaid on or quantitatively compared with the model prediction. To support the headline claim, either integrate the model along the line of sight and compute residuals, or restrict the claimed agreement to the height-time polar downflow and describe the other features as suggestive rather than confirmed.
- [Section 4, height-time downflow] The polar downflow is tracked only between 2.12 and 1.97 solar radii. The paper reports F≈30 for linear vs quadratic fits but does not state the number of independent height measurements, the time baseline, or the degrees of freedom, so the significance of the 14 m/s² deceleration cannot be checked. Moreover, the interpretation of the dark feature as a persistent plasma structure—rather than a propagating density perturbation or an evolving structure—is assumed. Please show the height-time trajectory, give the fit details, and discuss alternate interpretations in light of prior white-light downflow measurements.
minor comments (5)
- [Abstract vs Sections 2-3] The abstract says brightness profiles are tightly correlated from 1.2 to 4.0 solar radii, while Sections 2-3 restrict the analysis to below 3.7 and report alignment artifacts above about 4.0. Please reconcile the stated radial range.
- [Section 3] The text says one DEB site deviates from the others above 3.0 solar radii but also claims excellent agreement up to 3.7. Specify which site is the outlier and how it is treated in the 1.2-3.7 range used for structure analysis.
- [Section 4] The phrase 'significant agreements' is used without a statistical test; unless a quantitative metric is provided, rephrase as 'qualitative agreement.'
- [Fig. 4 caption] The caption should state the color-scale range and units for the radial velocity and describe how the masked region near the lunar limb and field edges is defined.
- [General] The stellar designation is typeset variously as '𝞻 Psc' and 'ζ Psc'; please use a consistent notation throughout.
Circularity Check
No significant circularity: the central claims are compared against external models and prior measurements rather than derived from the paper's own inputs.
full rationale
The paper's main results are independent of its inputs. The polar downflow velocity (-37 ± 3 km/s) and deceleration (14 ± 3 m/s²) come from height-time tracking and optical flow of the DEB image sequence, and the comparison with Y. Li et al. (2026) is against an external MHD model that was not calibrated to these observations and whose velocity maps were published before this analysis. The Ludendorff index of 0.0761 ± 0.0007 is a direct measurement from the DEB isophotes; the disagreement with extrapolation recipes (Priyatikanto 2016, linear fits) is an empirical comparison, not a fitted prediction. The photometric calibration uses B. Boe et al. (2025) as a reference, so the resulting correspondence with Boe's profile is partly a calibration consistency check rather than an independent validation; however, this is not a central claim and the radial profile shape across 1.2–3.7 R_sun is not forced by a single scaling normalization. The optical-flow validation is admittedly approximate (7% speed and 18.5° direction error on ζ Psc), but this is a validation-strength concern, not circularity. Self-citations (Penn et al. 2020, Mandrell et al. 2025) appear only as background/instrumentation references and are not load-bearing justification for the main results. No step reduces by construction or by self-citation to its own inputs.
Axiom & Free-Parameter Ledger
free parameters (5)
- per-site intensity normalization factor =
site-1-relative values, not tabulated
- Boe et al. calibration scalar =
single constant, not stated in text
- optical flow box size =
30x30 image pixels
- HDR/filter parameters rho, sigma, p, q, epsilon =
rho approx 8, sigma=0, p=q=0.1, epsilon=3 (azimuthal filter size varies slightly by site)
- Affine transform registration parameters =
per-site translation, rotation, scale
axioms (5)
- domain assumption White-light coronal brightness is Thomson-scattered K-corona plus F-corona, with the van de Hulst (1950) F-corona model as background; brightness is proportional to line-of-sight-integrated electron density.
- standard math Optical flow assumes brightness constancy between frames (dI/dt + grad(I).v = 0).
- domain assumption Apparent motion of brightness features equals plasma motion.
- domain assumption The Li et al. (2026) MHD model's predicted velocity field is an appropriate benchmark for the 2024 eclipse corona.
- domain assumption The Affine registration fully removes telescope-to-telescope differences (rotation, scale, translation) so remaining feature motion is coronal.
read the original abstract
The Dynamic Eclipse Broadcast (DEB) Initiative citizen science program observed coronal visible continuum brightness during the 2024 April 8 total eclipse from locations across North America. We present results from 11 DEB sites spanning 2700 km of distance and showing 49 minutes of evolution. The coronal brightness radial profiles from these telescopes are tightly correlated from 1.2 to 4.0 solar radii and comparable to published photometric coronal intensities. The coronal flattening parameter is measured from 1.4 to 2.8 solar radii. A Ludendorff index of 0.0761 +/- 0.0007 is computed but the extrapolation techniques used by some to calculate this index are shown to disagree with this direct measurement, and alternate structure parameters are suggested. Measured radial velocities are compared with an MHD model of the corona during the eclipse from Y. Li et al. (2026). A polar downflow is measured with an average radial velocity of -37 +/- 3 km s-1 and a deceleration of 14 +/- 3 m s-2 at a speed and position which agrees with the model. The predicted mixture of outflows and downflows at low heights is seen, as well as outflows in two western regions of the corona. The fastest observed outflow has a radial speed of 105 km s-1 and is likely associated with a transient event not predicted by the model. Future DEB Initiative eclipse experiments can more tightly constrain models of the inner corona by using both coronal intensity and radial velocity measurements.
Figures


Reference graph
Works this paper leans on
-
[1]
Baratashvili, T. et al. 2026, A&A, 705, A145, https://doi.org/10.1051/0004-6361/202556300
-
[2]
Boe, B., Habbal, S., Druckmuller, M., et al. 2025, arXiv:2512.01068v1
arXiv 2025
-
[3]
Dani, T. et al. 2016, Ludendorff coronal flattening index of the total solar eclipse on March 9, 2016, J. Phys. Conf. Ser., 771, 1, 012005
2016
-
[4]
Downs, C. et al. 2025, Science, 388, 1306, doi:10.1126/science.adq0872 Druckmüller, M., Rušin, V., & Minarovjech, M. 2006, Contributions of the Astronomical Observatory Skalnaté Pleso, 36, 3, 131
-
[5]
2009, ApJ, 706, 1605 Farnebäck, G
Druckmuller, M. 2009, ApJ, 706, 1605 Farnebäck, G. 2003, Lecture Notes in Computer Science, Vol. 2749, Proc. 13th Scandinavian Conference on Image Analysis, ed. J. Bigun & T. Gustavsson (Berlin: Springer), 363
2009
-
[6]
Foing, B.H., & the ESA Eclipse 99 Team 1999, BAAS, 31, 1449
1999
-
[7]
Gissot, S.F. & Hochedez, J.-F. 2007, A&A, 464, 1107, doi:10.1051/0004- 6361:20065553
doi:10.1051/0004- 2007
-
[8]
Hanaoka, Y. et al. 2018, ApJ, 860, 142
2018
-
[9]
Hudson, H. S. et al. 2011, arXiv:1108.3486
Pith/arXiv arXiv 2011
-
[10]
Li, L.P. et al. 2016, ApJL, 829, L33, doi:10.3847/2041-8205/829/2/L33
-
[12]
1928, Weitere Untersuchungen über die Form der Sonnenkorona Sitzungsberichte der Preußischen Akademie der Wissenschaften, Physikalisch-Mathematische Klasse, 16, 185–214
Ludendorff, H. 1928, Weitere Untersuchungen über die Form der Sonnenkorona Sitzungsberichte der Preußischen Akademie der Wissenschaften, Physikalisch-Mathematische Klasse, 16, 185–214
1928
-
[13]
Mandrell, C. et al. 2025, PASP, 137, 125007
2025
-
[14]
1999, ApJL, 519, L93
McKenzie, D.E., & Hudson, H.S. 1999, ApJL, 519, L93
1999
-
[15]
Penn, M.J. et al. 2020, PASP, 132, 014201
2020
-
[16]
2011, Solar Physics, 270, 347, doi:10.1007/s11207-011-9749-y
Pishkalo, M. 2011, Solar Physics, 270, 347, doi:10.1007/s11207-011-9749-y
-
[17]
2016, RAA, 16, 12, 181
Priyatikanto, R. 2016, RAA, 16, 12, 181
2016
-
[18]
Romano, P. et al. 2025, ApJ, 982, 142, https://doi.org/10.3847/1538- 4357/adb1da
doi:10.3847/1538- 2025
-
[19]
2017, Solar Physics, 292, 24
Rusin, V. 2017, Solar Physics, 292, 24
2017
-
[20]
2002, ApJ, 579, 874 Van de Hulst, H.C
Sheeley, N.R., & Wang, Y.-M. 2002, ApJ, 579, 874 Van de Hulst, H.C. 1950, Bulletin Astronomical Institutes Netherlands, 11, 410, 135
2002
-
[21]
Zhukov, A.N. et al. 2026, ApJL, 999, L41, https://doi.org/10.3847/2041- 8213/ae469b
doi:10.3847/2041- 2026
discussion (0)
Sign in with ORCID, Apple, or X to comment. Anyone can read and Pith papers without signing in.