REVIEW 3 major objections 6 minor 25 references
Balancing the Last Birth: A Game-Theoretical Resolution to the Human Sex Ratio Puzzle
T0 review · 3 major / 6 minor · reviewed 2026-08-06 · deepseek-v4-flash
Pith's one-line read Sex-ratio evolution is stabilized at the last-born child: the evolutionarily stable son probability is $p_s^* = (1-b_d)/(2-b_s-b_d)$, which makes last-born sons and daughters equally likely even when births are male-biased.
desk verdict A thoughtful extension of Fisher with a testable last-born sex-ratio prediction, but the ESS claim rests on a non-standard fitness measure that needs real justification. read the letter →
The pith
A machine-rendered reading of the paper's core claim, the machinery that carries it, and where it could break.
The reading
What carries the argument
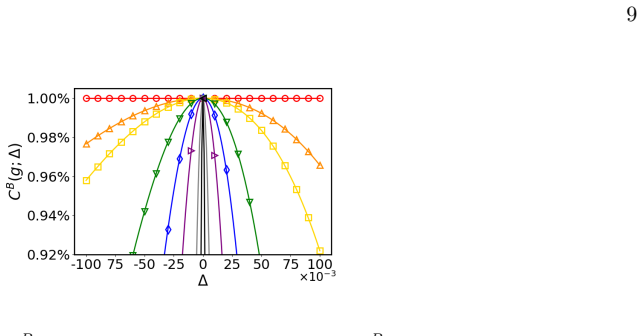
The load-bearing identity is $p_s^*(1-b_s) = p_d^*(1-b_d)$: balancing the probability that a son is the last child against the probability that a daughter is the last child. Algebraically this gives $p_s^* = (1-b_d)/(2-b_s-b_d)$, so the model's equilibrium son probability is determined entirely by the two continuation probabilities. The stability proof is carried by the fitness measure $C^B$, the frequency of a gene among reproductively paired individuals (Eq. 7), rather than the whole-population gene frequency $X^B$; under $C^B$, a mutant son probability $p_s^* + \Delta$ has lower fitness from the first generation onward, which is what establishes the evolutionarily stable strategy.
What would settle it
Measure the sex of the last child in completed families in a historical or pre-modern population with a known male-biased birth sex ratio; the model predicts the last-born sex ratio will be approximately 1:1 whenever continuation probabilities differ after sons and daughters. If last-born sons are systematically overrepresented or underrepresented in such a population, the balancing identity $p_s^*(1-b_s)=p_d^*(1-b_d)$ would be contradicted as a description of evolved stopping rules.
Extended reading notes
Core claim
The central discovery is a generalization of Fisher's principle: when the stopping rule for reproduction is sex-dependent, natural selection does not balance the sex ratio at birth; it balances the sex ratio among last-born children. Using a game-theoretical model with son probability $p_s$ and continuation probabilities $b_s$ (after a son) and $b_d$ (after a daughter), the paper derives the evolutionarily stable son probability $p_s^* = (1-b_d)/(2-b_s-b_d)$, which is equivalent to $p_s^*(1-b_s) = p_d^*(1-b_d)$, i.e., the probability that the last child is a son equals the probability that it is a daughter. Under the standard whole-population fitness measure, this value is not an evolutionarily stable strategy by the second generation, so the paper introduces the matched-pair gene frequency $C^B$ and proves that $p_s^*$ is a unique and globally stable evolutionarily stable strategy under this measure. The same mechanism, with higher male child mortality and higher continuation after a child's death, yields a male-biased birth ratio that brackets the observed human value of about 105 boys per 100 girls.
Load-bearing premise
The load-bearing premise is that the new fitness measure $C^B$—gene frequency among reproductively paired individuals, rather than gene frequency in the whole population—is the correct measure of reproductive success for a sex-ratio trait; if that choice is rejected, the proof that the 1:1 last-born ratio is an evolutionarily stable strategy no longer goes through.
Editorial extensions
If this is right
- When $b_s = b_d$, the formula reduces to $p_s^* = 1/2$, so Fisher's classical 1:1 birth sex ratio is recovered as a special case.
- If parents are more likely to continue after a son than after a daughter, the steady state has a male-biased sex ratio at birth while the sex ratio among last-born children remains 1:1.
- The human sex ratio of about 105 boys per 100 girls falls inside the model's predicted range when male and female survival to adulthood are set near 0.5 and 0.55 and parents are more likely to have another child after a child's death.
- The model predicts that any population with a biased birth sex ratio produced by sex-dependent continuation will still show an approximately balanced sex ratio among last-born children, a prediction the paper suggests testing on historical human populations or beef cattle.
- Under the matched-pair fitness measure, $p_s^*$ is globally stable: no nearby alternative son probability can invade, so the balanced last-born ratio is a long-run attractor rather than a transient outcome.
Reading between the lines
- The paper's proof depends on choosing $C^B$ over the traditional whole-population fitness; if one regards the second-generation descendant count as the proper target of selection, the mathematical ESS result does not follow, even though the algebraic identity and simulations remain intact.
- If empirical data on completed sibships show a last-born sex ratio at 1:1 despite a biased birth ratio, sex-ratio evolution would be better described as selection for balanced last births, with biased births an incidental consequence of mortality and continuation asymmetries.
- A natural extension would let $b_s$ and $b_d$ themselves evolve alongside $p_s$; in that setting the balancing target could shift, for instance under cultural son preference or sex-selective stopping.
- The prediction could be tested directly with modern birth-register data that record birth order and child survival: among families with completed reproduction, the last child's sex should be unbiased even in populations with an overall male-biased sex ratio at birth.
Signed reviews
Editorial analysis
A structured set of objections, weighed in public.
Referee Report
Summary. The paper studies a sex-ratio evolution model in which a couple's probability of having another child depends on the sex of the previous child, with continuation probabilities bs and bd. The authors derive a steady-state son probability p*_s = (1-bd)/(2-bs-bd) and show algebraically (Eq. 4) that this condition is equivalent to a 1:1 sex ratio among last-born children (SRLB), even when the sex ratio at birth is biased. They claim that this 1:1 SRLB is an evolutionarily stable strategy under a newly introduced fitness measure, the frequency of a gene in matched reproductive pairs (C^B), and they apply the model to the human male-biased SRB by fitting bs and bd to historical mortality and the observed 105:100 sex ratio. The steady-state formula is supported by a data collapse across 100 parameter combinations (Fig. 1c) and by simulations showing convergence of the last-born sex ratio to 0.5 (Fig. 2). The ESS proof, however, relies on a nonstandard fitness measure and a Mathematica computation in Appendix B that is not shown.
Significance. If confirmed, the paper would offer a novel, falsifiable generalization of Fisher's principle: the equilibrating quantity is the sex ratio at last birth rather than the sex ratio at birth. The algebraic identity in Eq. (4) is elegant, and the data collapse in Fig. 1c is a strong numerical result. The year-by-year simulations and the parameter bounds in Section V give the model some empirical contact, and the explicit prediction of a 1:1 SRLB is testable in historical or animal populations. However, the central stability claim is currently conditional on a fitness measure C^B that is introduced for this purpose, and the authors themselves show (Fig. 3) that p*_s is not an ESS under the standard whole-population gene-frequency measure at the second generation. The significance of the paper therefore depends on whether the C^B-based proof can be converted into a rigorous, standard invasion argument or clearly justified as the correct fitness currency for sex-ratio traits; at present the manuscript does not provide such a justification.
major comments (3)
- [Section IV, Eq. (7) and Fig. 3]
- [Appendix B]
- [Section V, Eqs. (8)-(9)]
minor comments (6)
- [Section III, Eq. (3)]
- [Section IV, Eq. (5)]
- [Section II]
- [Abstract and Section III]
- [Section II and Ref. [25]]
- [Section V]
Circularity Check
No significant circularity: the paper's central derivation is self-contained, and its human-SRB application includes an independent prediction interval rather than a fitted restatement.
full rationale
No load-bearing step reduces to its own inputs. p*_s in Eq. (3) is obtained as the simulated steady-state male ratio and is then shown to be algebraically equivalent to the 1:1 last-born condition in Eq. (4); the equivalence is a consequence, not a definition. The ESS proof in Section IV and Appendix B is explicitly conditional on the matched-pair fitness measure C^B (Eq. 7); p*_s is not defined as the maximizer of C^B, and the Appendix reports a nontrivial derivative condition (∂C~B/∂Δ = 0 at Δ=0 only for ps=p*_s). The paper's admission that p*_s is not an ESS under the standard whole-population measure at g=2 (Fig. 3) is a stated limitation of the standard measure, not a circularity. In the human application, b_s and b_d are calibrated to the observed 105:100 SRB via Eqs. (8)-(9), but the theoretical range 100:100 to 133:100 and the year-by-year simulation yielding 103:100 are independent of that calibration. Reproducibility concerns (placeholder Github URL, Mathematica-based proof in Appendix B) are noted but do not constitute circularity.
Assumptions & free parameters
free parameters (9)
- b_s (continuation probability after a son) =
0.738 in the human application; otherwise a model input
- b_d (continuation probability after a daughter) =
0.725 in the human application
- b1 (continuation when last child is alive) =
0.59
- b2 (continuation when last child has died) =
0.89
- S_s (male survival to adulthood) =
0.5
- S_d (female survival to adulthood) =
0.55
- K (carrying capacity for children) =
not specified
- mutation rate mu =
not specified
- mutation step delta =
not specified
assumptions (7)
- ad hoc to paper Fitness for sex-ratio traits is measured as the frequency of a gene among reproductively paired individuals (C^B), not among the whole population.
- domain assumption The child's sex is determined by the father's son-probability p_s, and the gene is inherited from either parent with equal probability.
- domain assumption Continuation probabilities b_s and b_d are fixed and not subject to selection.
- domain assumption Mating is random and monogamous within a generation.
- domain assumption In the human application, each couple produces on average one daughter who survives to adulthood (n_d,ad = 1) for population stability.
- domain assumption If a child dies before adulthood it is likely the youngest child, so d_s = 1 - S_s and d_d = 1 - S_d.
- standard math Mathematica symbolic differentiation and root-finding correctly identify the unique ESS.
invented entities (1)
-
Matched-pair fitness measure C^B
Cite this review
Pith. "Pith review of Balancing the Last Birth: A Game-Theoretical Resolution to the Human Sex Ratio Puzzle." pith.science (2026). https://pith.science/paper/ZWV3DXGG
@misc{pith2026250710332,
  author       = {Pith},
  title        = {Pith review of: Balancing the Last Birth: A Game-Theoretical Resolution to the Human Sex Ratio Puzzle},
  year         = {2026},
  howpublished = {\url{https://pith.science/paper/ZWV3DXGG}},
  note         = {Machine review of arXiv:2507.10332}
}
read the original abstract
We study the evolution of offspring sex ratios using a game-theoretical model in which the decision to have another child depends on the sex of the previous child. Motivated by higher male infant mortality and the tendency to try again after a child's death, our model allows different continuation probabilities after sons and daughters. We find that a stable sex ratio at birth (SRB) differing from 1:1 can arise when these continuation probabilities differ. However, the sex ratio among last-born children (SRLB) always converges to 1:1. We mathematically prove that this 1:1 SRLB is an evolutionarily stable strategy under a new fitness measure based on the number of offspring in successful mating pairs, rather than the number of descendants in the whole population. Our results generalize Fisher's principle by showing that equilibrium is maintained at the level of last births even when the overall SRB is biased. This offers a potential explanation for the persistent slight male bias in human births, linking it to sex-specific child mortality and parental reproductive strategies in historical populations.
Figures


Figures from the paper (1 more)
Reference graph
Works this paper leans on
-
[1]
R. A. Fisher, The genetical theory of natural selection(Oxford University Press, Oxford, United King- dom, 1930)
work page 1930
-
[2]
Chahnazarian, Population and Development Review 17, 1 (1991)
A. Chahnazarian, Population and Development Review 17, 1 (1991)
work page 1991
-
[3]
C. Z. Guilmoto, UNFPA Asia and the Pacific Regional Office (2012)
work page 2012
- [4]
-
[5]
A. B. Clark, Science 201, 163 (1978)
work page 1978
-
[6]
W. D. Hamilton, Science 156, 477 (1967)
work page 1967
-
[7]
P. A. Gowaty, The American Naturalist 141, 263 (1993)
work page 1993
-
[8]
R. L. Trivers and D. E. Willard, Science 179, 90 (1973)
work page 1973
Show all 25 references
-
[9]
S. A. Frank, Annual Review of Ecology and Systematics , 13 (1990)
1990
-
[10]
Argasi´ nski, Banach Center Publications1, 217 (2008)
K. Argasi´ nski, Banach Center Publications1, 217 (2008)
2008
-
[11]
Gardner, in Encyclopedia of Evolutionary Psychological Science, edited by T
A. Gardner, in Encyclopedia of Evolutionary Psychological Science, edited by T. K. Shackelford and V. A. Weekes-Shackelford (Springer International Publishing, Cham, 2019) pp. 1–4
2019
-
[12]
S. H. Orzack, J. W. Stubblefield, V. R. Akmaev, P. Colls, S. Munn´ e, T. Scholl, D. Steinsaltz, and J. E. Zuckerman, Proceedings of the National Academy of Sciences 112, E2102 (2015)
2015
-
[13]
F. Chao, P. Gerland, A. R. Cook, and L. Alkema, Proceedings of the National Academy of Sciences 116, 9303 (2019)
2019
-
[14]
birth data
Centers for Disease Control and Prevention, Trends in the sex ratio at birth — United States, 1940– 2002, Surveillance Summary (Morbidity and Mortality Weekly Report (MMWR), 2005) cDC report analyzing 60 years of U.S. birth data
1940
-
[15]
Mortality in the past: every second child died,
M. Roser, “Mortality in the past: every second child died,” https://ourworldindata.org/ child-mortality-in-the-past (2023), our World in Data
2023
-
[16]
G. L. Drevenstedt, E. M. Crimmins, S. Vasunilashorn, and C. E. Finch, Proceedings of the National Academy of Sciences 105, 5016 (2008)
2008
-
[17]
World population prospects 2024 – processed by our world in data,
U. Nations, “World population prospects 2024 – processed by our world in data,” https: //ourworldindata.org/explorers/population-and-demography?indicator=Number+of+infant+ deaths\&Sex=Male\&Age=Under+1+year\&Projection+scenario=None\&country=~OWID_WRL (2024), our World in Data
2024
-
[18]
Pozzi and D
L. Pozzi and D. R. Fari˜ nas, Annales de D´ emographie Historique2015, 55 (2015). 19
2015
-
[19]
C. C. Sawyer, PLoS Medicine 9, e1001287 (2012), analyzes trends in male-to-female mortality ratios in childhood (0–4 years) from 1970s to 2000s
2012
-
[20]
Z. H. Aghai, S. S. Goudar, A. Patel, S. Saleem, S. M. Dhaded, A. Kavi, P. Lalakia, F. Naqvi, P. L. Hibberd, E. M. McClure, T. L. Nolen, P. Iyer, R. L. Goldenberg, and R. J. Derman, Reproductive Health 17, 178 (2020), data from 2010–2018; male neonatal mortality 33.2 ‰ vs female 27.4 ‰
2020
-
[21]
D. B. Laster, H. A. Glimp, and K. E. Gregory, Journal of Animal Science 36, 822 (1973)
1973
-
[22]
D. P. Berry and A. R. Cromie, Journal of Dairy Science 90, 3849 (2007)
2007
-
[23]
G. E. Seidel Jr, Animal Reproduction Science 79, 145 (2003)
2003
-
[24]
Research, Mathematica, Version 13.3, Wolfram Research, Inc., Champaign, IL, USA (2023), avail- able at https://www.wolfram.com/mathematica
W. Research, Mathematica, Version 13.3, Wolfram Research, Inc., Champaign, IL, USA (2023), avail- able at https://www.wolfram.com/mathematica
2023
-
[25]
Lee, “Github,” https://github.com/XXX (2025)
N. Lee, “Github,” https://github.com/XXX (2025)
2025
Reviewed August 6, 2026 · model on record in the stance chip above.
Discussion (0). Continue with ORCID to comment.