Exploring Students' Understanding of Linear and Quadratic Relationships in a Projectile Motion Context
Pith reviewed 2026-05-16 23:30 UTC · model grok-4.3
The pith
Prompts comparing linear and quadratic relationships in projectile motion foster more sophisticated covariational reasoning in students.
A machine-rendered reading of the paper's core claim, the machinery that carries it, and where it could break.
Core claim
In the teaching experiment the two students' covariational reasoning evolved as they engaged with the digital projectile task; prompts that encouraged direct comparison of linear and quadratic relationships produced more sophisticated forms of reasoning about covarying quantities. Task design elements including the technology affordances, the focus on graphs as representations of covarying quantities, and the use of non-canonical graphing tasks supported this development.
What carries the argument
Covariational reasoning applied to comparing linear and quadratic relationships between height and time in projectile motion graphs.
If this is right
- Students can move beyond surface-level descriptions of graphs when tasks require explicit comparison of different patterns of change.
- Digital simulations that let students manipulate projectile trajectories make the simultaneous variation of height and time more visible.
- Non-canonical graphing activities can help students treat graphs as records of covarying quantities rather than static shapes.
- Classroom prompts that ask students to contrast linear and quadratic relationships can be inserted into existing motion units to strengthen foundational reasoning.
Where Pith is reading between the lines
- Similar comparison prompts could be tested in other contexts where quantities change together, such as velocity or distance in different motion scenarios.
- The approach might scale to larger classroom groups if the prompts are embedded in standard curriculum materials without researcher facilitation.
- Future work could examine whether the reasoning gains transfer to algebraic representations of linear and quadratic functions.
Load-bearing premise
The observed improvements in the students' reasoning were produced by the comparison prompts and task features rather than by the researcher's presence, the novelty of the digital tool, or differences between the individual students.
What would settle it
A replication in which two similar students complete the identical digital projectile task without any prompts that contrast linear and quadratic patterns and show no comparable shift in covariational reasoning would weaken the claim.
Figures
read the original abstract
Previous research has shown that students often struggle to develop an understanding of linear and quadratic relationships. Covariational reasoning has been identified as a way to support this development. This study aims to investigate how covariational reasoning supports students in developing understandings of linear and quadratic relationships within a projectile motion context. A teaching experiment was conducted with two middle school students who engaged in a digital task exploring the relationship between height and time. The analysis characterizes how the students' covariational reasoning evolved as they interpreted the changing quantities in the task. The findings suggest that prompts encouraging students to compare linear and quadratic relationships can foster more sophisticated forms of covariational reasoning. The discussion highlights how specific features of the task design, including the affordances of technology, the emphasis on conceiving graphs as representations of covarying quantities, and the use of non-canonical graphing tasks, can support covariational reasoning.
Editorial analysis
A structured set of objections, weighed in public.
Referee Report
Summary. The manuscript reports results from a teaching experiment with two middle school students who used a digital task to explore height-time relationships in projectile motion. Qualitative analysis tracks the evolution of the students' covariational reasoning as they interpreted changing quantities, with the central claim that prompts encouraging comparison of linear and quadratic relationships can foster more sophisticated forms of covariational reasoning. The discussion emphasizes the supportive role of task features including technology affordances, graphs as covarying quantities, and non-canonical graphing tasks.
Significance. If the observed reasoning shifts can be reliably attributed to the comparison prompts and task design, the work adds to physics education research by illustrating how covariational reasoning develops in a concrete physics context and by identifying specific instructional features that may promote it. The qualitative descriptions provide concrete examples that could inform curriculum design, though the small sample limits broader claims.
major comments (2)
- [Methods and Results] Methods and Results sections: The central suggestion (abstract and §5) that comparison prompts foster more sophisticated covariational reasoning rests on observations from only two students in a single teaching experiment. No details are provided on inter-rater reliability, systematic error-checking procedures, or explicit handling of alternative explanations (researcher presence, tool novelty, or individual differences), which is load-bearing for the causality implied in the findings.
- [Discussion] Discussion: The claim that specific task features (technology affordances, emphasis on covarying quantities, non-canonical graphs) support the observed changes lacks systematic variation or control conditions to isolate their unique contribution, leaving the attribution open to the confounds noted in the skeptic's assessment.
minor comments (2)
- [Abstract] Abstract: The abstract could explicitly note the exploratory nature and small sample to appropriately frame the suggestive findings.
- [Results] Notation and figures: Ensure all student quotes and graph interpretations are clearly labeled with timestamps or task phases for easier traceability.
Simulated Author's Rebuttal
We thank the referee for their constructive comments, which have prompted us to improve the transparency of our methods and to qualify our claims more carefully. We have revised the manuscript accordingly.
read point-by-point responses
-
Referee: [Methods and Results] Methods and Results sections: The central suggestion (abstract and §5) that comparison prompts foster more sophisticated covariational reasoning rests on observations from only two students in a single teaching experiment. No details are provided on inter-rater reliability, systematic error-checking procedures, or explicit handling of alternative explanations (researcher presence, tool novelty, or individual differences), which is load-bearing for the causality implied in the findings.
Authors: We acknowledge the small sample size, which is inherent to the teaching-experiment methodology used to generate rich qualitative data on reasoning processes. We have expanded the Methods section to describe our iterative qualitative analysis procedures in greater detail, including how we systematically reviewed transcripts and video data for consistency and considered alternative explanations (such as researcher presence or tool novelty) through thick description of each student's trajectory. We have added explicit language clarifying that the study does not claim general causality but documents observed shifts that coincided with the comparison prompts. Because the analysis was conducted by the lead researcher, we now discuss trustworthiness via reflexive memoing and peer debriefing rather than inter-rater reliability. revision: partial
-
Referee: [Discussion] Discussion: The claim that specific task features (technology affordances, emphasis on covarying quantities, non-canonical graphs) support the observed changes lacks systematic variation or control conditions to isolate their unique contribution, leaving the attribution open to the confounds noted in the skeptic's assessment.
Authors: We agree that the single-condition design precludes isolating the unique contribution of each task feature. We have revised the Discussion to present these features as elements that appeared supportive within the observed interactions, rather than as proven causal factors. We now explicitly note the exploratory character of the work and recommend future studies that incorporate systematic variation or control conditions to test these attributions. revision: partial
Circularity Check
No circularity: qualitative analysis of observed student reasoning stands independently
full rationale
The paper reports a teaching experiment with two middle-school students using a digital projectile-motion task. Its central claims consist of interpretive characterizations of how the students' covariational reasoning evolved during the session and a suggestion that comparison prompts can foster more sophisticated reasoning. These conclusions are drawn directly from transcribed interactions and task features rather than from any derivation, fitted parameter, prediction, or self-referential equation. No load-bearing step reduces to a prior result by the authors themselves, no ansatz is smuggled via citation, and no quantity is renamed as a new prediction. The study is therefore self-contained as an empirical qualitative report; its evidential basis lies in the documented student data, not in any tautological reduction.
Axiom & Free-Parameter Ledger
axioms (1)
- domain assumption Covariational reasoning supports development of understanding linear and quadratic relationships
Lean theorems connected to this paper
-
IndisputableMonolith/Foundation/RealityFromDistinction.leanreality_from_one_distinction unclear?
unclearRelation between the paper passage and the cited Recognition theorem.
The findings suggest that prompts encouraging students to compare linear and quadratic relationships can foster more sophisticated forms of covariational reasoning.
What do these tags mean?
- matches
- The paper's claim is directly supported by a theorem in the formal canon.
- supports
- The theorem supports part of the paper's argument, but the paper may add assumptions or extra steps.
- extends
- The paper goes beyond the formal theorem; the theorem is a base layer rather than the whole result.
- uses
- The paper appears to rely on the theorem as machinery.
- contradicts
- The paper's claim conflicts with a theorem or certificate in the canon.
- unclear
- Pith found a possible connection, but the passage is too broad, indirect, or ambiguous to say the theorem truly supports the claim.
Reference graph
Works this paper leans on
-
[1]
EXPLORINGSTUDENTS’ UNDERSTANDING OFLINEAR AND QUADRATICRELATIONSHIPS IN APROJECTILEMOTION CONTEXT AUTHORACCEPTEDMANUSCRIPT Y osep Dwi Kristanto Department for STEM Didactics Johannes Kepler University Linz Linz, 4040 Mathematics Education Study Program Sanata Dharma University Yogyakarta yosepdwikristanto@usd.ac.id Teo Paoletti School of Education Univers...
work page internal anchor Pith review Pith/arXiv arXiv 2025
-
[2]
This analysis allowed us to trace how their reasoning evolved and supported conceptual development
to analyze how students reasoned about varying quantities as they engaged with tasks involving these relationships. This analysis allowed us to trace how their reasoning evolved and supported conceptual development. The study offers empirical insights into the role of covariational reasoning in fostering students’ understanding of fundamental functional r...
work page 2025
-
[3]
this quantity increases while that quantity decreases
Level Description No coordination The person has no image of variables varying together. The person focuses on one or another variable’s variation with no coordination of values. Pre-coordination of values The person envisions two variables’ values varying, but asynchronously—one variable changes, then the second variable changes, then the first, and so o...
work page 2017
-
[4]
to characterize two students’ activity as they engaged with the Height-Time Relationship Task. The task was part of a larger project aimed at promoting emergent graphical shape thinking, in which students interpret and construct graphs representing covarying quantities (Kristanto and Lavicza 2025; Kristanto, Lavicza, and Martinelli 2025). The teaching exp...
work page 2025
-
[5]
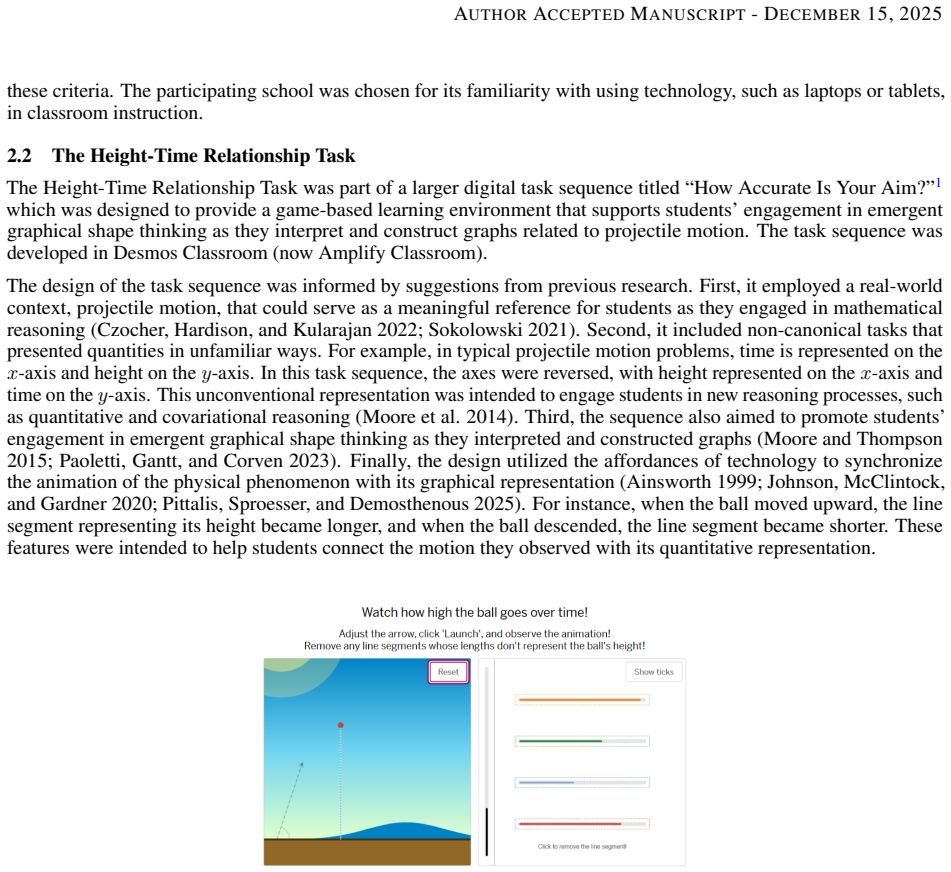
displayed a graph showing the height of the ball as a function of time and prompted students to interpret the shape of the graph. Students could analyze the graph in sections and were offered hints consisting of several equally spaced points on the y-axis, along with their corresponding points on the x-axis. These hints supported students in connecting gr...
work page 2025
-
[6]
Table 2: Excerpt of students’ discussion when interpreting the shape of the graph Speaker Transcript Fania Mmm, maybe it’s also affected by height. Because at the beginning, it starts from below [places right hand low], then it’s thrown [makes a gesture of throwing a ball upward]. Since it’s thrown, the height on the graph moves to the right. At a certain...
work page 1989
-
[7]
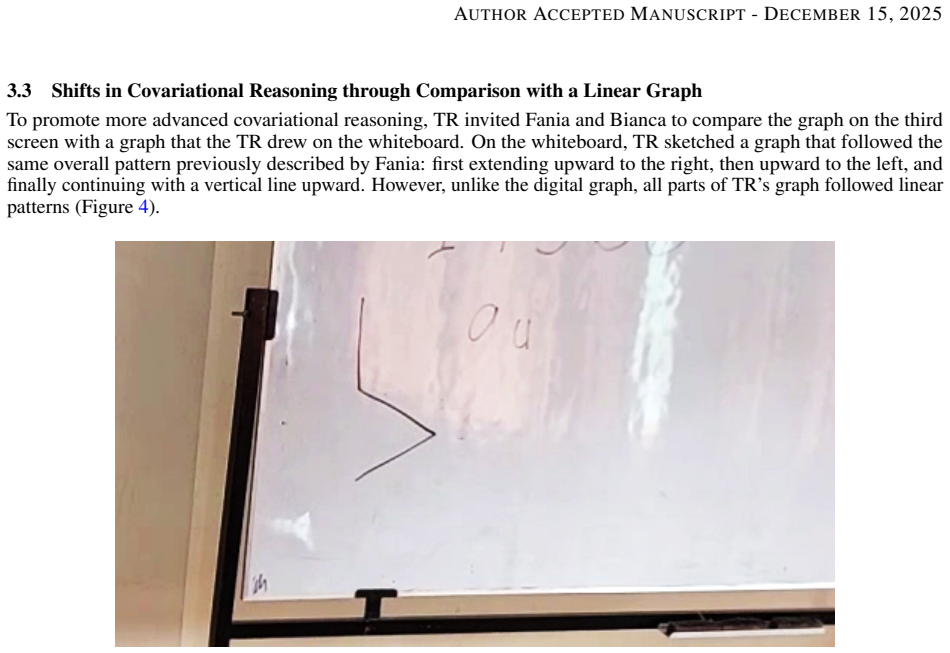
Table 3: Discussion comparing the curved and linear graphs Speaker Transcript Fania If it’s diagonal, if it’s straight like that [pointing to the TR’s graph on the whiteboard], that means the speed is constant. Bianca Yes. Fania Every second it– Bianca Every second it– Fania Same. Bianca Same. Based on Table 3, Fania and Bianca identified the key characte...
work page 2025
-
[8]
Baseball as a Quantitative Reasoning Course
“Baseball as a Quantitative Reasoning Course.”PRIMUS33 (1): 84–96. https://doi.org/10.108 0/10511970.2022.2032507. Ainsworth, Shaaron
-
[9]
The Functions of Multiple Representations
“The Functions of Multiple Representations.”Computers & Education33 (2-3): 131–52. https://doi.org/10.1016/S0360-1315(99)00029-9. Altindis, Nigar
-
[10]
“Networking Theories of Quantitative Reasoning and Mathematical Reasoning to Explore Students’ Understanding of Functions.”The Journal of Mathematical Behavior80 (December): 101276. https: //doi.org/10.1016/j.jmathb.2025.101276. Clement, John
-
[11]
A Bridging Study Analyzing Mathe- matical Model Construction Through a Quantities-Oriented Lens
“A Bridging Study Analyzing Mathe- matical Model Construction Through a Quantities-Oriented Lens.”Educational Studies in Mathematics111 (2): 299–321. https://doi.org/10.1007/s10649-022-10163-3. Hadjidemetriou, Constantia, and Julian Williams
-
[12]
Children’s Graphical Conceptions
“Children’s Graphical Conceptions.”Research in Mathematics Education4 (1): 69–87. https://doi.org/10.1080/14794800008520103. Harel, Guershon
-
[13]
“Intellectual Need.” In, edited by Keith R Leatham, 119–51. New York, NY: Springer New York. https://doi.org/10.1007/978-1-4614-6977-3_6. Hohensee, Charles, Sara Gartland, Matthew Melville, and Laura Willoughby
-
[14]
“Comparing Contrasting Instruc- tional Approaches: A Way for Research to Develop Insights about Backward Transfer.”Research in Mathematics Education, September, 1–21. https://doi.org/10.1080/14794802.2024.2388067. Johnson, Heather Lynn, Evan D. McClintock, and Amber Gardner
-
[15]
“Opportunities for Reasoning: Digital Task Design to Promote Students’ Conceptions of Graphs as Representing Relationships Between Quantities.”Digital Experiences in Mathematics Education6 (3): 340–66. https://doi.org/10.1007/s40751-020-00061-9. 9 AUTHORACCEPTEDMANUSCRIPT- DECEMBER15, 2025 Kendon, Adam
-
[16]
Language and Gesture: Unity or Duality?
“Language and Gesture: Unity or Duality?” In, edited by David McNeill, 1st ed., 47–63. Cambridge University Press. https://doi.org/10.1017/CBO9780511620850.004. Kong, Anthony Pak-Hin, Sam-Po Law, and Gigi Wan-Chi Chak
-
[17]
“A Comparison of Coverbal Gesture Use in Oral Discourse Among Speakers With Fluent and Nonfluent Aphasia.”Journal of Speech, Language, and Hearing Research60 (7): 2031–46. https://doi.org/10.1044/2017_JSLHR-L-16-0093. Kristanto, Yosep Dwi, and Zsolt Lavicza
-
[18]
Functions, Graphs, and Graphing: Tasks, Learning, and Teaching
“Functions, Graphs, and Graphing: Tasks, Learning, and Teaching.”Review of Educational Research60 (1): 1–64. https://doi.org/10.3102/00346543060001001. Martínez-Sierra, Gustavo, and Kleiver Jesús Villadiego Franco
-
[19]
Unleashing the potential of prompt engineering for large language models,
“Exploring Students’ Covariational Reasoning in Sine and Cosine Functions: A Comparison of Expected and Manifested Learning Trajectories with Dynamic Tasks.” The Journal of Mathematical Behavior80 (December): 101260. https://doi.org/10.1016/j.jmathb.2025.101260. Moore, Kevin C
-
[20]
Graphical Shape Thinking and Transfer
“Graphical Shape Thinking and Transfer.” In, edited by Charles Hohensee and Joanne Lobato, 145–71. Cham: Springer International Publishing. https://link.springer.com/10.1007/978-3-030-65632-4_7. Moore, Kevin C., Jason Silverman, Teo Paoletti, and Kevin LaForest
-
[21]
Breaking Conventions to Support Quantitative Reasoning
“Breaking Conventions to Support Quantitative Reasoning.”Mathematics Teacher Educator2 (2): 141–57. https://doi.org/10.5951/mathteaceduc.2.2.0
-
[22]
Conventions, Habits, and U.S. Teachers’ Meanings for Graphs
“Conventions, Habits, and U.S. Teachers’ Meanings for Graphs.”The Journal of Mathematical Behavior53 (March): 179–95. https: //doi.org/10.1016/j.jmathb.2018.08.002. Moore, Kevin C., and Patrick W. Thompson
-
[23]
Zooming in: The Role of Nonverbal Behavior in Sensing the Quality of Collaborative Group Engagement
“Zooming in: The Role of Nonverbal Behavior in Sensing the Quality of Collaborative Group Engagement.”International Journal of Computer-Supported Collaborative Learning19 (2): 187–229. https://doi.org/10.1007/s11412-024-09422-7. Paoletti, Teo, Allison L. Gantt, and Julien Corven
-
[24]
A Local Instruction Theory for Emergent Graphical Shape Thinking: A Middle School Case Study
“A Local Instruction Theory for Emergent Graphical Shape Thinking: A Middle School Case Study.”Journal for Research in Mathematics Education54 (3): 202–24. https://doi.org/10.5951/jresematheduc-2021-0066. Paoletti, Teo, Hamilton L. Hardison, and Hwa Young Lee
-
[25]
“Com- paring Graphical Representations in Mathematics, Science, and Engineering Textbooks and Practitioner Jour- nals.”International Journal of Mathematical Education in Science and Technology53 (7): 1815–34. https: //doi.org/10.1080/0020739X.2020.1847336. Paoletti, Teo, Kevin C. Moore, and Madhavi Vishnubhotla
-
[26]
Exploring and Promoting a Student’s Covariational Reasoning and Developing Graphing Meanings
“Exploring and Promoting a Student’s Covariational Reasoning and Developing Graphing Meanings.”The Journal of Mathematical Behavior74 (June): 101156. https://doi.org/10.1016/j.jmathb.2024.101156. Paoletti, Teo, and Madhavi Vishnubhotla
-
[27]
“Graphically Representing Covariational Functional Situations in an Interactive Embodied Digital Learning Environment.”International Journal of Mathematical Education in Science and Technology56 (6): 1083–113. https://doi.org/10.1080/0020739X.2024.2327552. Saldanha, Luis A., and Patrick W. Thompson
-
[28]
Mathematical Modelling and Covariational Reasoning: A Multiple Case Study
“Mathematical Modelling and Covariational Reasoning: A Multiple Case Study.”International Journal of Mathematical Education in Science and Technology 56 (10): 1964–93. https://doi.org/10.1080/0020739X.2024.2379485. 10 AUTHORACCEPTEDMANUSCRIPT- DECEMBER15, 2025 Sokolowski, Andrzej
-
[29]
Parametrization of Projectile Motion
“Parametrization of Projectile Motion.” In, 101–26. Cham: Springer International Publishing. https://doi.org/10.1007/978-3-030-80205-9_8. Steffe, Leslie P., and Patrick W. Thompson
-
[30]
Teaching Experiment Methodology: Underlying Principles and Essential Elements
“Teaching Experiment Methodology: Underlying Principles and Essential Elements.” In, edited by Anthony Edward Kelly and Richard A. Lesh, 267–307. Hillsday, NJ: Erlbaum. Stewart, James, L. Redlin, and Saleem Watson. 2016.Algebra and trigonometry. Fourth edition/Student edition. Boston, MA, USA: Cengage Learning. Tallman, Michael A., John Weaver, and Taylor Johnson
work page 2016
-
[31]
Developing (Pedagogical) Content Knowledge of Constant Rate of Change: The Case of Samantha
“Developing (Pedagogical) Content Knowledge of Constant Rate of Change: The Case of Samantha.”The Journal of Mathematical Behavior76 (December): 101179. https://doi.org/10.1016/j.jmathb.2024.101179. Thompson, Patrick W., and Marilyn Paula Carlson
-
[32]
“Investigating Secondary Students’ Generalization, Graphing, and Construction of Figural Patterns for Making Sense of Quadratic Functions.”The Journal of Mathematical Behavior54 (June): 100689. https://doi.org/10.1016/j.jmathb.2019.01.005. ———
-
[33]
“Investigating Students’ Attention to Covariation Features of Their Constructed Graphs in a Figural Pattern Generalisation Context.”International Journal of Science and Mathematics Education18 (2): 315–36. https://doi.org/10.1007/s10763-019-09955-6. Wilkie, Karina J., and Michal Ayalon
-
[34]
“Investigating Years 7 to 12 Students’ Knowledge of Linear Relationships Through Different Contexts and Representations.”Mathematics Education Research Journal30 (4): 499–523. https://doi.org/10.1007/s13394-018-0236-8. Yu, F
-
[35]
“A Quantitative and Covariational Reasoning Approach to Introducing Instantaneous Rate of Change: A Lesson Analysis Manuscript.”PRIMUS, July, 1–17. https://doi.org/10.1080/10511970.2025.2518528. Yu, Franklin
-
[36]
“Extending the Covariation Framework: Connecting Covariational Reasoning to Students’ Interpretation of Rate of Change.”The Journal of Mathematical Behavior73 (March): 101122. https://doi.org/10.1 016/j.jmathb.2023.101122. 11
discussion (0)
Sign in with ORCID, Apple, or X to comment. Anyone can read and Pith papers without signing in.