REVIEW 4 major objections 6 minor 1 cited by
A subtraction-based selection method finds 23 diffuse Lyman-alpha blobs missed by conventional searches and shows blob abundance rises sharply near protoclusters.
Reviewed by Pith at T0; open to challenge. T0 means a machine referee read the full paper against a public rubric. the ladder, T0–T4 →
T0 review · deepseek-v4-flash
2026-08-03 15:17 UTC pith:VMNED5U5
load-bearing objection The Tractor-based LAB selection method and the 112-object sample are the real contributions; the environment-dependent number-density claim is a suggestive hint, not an established result. the 4 major comments →
ODIN: A New Lyman Alpha Blob Selection Method, Sample, and Statistical Analysis at zsim3.1
The pith
A machine-rendered reading of the paper's core claim, the machinery that carries it, and where it could break.
Core claim
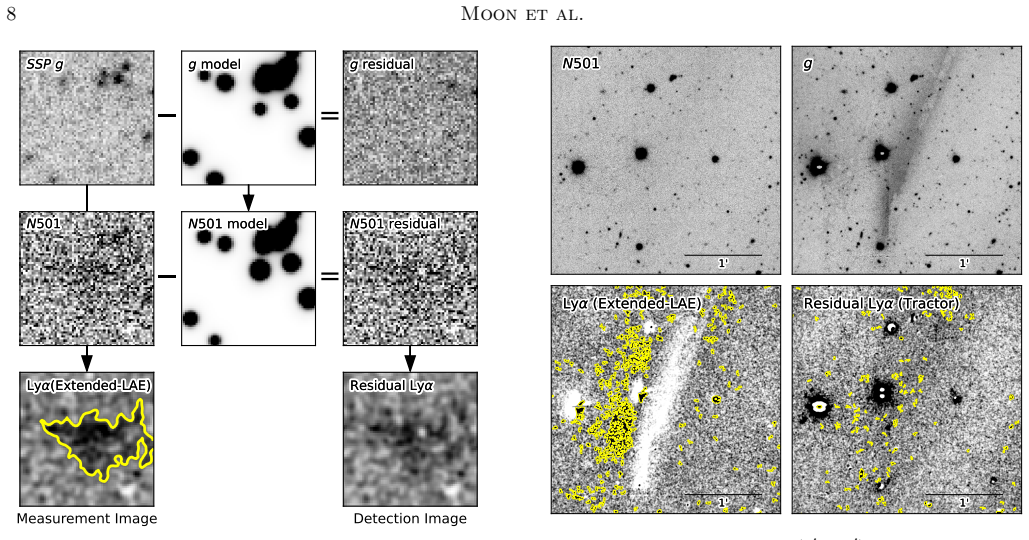
The central claim is that a new 'extended-beyond-continuum' selection method recovers a population of low-surface-brightness Lyman-alpha blobs that standard selection—which requires a compact Lyman-alpha emitter (LAE) to be embedded in the extended emission—systematically misses. The pipeline uses forced photometry: it fits six parametric galaxy models in the g-band image, transfers those exact shapes and positions to the N501 narrowband image, fits only each model's amplitude there, and subtracts the result. The residual image is searched for extended emission, and the 23 new sources found this way, combined with 89 from the conventional method, give 112 blobs. The paper also claims an envi
What carries the argument
The load-bearing mechanism is a forced-photometry subtraction pipeline: galaxies are detected in the g-band image, their shapes (point source, Gaussian, exponential, de Vaucouleurs, Sérsic, or composite) are fitted once, and those shapes are then frozen while only brightness amplitudes are fitted in the N501 narrowband image. Subtracting the reconstructed model leaves a residual map of pure extended emission, which is searched with a fixed surface-brightness threshold and a size–luminosity cut calibrated by injected simulated point sources. The pipeline's design choices—small overlapping sub-tiles, a size cap, and a low detection threshold to catch faint galaxies—keep the residual clean enou
Load-bearing premise
The central premise is that a galaxy's g-band model, with only its amplitude changed, fully describes its N501 narrowband appearance, so whatever remains after subtraction is genuine extended Lyα emission rather than a shape or PSF mismatch or an unmodeled faint galaxy; the environmental claim additionally assumes the protocluster excess is not an artifact of selecting blobs preferentially near LAE overdensities.
What would settle it
Run the same g-band-model subtraction on a narrowband image centered just off the Lyα line at z≈3.1, or on a synthetic image where the only difference between g and N501 is the PSF: if the extended residual sources still appear, they are continuum subtraction artifacts rather than Lyα blobs. Alternatively, inject a large grid of synthetic diffuse halos with known sizes and surface brightnesses into the N501 image and check whether the residual-detection pipeline recovers them with the claimed sizes and luminosities.
If this is right
- The combined sample of 112 blobs in 9 deg^2 is one of the largest uniform z≈3.1 LAB samples, so number densities and luminosity functions can be measured with field-to-field variation at least partially averaged out.
- The 23 new sources are the faintest-surface-brightness blobs; any census based only on LAE-embedded selection will undercount diffuse blobs by roughly 20%.
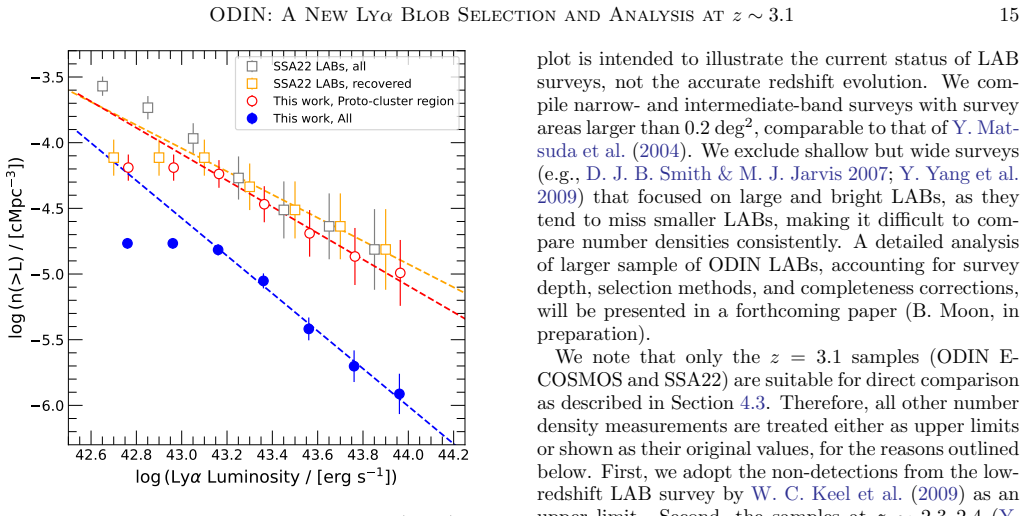
- Within protocluster regions, blob number density is about four times the field average and the cumulative luminosity function is flatter, implying that environment must be accounted for in interpreting blob statistics.
- If the environment dependence holds, blob abundance and luminosity can serve as tracers of overdense regions and protoclusters at z≈3.
- The same pipeline is being applied to the full ~100 deg^2 ODIN survey at three redshifts, which the paper expects to yield about 1,000 blobs and a direct test of the environmental trend.
Where Pith is reading between the lines
- Editorial inference: the subtraction residual is treated as astrophysical by construction; a natural extension is to inject synthetic diffuse halos with known surface brightness profiles into the N501 image and measure what fraction of residual flux is actually recovered versus created by PSF mismatch or undetected faint galaxies.
- Editorial inference: the environmental claim currently rests on about 29 blobs in three protocluster regions; applying the method across the full survey area will show whether the factor-of-four excess is a general property of overdense regions or specific to those complexes.
- Editorial inference: because the pipeline recovers 'dual-LAE' systems as single connected halos rather than two compact sources, some of the apparent size difference between selection methods may reflect deblending choices; comparing the same sources with deep integral-field spectroscopy could reveal how many blobs are truly single gaseous halos versus merger-driven complexes.
- Editorial inference: the amplitude-only scaling assumption means any wavelength-dependent galaxy morphology (for example, strong star-forming clumps that appear differently in g and N501) becomes residual flux; a decisive check would be running the pipeline on a narrowband filter with no line emission at the same wavelength and confirming that residual sources vanish.
Editorial analysis
A structured set of objections, weighed in public.
Referee Report
Summary. The paper presents the ODIN LAB selection in the 9 deg^2 E-COSMOS field at z~3.1. It uses two methods: a conventional 'extended-LAE' approach that cross-matches compact LAEs with extended Ly-alpha sources (89 LABs), and a new 'extended-beyond-continuum' pipeline that models g-band galaxies with Tractor, subtracts these models from the N501 narrowband image via forced photometry, and detects residual extended emission (23 additional LABs). The combined sample is 112 LABs, with 52 having spectroscopic redshifts consistent with z~3.1. The paper then reports a LAB number density that is four times higher in ODIN protocluster regions than the field average, a comparable density to the SSA22 protocluster, and a flatter cumulative luminosity function in protocluster regions, concluding that Ly-alpha luminosities and number densities of LABs are environment-dependent.
Significance. If the selection methods and statistical claims hold, this is a valuable contribution: it provides one of the largest homogeneous LAB samples to date, introduces a computationally scalable selection technique for diffuse emission in large-area narrowband surveys, and includes extensive recovery simulations plus a substantial spectroscopic confirmation campaign. The new Tractor-based pipeline is a genuine methodological contribution that could be used across the full ODIN survey and similar datasets. The environmental result, however, is the least secure part of the paper and, as written, the abstract and summary state it more strongly than the body's hedged language justifies. Strengths of the paper are the large sample size, the explicit recovery tests, the public catalog structure, and the effort to place the SSA22 comparison on a common detection-depth footing.
major comments (4)
- [§4.3; Abstract; §3.1] The environment-dependence claim is entangled with the selection path. Complexes A and C are defined as LAE overdensities from Ramakrishnan et al. (2023), and the extended-LAE method (Section 3.1) requires an LAE counterpart. LABs in LAE-overdense regions are therefore preferentially selected by construction. The proto-cluster number density is also computed within the same overdense cylinders used to identify the complexes, so the denominator is not an independent environmental volume. The body says 'suggest the possibility' but the abstract states the result as 'suggesting the Ly-alpha luminosities and number densities of LABs are environment-dependent.' Please (i) recompute the proto-cluster excess using only the extended-beyond-continuum LABs, which do not require LAE counterparts; (ii) bootstrap the density ratio using random apertures matched in area and depth; and (iii) adjust the
- [§3.2 step (4); §3.3] The central premise of the new pipeline—that Tractor models fitted in the g-band describe the N501 emission with only an amplitude scaling—is not directly validated. Section 3.2 fixes shapes and positions from g-band and fits only amplitudes in N501; any wavelength-dependent morphology, PSF mismatch, or faint undetected galaxy leaves a residual that is interpreted as extended Ly-alpha. The paper itself shows the subtraction is imperfect: 17 of 89 extended-LAE LABs are lost because forced photometry over-subtracts the bright Ly-alpha core and creates a hole (Section 3.3). Since the unique yield of 23 LABs is a headline result, add a null test: inject continuum-only galaxies with no Ly-alpha into the N501 image, run the pipeline, and report how often the residual passes the area, size-luminosity, and EW cuts. Also quantify the sensitivity to PSF mismatch between g and N501. The current rec
- [§3.1; §4.3] The surface-brightness detection threshold is tuned to the sample being measured: 'This SB threshold is selected based on tests using visually identified ODIN LABs' (Section 3.1). Because the number density and luminosity functions in Section 4.3 are measured with this threshold, the headline environmental contrast is partly a function of a subjectively calibrated cut. Please report the sensitivity of n and of the proto-cluster CLF slope to plausible threshold variations (e.g., 1.0–2.0 sigma_SB1), and clarify whether the visually identified LABs used for threshold tests are independent of the final 112-object sample. This is especially important because the 4x density excess is driven by sources near the faint/diffuse end where the threshold choice matters most.
- [§4.3; Fig. 12] The CLF comparison has internal sample-count inconsistencies. The text says 'identify 11 and 8 LABs in each complex, respectively' (19 total), but later refers to '29 LABs within three proto-clusters' without naming the third complex. The slope difference (-1.4+/-0.1 field vs -1.0+/-0.1 proto-cluster) is fitted to a small number of objects, and cumulative luminosity function bins are correlated, so the quoted uncertainties understate the true error. The SSA22 comparison also assumes that applying the ODIN recovery fraction to SSA22 surface-brightness profiles is unbiased; if this correction is uncertain, the agreement between n=7.5e-5 and n=7.7e-5 is not a strong test. Please specify the exact per-complex counts, fit the CLFs with a proper covariance treatment, and present the SSA22 recovery-corrected density with an estimate of the systematic uncertainty from profile assumptions.
minor comments (6)
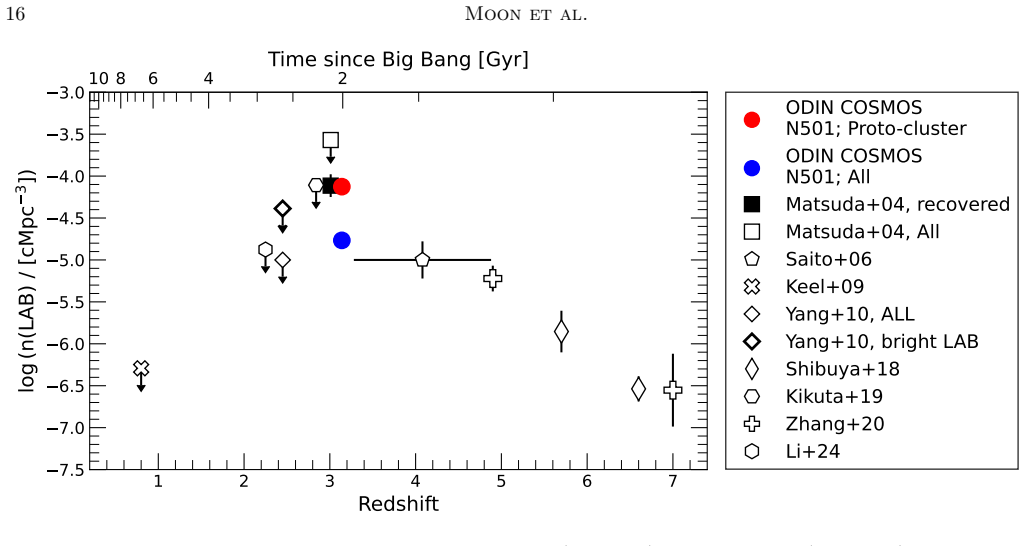
- [§4.3; Fig. 13] Units: 'cMpc3' appears in the text and should be cMpc^-3; Figure 13 symbols are shifted along x but the label says 'symbomls'; please proofread.
- [§3.2 step (1)] Typo: 'DETET THRESH' should be 'DETECT THRESH'.
- [Eq. (1)] Please define the units of F, f, and epsilon explicitly. The epsilon_g = 1.13 and epsilon_r = 0 values need a reference or a one-line derivation; the current text is hard to follow.
- [§3.4] The recovery test uses the same selection criteria and same images to define recovery; it measures internal consistency but not absolute completeness. The paper should state this limitation explicitly, particularly when using f_recv to correct the SSA22 sample.
- [Appendix B; Table B1] Only the first 20 catalog entries are printed. Provide a machine-readable version of the full 112-row catalog as a journal data file, and add a column noting which LABs were used in the proto-cluster CLF analysis.
- [Appendix A] Minor wording: 'using Ellipse in PythonPhotutils package' is a fragment; also 'L(Lyα)' notation is ambiguous and should be defined.
Circularity Check
Environmental density excess is partly built into the LAE-based selection and the LAE-based protocluster definition.
specific steps
-
self definitional
[Section 4.3, with Section 3.1]
"Within the sampling box that encompasses the most overdense regions (Complexes A and C; V. Ramakrishnan et al. 2023) with a local 2D surface overdensity of δΣ∼5.5 comparable to the SSA22 proto-cluster, we identify 11 and 8 LABs in each complex, respectively. This yields a significantly elevated number density of 6.5±1.5×10⁻⁵ cMpc−3 on average, a factor of ~4 higher than that of the entire E-COSMOS LAB sample."
The extended-LAE selection path defines LABs as extended Lyα emission around compact LAEs: Section 3.1 first 'identifying bright cores of LABs (i.e., LAEs)' and then detecting emission around them. The overdense 'sampling box' is itself an LAE overdensity from V. Ramakrishnan et al. (2023), a same-collaboration catalog. Thus the numerator of the 4× density excess is selected from positions defined by the same LAE population that defines the environmental volume and the selection path. In LAE-overdense regions, the extended-LAE selection function is automatically higher. The paper does not report the environment signal separately for the 23 LAE-independent Tractor-only LABs, so the claimed excess is at least partly a consequence of requiring LAE counterparts rather than an independent measu
full rationale
The paper's main methodological contribution—the extended-beyond-continuum Tractor pipeline—is not circular: it models g-band galaxies, subtracts them from N501, detects residual Lyα emission, and is validated by injection-recovery tests and 52 spectroscopic confirmations. The SB threshold is admittedly calibrated on visually identified LABs, but that is a detection tuning, not a prediction fitted to the reported statistics. The genuine partial circularity is in the environmental claim. The 89 extended-LAE LABs require a compact LAE counterpart, while the protocluster complexes are defined as LAE overdensities from the same collaboration's prior work; hence the number-density excess and flatter CLF in those boxes are partly inherited from the LAE-association requirement rather than from an independent definition of environment. This does not invalidate the LAB catalog, but it weakens the abstract's conclusion that LABs are environment-dependent, because the paper does not separate the LAE-independent subset when measuring the environmental signal. Self-citations to Ramakrishnan et al. are normal observational references and do not, by themselves, constitute circularity; the circular load is carried by the selection overlap.
Axiom & Free-Parameter Ledger
free parameters (6)
- Surface-brightness detection threshold =
3.3e-18 erg s^-1 cm^-2 arcsec^-2
- Minimum isophotal area for LAB classification =
20 arcsec^2
- Point-source size-luminosity rejection threshold =
3-sigma above simulated point-source sequence
- Rest-frame equivalent width cut =
EW_rest > 20 Angstrom
- Detection minimum area in extended-LAE pipeline =
42 pixels (~3 arcsec^2)
- Filter transmission correction factors =
epsilon_g = 1.13, epsilon_r = 0
axioms (4)
- domain assumption Continuum flux at N501 is a linear interpolation of g- and r-band fluxes
- domain assumption Galaxy shapes fitted in the g-band are identical in N501 (only amplitudes refit)
- domain assumption Residual N501 flux after galaxy subtraction is Ly-alpha at z~3.1, not interlopers or PSF mismatch
- domain assumption Flat Lambda-CDM cosmology with Omega_M=0.3, Omega_Lambda=0.7, H0=70 km/s/Mpc
read the original abstract
Ly$\alpha$ blobs (LABs) are large, spatially extended Ly$\alpha$-emitting objects whose nature remains unclear. Their statistical properties such as number densities and luminosity functions are still uncertain because of small sample sizes and large cosmic variance. The One-hundred-deg$^2$ DECam Imaging in Narrowbands (ODIN) survey, with its large volume, offers an opportunity to overcome these limitations. We describe our LAB selection method and present 112 new LABs in the 9 deg$^2$ E-COSMOS field. We begin with the conventional LAB selection approach, cross-matching LAEs with extended Ly$\alpha$ sources, yielding 89 LAB candidates. To obtain a more complete LAB sample, we introduce a new selection pipeline that models all galaxies detected in deep broadband imaging, subtracts them from the narrowband image, and then directly detects extended Ly$\alpha$ emission. This method successfully identifies 23 additional low-surface-brightness LABs which could otherwise be missed by the conventional method. The number density of ODIN LABs near an ODIN protocluster ($n=7.5\times10^{-5}$ cMpc$^{-3}$) is comparable to that found in the SSA22 proto-cluster and is four times higher than the average across the field. The cumulative Ly$\alpha$ luminosity function within the protocluster regions is similar to that measured for the LABs in the SSA22 proto-cluster, suggesting a large excess of luminous LABs relative to the average field. These findings suggest the Ly$\alpha$ luminosities and number densities of LABs are environment-dependent. ODIN will provide an expansive LAB and protocluster samples across six additional fields and two more redshifts, allowing us to investigate the nature of LABs in relation to their environments.
Figures




Forward citations
Cited by 1 Pith paper
-
ODIN: Clustering Properties of Ly$\alpha$ Blobs at $z$ $\sim$ 2.4 and 3.1
Lyα blobs at z≈2.4 and 3.1 cluster with bias b≈4, implying host dark matter halos of ~10^12 M⊙, though a cross-correlation check gives lower values.
Reference graph
Works this paper leans on
-
[1]
2019, PASJ, 71, 114, doi: 10.1093/pasj/psz103
Aihara, H., AlSayyad, Y., Ando, M., et al. 2019, PASJ, 71, 114, doi: 10.1093/pasj/psz103
-
[2]
2020, Nature Astronomy, 4, 670, doi: 10.1038/s41550-020-1033-3 Arrigoni Battaia, F., Prochaska, J
Ao, Y., Zheng, Z., Henkel, C., et al. 2020, Nature Astronomy, 4, 670, doi: 10.1038/s41550-020-1033-3 Arrigoni Battaia, F., Prochaska, J. X., Hennawi, J. F., et al. 2018, MNRAS, 473, 3907, doi: 10.1093/mnras/stx2465 Arrigoni Battaia, F., Chen, C.-C., Liu, H.-Y. B., et al. 2022, ApJ, 930, 72, doi: 10.3847/1538-4357/ac5a4d Astropy Collaboration, Robitaille, ...
-
[3]
2013, PSFEx: Point Spread Function Extractor,, Astrophysics Source Code Library, record ascl:1301.001 http://ascl.net/1301.001
Bertin, E. 2013, PSFEx: Point Spread Function Extractor,, Astrophysics Source Code Library, record ascl:1301.001 http://ascl.net/1301.001
2013
-
[4]
1996, A&AS, 117, 393, doi: 10.1051/aas:1996164
Bertin, E., & Arnouts, S. 1996, A&AS, 117, 393, doi: 10.1051/aas:1996164
-
[5]
Bradley, L., Sip˝ ocz, B., Robitaille, T., et al. 2025, astropy/photutils: 2.2.0, 2.2.0 Zenodo, doi: 10.5281/zenodo.14889440 B˘ adescu, T., Yang, Y., Bertoldi, F., et al. 2017, ApJ, 845, 172, doi: 10.3847/1538-4357/aa8220
-
[6]
2017, ApJ, 837, 71, doi: 10.3847/1538-4357/aa5d14
Cai, Z., Fan, X., Yang, Y., et al. 2017, ApJ, 837, 71, doi: 10.3847/1538-4357/aa5d14
-
[7]
Hennawi, J. F., & Madau, P. 2014, Nature, 506, 63, doi: 10.1038/nature12898
-
[8]
2023, ApJ, 945, 100, doi: 10.3847/1538-4357/acac98
Chang, S.-J., Yang, Y., Seon, K.-I., Zabludoff, A., & Lee, H.-W. 2023, ApJ, 945, 100, doi: 10.3847/1538-4357/acac98
-
[9]
Cool, R. J., Moustakas, J., Blanton, M. R., et al. 2013, ApJ, 767, 118, doi: 10.1088/0004-637X/767/2/118
-
[10]
Daddi, E., Valentino, F., Rich, R. M., et al. 2021, A&A, 649, A78, doi: 10.1051/0004-6361/202038700
-
[11]
Daddi, E., Rich, R. M., Valentino, F., et al. 2022, ApJL, 926, L21, doi: 10.3847/2041-8213/ac531f de Vaucouleurs, G. 1948, Annales d’Astrophysique, 11, 247 DESI Collaboration, Abdul-Karim, M., Adame, A. G., et al. 2025, arXiv e-prints, arXiv:2503.14745, doi: 10.48550/arXiv.2503.14745
-
[12]
Dey, A., Bian, C., Soifer, B. T., et al. 2005, ApJ, 629, 654, doi: 10.1086/430775
doi:10.1086/430775 2005
-
[13]
Dey, A., Schlegel, D. J., Lang, D., et al. 2019, AJ, 157, 168, doi: 10.3847/1538-3881/ab089d
-
[14]
K., Bogosavljevi´ c, M., & Steidel, C
Erb, D. K., Bogosavljevi´ c, M., & Steidel, C. C. 2011, ApJL, 740, L31, doi: 10.1088/2041-8205/740/1/L31
-
[15]
M., Gawiser, E., Ramakrishnan, V., et al
Firestone, N. M., Gawiser, E., Ramakrishnan, V., et al. 2024, ApJ, 974, 217, doi: 10.3847/1538-4357/ad71c9
-
[16]
Flaugher, B., Diehl, H. T., Honscheid, K., et al. 2015, AJ, 150, 150, doi: 10.1088/0004-6256/150/5/150
-
[17]
Francis, P. J., Williger, G. M., Collins, N. R., et al. 2001, ApJ, 554, 1001, doi: 10.1086/321417 18Moon et al
-
[18]
Geach, J. E., Alexander, D. M., Lehmer, B. D., et al. 2009, ApJ, 700, 1, doi: 10.1088/0004-637X/700/1/1
-
[19]
E., Narayanan, D., Matsuda, Y., et al
Geach, J. E., Narayanan, D., Matsuda, Y., et al. 2016, ApJ, 832, 37, doi: 10.3847/0004-637X/832/1/37
-
[20]
2017, A&A, 608, A139, doi: 10.1051/0004-6361/201731791
Gronke, M. 2017, A&A, 608, A139, doi: 10.1051/0004-6361/201731791
-
[21]
2018, ApJ, 858, 77, doi: 10.3847/1538-4357/aabacf
Hasinger, G., Capak, P., Salvato, M., et al. 2018, ApJ, 858, 77, doi: 10.3847/1538-4357/aabacf
-
[22]
2011, Nature, 476, 304, doi: 10.1038/nature10320
Hayes, M., Scarlata, C., & Siana, B. 2011, Nature, 476, 304, doi: 10.1038/nature10320
-
[23]
2015, Science, 348, 779, doi: 10.1126/science.aaa5397
Arrigoni-Battaia, F. 2015, Science, 348, 779, doi: 10.1126/science.aaa5397
-
[24]
2025, ApJL, 988, L57, doi: 10.3847/2041-8213/adec82
Herrera, D., Gawiser, E., Benda, B., et al. 2025, ApJL, 988, L57, doi: 10.3847/2041-8213/adec82
-
[25]
Hill, G. J., Lee, H., MacQueen, P. J., et al. 2021, AJ, 162, 298, doi: 10.3847/1538-3881/ac2c02
-
[26]
Hogg, D. W. 2008, arXiv e-prints, arXiv:0807.4820, doi: 10.48550/arXiv.0807.4820
work page internal anchor Pith review Pith/arXiv arXiv doi:10.48550/arxiv.0807.4820 2008
-
[27]
2019, MNRAS, 483, 3950, doi: 10.1093/mnras/sty3219
Hong, S., Dey, A., Lee, K.-S., et al. 2019, MNRAS, 483, 3950, doi: 10.1093/mnras/sty3219
-
[28]
M., Jørgensen, I., Allington-Smith, J
Hook, I. M., Jørgensen, I., Allington-Smith, J. R., et al. 2004, PASP, 116, 425, doi: 10.1086/383624
doi:10.1086/383624 2004
-
[29]
2018, PASJ, 70, L6, doi: 10.1093/pasj/psy087
Kato, Y., Matsuda, Y., Iono, D., et al. 2018, PASJ, 70, L6, doi: 10.1093/pasj/psy087
-
[30]
1999, AJ, 118, 2547, doi: 10.1086/301139
Waddington, I. 1999, AJ, 118, 2547, doi: 10.1086/301139
doi:10.1086/301139 1999
-
[31]
Windhorst, R. A. 2009, AJ, 138, 986, doi: 10.1088/0004-6256/138/3/986
-
[32]
2019, PASJ, 71, L2, doi: 10.1093/pasj/psz055
Kikuta, S., Matsuda, Y., Cen, R., et al. 2019, PASJ, 71, L2, doi: 10.1093/pasj/psz055
-
[33]
2020, ApJ, 894, 33, doi: 10.3847/1538-4357/ab837f
Kim, E., Yang, Y., Zabludoff, A., et al. 2020, ApJ, 894, 33, doi: 10.3847/1538-4357/ab837f
-
[34]
Kriek, M., van Dokkum, P. G., Franx, M., et al. 2007, ApJ, 669, 776, doi: 10.1086/520789
doi:10.1086/520789 2007
-
[35]
2022, A&A, 660, A44, doi: 10.1051/0004-6361/202142302
Kusakabe, H., Verhamme, A., Blaizot, J., et al. 2022, A&A, 660, A44, doi: 10.1051/0004-6361/202142302
-
[36]
Lang, D., Hogg, D. W., & Schlegel, D. J. 2016b, AJ, 151, 36, doi: 10.3847/0004-6256/151/2/36
-
[37]
Langen, V., Cantalupo, S., Steidel, C. C., et al. 2023, MNRAS, 519, 5099, doi: 10.1093/mnras/stac3205
-
[38]
2017, A&A, 608, A8, doi: 10.1051/0004-6361/201731480
Leclercq, F., Bacon, R., Wisotzki, L., et al. 2017, A&A, 608, A8, doi: 10.1051/0004-6361/201731480
-
[39]
2024, ApJ, 962, 36, doi: 10.3847/1538-4357/ad165e
Lee, K.-S., Gawiser, E., Park, C., et al. 2024, ApJ, 962, 36, doi: 10.3847/1538-4357/ad165e
-
[40]
2024, ApJS, 275, 27, doi: 10.3847/1538-4365/ad812c
Li, M., Zhang, H., Cai, Z., et al. 2024, ApJS, 275, 27, doi: 10.3847/1538-4365/ad812c
-
[41]
J., Le Brun, V., Maier, C., et al
Lilly, S. J., Le Brun, V., Maier, C., et al. 2009, ApJS, 184, 218, doi: 10.1088/0067-0049/184/2/218
-
[42]
2019, MNRAS, 485, L62, doi: 10.1093/mnrasl/slz032
Lusso, E., Fumagalli, M., Fossati, M., et al. 2019, MNRAS, 485, L62, doi: 10.1093/mnrasl/slz032
-
[43]
2014, ARA&A, 52, 415, doi: 10.1146/annurev-astro-081811-125615
Madau, P., & Dickinson, M. 2014, ARA&A, 52, 415, doi: 10.1146/annurev-astro-081811-125615
-
[44]
2004, AJ, 128, 569, doi: 10.1086/422020
Matsuda, Y., Yamada, T., Hayashino, T., et al. 2004, AJ, 128, 569, doi: 10.1086/422020
doi:10.1086/422020 2004
-
[45]
2011, MNRAS, 410, L13, doi: 10.1111/j.1745-3933.2010.00969.x
Matsuda, Y., Yamada, T., Hayashino, T., et al. 2011, MNRAS, 410, L13, doi: 10.1111/j.1745-3933.2010.00969.x
arXiv 2011
-
[46]
Momcheva, I. G., Brammer, G. B., van Dokkum, P. G., et al. 2016, ApJS, 225, 27, doi: 10.3847/0067-0049/225/2/27
-
[47]
2016, MNRAS, 457, 2318, doi: 10.1093/mnras/stw021
Momose, R., Ouchi, M., Nakajima, K., et al. 2016, MNRAS, 457, 2318, doi: 10.1093/mnras/stw021
-
[48]
2025, arXiv e-prints, arXiv:2506.14510, doi: 10.48550/arXiv.2506.14510
Nagaraj, G., Ciardullo, R., Gronwall, C., et al. 2025, arXiv e-prints, arXiv:2506.14510, doi: 10.48550/arXiv.2506.14510
-
[49]
2020, ARA&A, 58, 617, doi: 10.1146/annurev-astro-032620-021859
Ouchi, M., Ono, Y., & Shibuya, T. 2020, ARA&A, 58, 617, doi: 10.1146/annurev-astro-032620-021859
-
[50]
2009, ApJ, 696, 1164, doi: 10.1088/0004-637X/696/2/1164
Ouchi, M., Ono, Y., Egami, E., et al. 2009, ApJ, 696, 1164, doi: 10.1088/0004-637X/696/2/1164
-
[51]
Woodgate, B. E. 2004, ApJ, 602, 545, doi: 10.1086/381145 Pˆ aris, I., Petitjean, P., Aubourg,´E., et al. 2014, A&A, 563, A54, doi: 10.1051/0004-6361/201322691
-
[52]
Prescott, M. K. M., Dey, A., & Jannuzi, B. T. 2012a, ApJ, 748, 125, doi: 10.1088/0004-637X/748/2/125
-
[53]
Prescott, M. K. M., Kashikawa, N., Dey, A., & Matsuda, Y. 2008, ApJL, 678, L77, doi: 10.1086/588606
doi:10.1086/588606 2008
-
[54]
Prescott, M. K. M., Dey, A., Brodwin, M., et al. 2012b, ApJ, 752, 86, doi: 10.1088/0004-637X/752/2/86
-
[55]
Ramakrishnan, V., Moon, B., Im, S. H., et al. 2023, ApJ, 951, 119, doi: 10.3847/1538-4357/acd341
-
[56]
Ramakrishnan, V., Lee, K.-S., Artale, M. C., et al. 2024, ApJ, 977, 119, doi: 10.3847/1538-4357/ad83cb
-
[57]
2025a, arXiv e-prints, arXiv:2511.11826, doi: 10.48550/arXiv.2511.11826
Ramakrishnan, V., Ortiz, A., Moon, B., et al. 2025a, arXiv e-prints, arXiv:2511.11826, doi: 10.48550/arXiv.2511.11826
-
[58]
2025b, ApJ, 982, 74, doi: 10.3847/1538-4357/adb624
Ramakrishnan, V., Lee, K.-S., Firestone, N., et al. 2025b, ApJ, 982, 74, doi: 10.3847/1538-4357/adb624
-
[59]
2012, MNRAS, 423, 344, doi: 10.1111/j.1365-2966.2012.20883.x
Rosdahl, J., & Blaizot, J. 2012, MNRAS, 423, 344, doi: 10.1111/j.1365-2966.2012.20883.x
arXiv 2012
-
[60]
2006, ApJ, 648, 54, doi: 10.1086/505678 S´ ersic, J
Saito, T., Shimasaku, K., Okamura, S., et al. 2006, ApJ, 648, 54, doi: 10.1086/505678 S´ ersic, J. L. 1963, Boletin de la Asociacion Argentina de Astronomia La Plata Argentina, 6, 41 ODIN: A New LyαBlob Selection and Analysis atz∼3.1 19
-
[61]
2018, PASJ, 70, S14, doi: 10.1093/pasj/psx122
Shibuya, T., Ouchi, M., Konno, A., et al. 2018, PASJ, 70, S14, doi: 10.1093/pasj/psx122
-
[62]
D., Kashino, D., Sanders, D., et al
Silverman, J. D., Kashino, D., Sanders, D., et al. 2015, ApJS, 220, 12, doi: 10.1088/0067-0049/220/1/12
-
[63]
Smith, D. J. B., & Jarvis, M. J. 2007, MNRAS, 378, L49, doi: 10.1111/j.1745-3933.2007.00318.x
arXiv 2007
-
[64]
Steidel, C. C., Adelberger, K. L., Shapley, A. E., et al. 2000, ApJ, 532, 170, doi: 10.1086/308568
doi:10.1086/308568 2000
-
[65]
2025, Nature Astronomy, 9, 577, doi: 10.1038/s41550-024-02463-w
Tornotti, D., Fumagalli, M., Fossati, M., et al. 2025, Nature Astronomy, 9, 577, doi: 10.1038/s41550-024-02463-w
-
[66]
2025, ApJS, 277, 37, doi: 10.3847/1538-4365/adb1c0
Umeda, H., Ouchi, M., Kikuta, S., et al. 2025, ApJS, 277, 37, doi: 10.3847/1538-4365/adb1c0
-
[67]
2019, Science, 366, 97, doi: 10.1126/science.aaw5949
Umehata, H., Fumagalli, M., Smail, I., et al. 2019, Science, 366, 97, doi: 10.1126/science.aaw5949
-
[68]
Vito, F., Brandt, W. N., Yang, G., et al. 2018, MNRAS, 473, 2378, doi: 10.1093/mnras/stx2486
-
[69]
2012, ApJ, 751, 29, doi: 10.1088/0004-637X/751/1/29
Yamada, T., Matsuda, Y., Kousai, K., et al. 2012, ApJ, 751, 29, doi: 10.1088/0004-637X/751/1/29
-
[70]
2010, ApJ, 719, 1654, doi: 10.1088/0004-637X/719/2/1654
Yang, Y., Zabludoff, A., Eisenstein, D., & Dav´ e, R. 2010, ApJ, 719, 1654, doi: 10.1088/0004-637X/719/2/1654
-
[71]
2014, ApJ, 793, 114, doi: 10.1088/0004-637X/793/2/114
Yang, Y., Zabludoff, A., Jahnke, K., & Dav´ e, R. 2014, ApJ, 793, 114, doi: 10.1088/0004-637X/793/2/114
-
[72]
2011, ApJ, 735, 87, doi: 10.1088/0004-637X/735/2/87
Yang, Y., Zabludoff, A., Jahnke, K., et al. 2011, ApJ, 735, 87, doi: 10.1088/0004-637X/735/2/87
-
[73]
2009, ApJ, 693, 1579, doi: 10.1088/0004-637X/693/2/1579
Yang, Y., Zabludoff, A., Tremonti, C., Eisenstein, D., & Dav´ e, R. 2009, ApJ, 693, 1579, doi: 10.1088/0004-637X/693/2/1579
-
[74]
2017, ApJ, 834, 182, doi: 10.3847/1538-4357/834/2/182
You, C., Zabludoff, A., Smith, P., et al. 2017, ApJ, 834, 182, doi: 10.3847/1538-4357/834/2/182
-
[75]
2020, ApJ, 891, 177, doi: 10.3847/1538-4357/ab7917
Zhang, H., Ouchi, M., Itoh, R., et al. 2020, ApJ, 891, 177, doi: 10.3847/1538-4357/ab7917
-
[76]
2025, ApJ, 981, 70, doi: 10.3847/1538-4357/adb41b 20Moon et al
Zhang, H., Cai, Z., Li, M., et al. 2025, ApJ, 981, 70, doi: 10.3847/1538-4357/adb41b 20Moon et al. APPENDIX A.SURF ACE BRIGHTNESS PROFILE OF LABS AND LAES 1042 1043 1044 Ly Luminosity [erg s 1] 101 102 Isophotal Area, AISO [arcsec2] Point sources ODIN LAEs LABs 1.5 SB1 2 SB1 1 Distance [arcsec] 10 4 10 3 10 2 10 1 100 Normalized SB Point like LABs LAEs Me...
discussion (0)
Sign in with ORCID, Apple, or X to comment. Anyone can read and Pith papers without signing in.