Demonstrating chart-plot: Closing the Last Mile of Academic Chart Generation
Pith reviewed 2026-06-27 15:22 UTC · model grok-4.3
The pith
chart-plot turns researcher intent into LaTeX-ready academic charts that match venue style and survive layout constraints.
A machine-rendered reading of the paper's core claim, the machinery that carries it, and where it could break.
Core claim
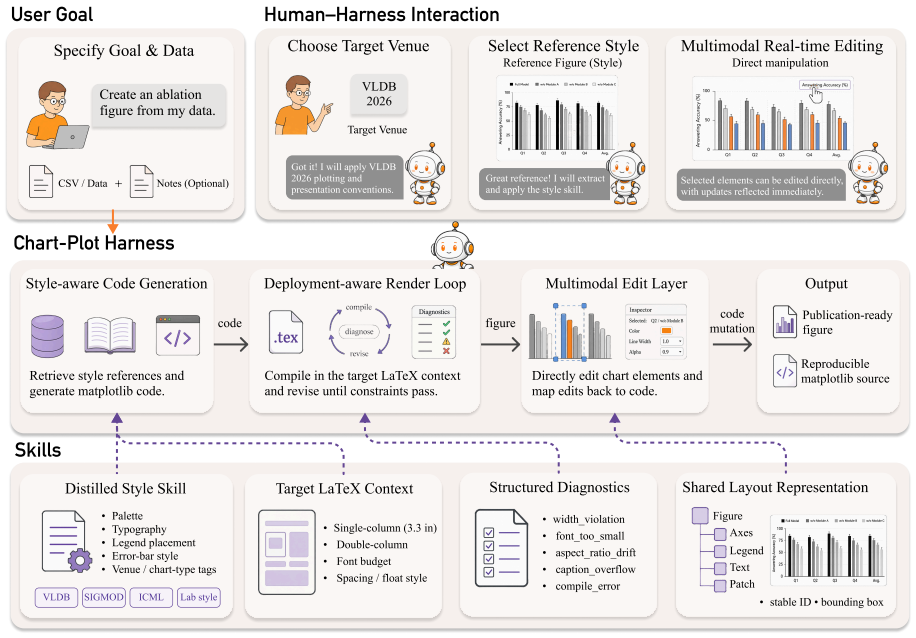
The paper presents chart-plot as an agentic harness that closes the last mile of academic chart generation. It consists of a style-aware code generator conditioned on a textual style skill distilled from accepted figures at the target venue, a deployment-aware render loop that compiles the chart inside the target LaTeX context and revises until layout constraints are met, and a structured edit layer that exposes every chart element as a directly manipulable handle. Early results are reported on three chart-type case studies and a small user study.
What carries the argument
chart-plot, an agentic harness with a style-aware code generator, a deployment-aware LaTeX render loop, and a structured edit layer for direct element manipulation
If this is right
- Generated charts match the visual style of previously accepted figures at the target venue.
- The render loop produces charts that survive the target LaTeX layout without manual fixes.
- Authors gain direct handles to edit individual chart elements rather than rewriting code.
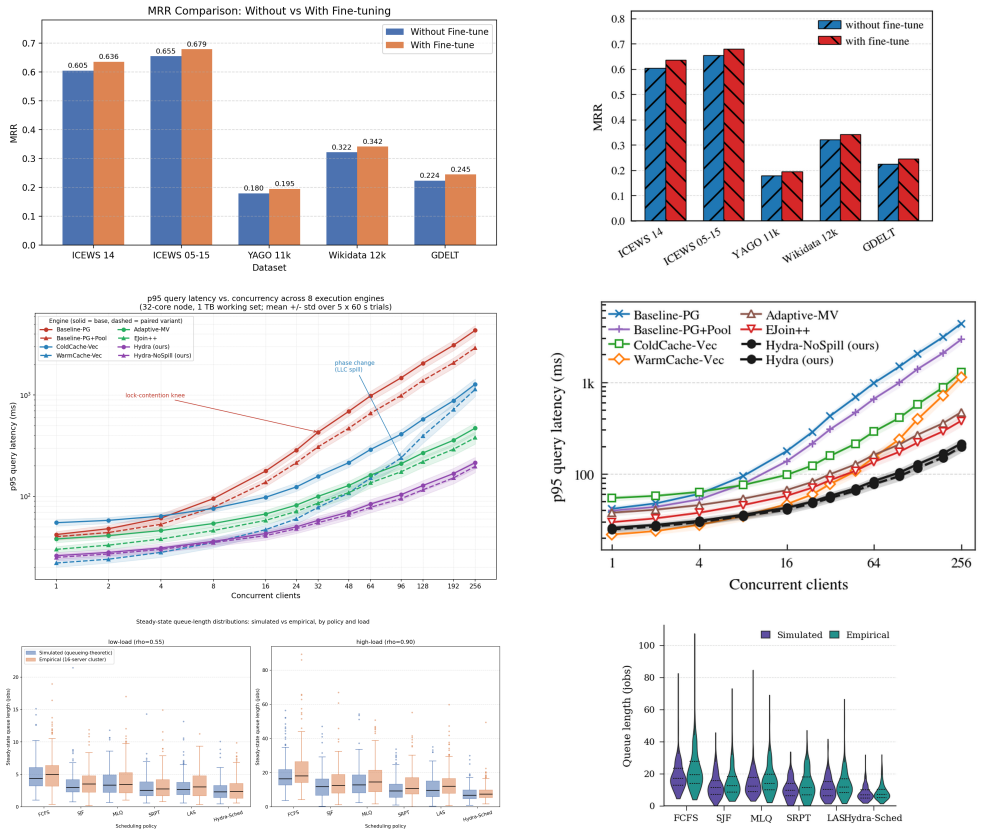
- The system works on grouped bar charts, scaling line charts, and paired distribution charts.
Where Pith is reading between the lines
- The same three-component structure could be applied to other output formats such as HTML or Word documents.
- Combining the edit layer with existing paper-writing agents might allow end-to-end figure refinement inside a single workflow.
- The reliance on venue-specific style distillation raises the question of how quickly the system adapts when a venue changes its figure guidelines.
Load-bearing premise
Distilling a textual style skill from accepted venue figures and pairing it with iterative LaTeX rendering and structured edits will reliably produce figures that match top-venue output and meet layout constraints without further manual work.
What would settle it
A test set of new chart requests where the generated figures still require more than one round of manual revision to pass venue style and layout checks.
Figures
read the original abstract
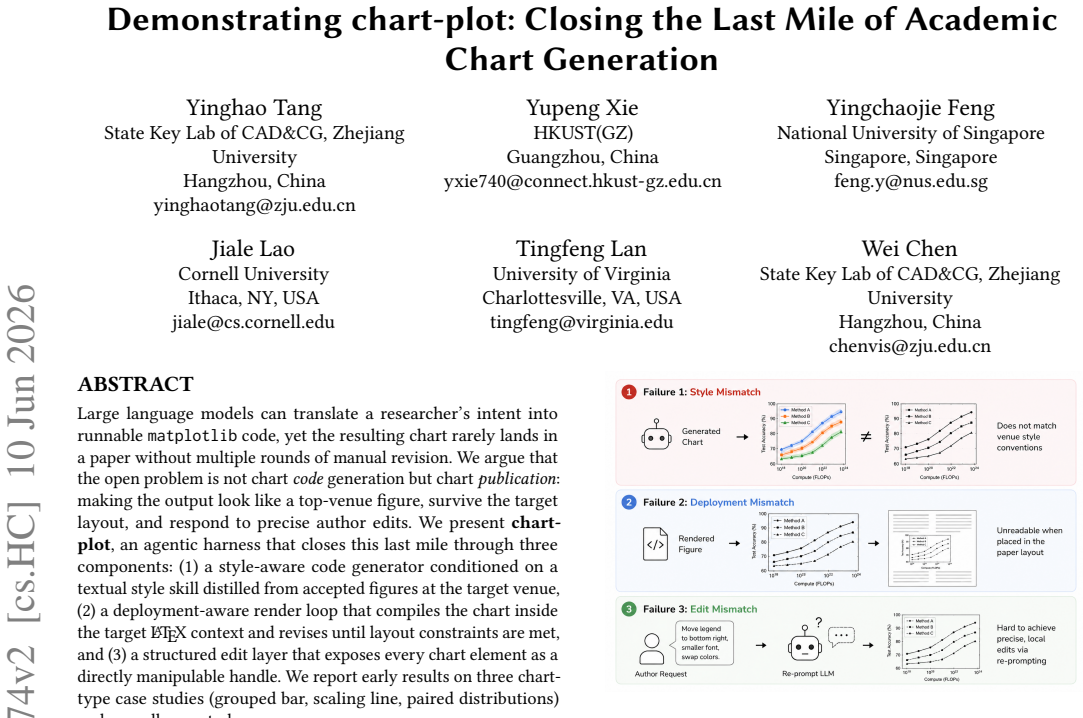
Large language models can translate a researcher's intent into runnable matplotlib code, yet the resulting chart rarely lands in a paper without multiple rounds of manual revision. We argue that the open problem is not chart code generation but chart publication: making the output look like a top-venue figure, survive the target layout, and respond to precise author edits. We present chart-plot, an agentic harness that closes this last mile through three components: (1) a style-aware code generator conditioned on a textual style skill distilled from accepted figures at the target venue, (2) a deployment-aware render loop that compiles the chart inside the target LaTeX context and revises until layout constraints are met, and (3) a structured edit layer that exposes every chart element as a directly manipulable handle. We report early results on three chart-type case studies (grouped bar, scaling line, paired distributions) and a small user study.
Editorial analysis
A structured set of objections, weighed in public.
Referee Report
Summary. The manuscript presents chart-plot, an agentic harness for generating publication-ready academic charts. It argues that the remaining challenge after LLM-based matplotlib code generation is achieving top-venue appearance, surviving target LaTeX layout constraints, and supporting precise edits. The system comprises three components: (1) a style-aware code generator conditioned on a textual style skill distilled from accepted figures at the target venue, (2) a deployment-aware render loop that compiles the chart inside the target LaTeX context and iterates until layout constraints are satisfied, and (3) a structured edit layer exposing every chart element as a manipulable handle. Early results are reported on three chart-type case studies (grouped bar, scaling line, paired distributions) plus a small user study.
Significance. If the components reliably produce figures meeting publication criteria without repeated manual intervention, the work would address a common practical bottleneck in academic workflows, particularly in HCI and related fields where figure quality affects acceptance. The combination of venue-specific style distillation with iterative LaTeX rendering and structured editing offers a concrete integration not previously demonstrated at this granularity.
major comments (2)
- Abstract: The central claim that the three components together 'close the last mile' by producing top-venue figures that survive layout constraints without multiple rounds of manual revision rests on unverified assertions. The abstract reports only 'early results' on three case studies and a small user study, with no quantitative metrics (e.g., revision counts, success rates, inter-venue generalization, or statistical tests) or baselines provided. This leaves the weakest assumption—that the system will reliably meet publication criteria—untested at the scale needed to substantiate the claim.
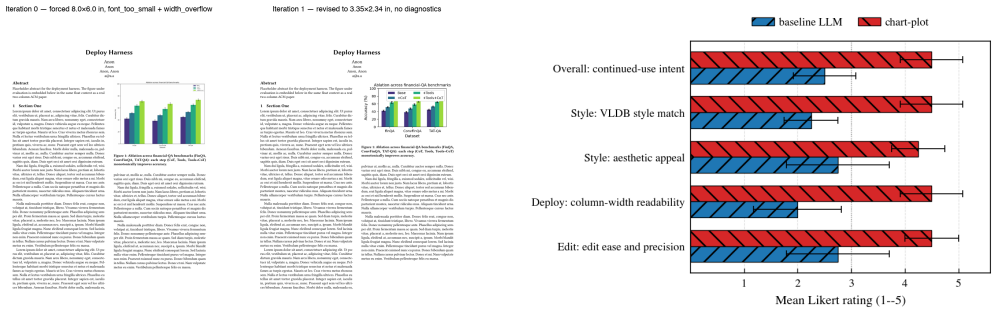
- Evaluation section (implied by the reported results): The manuscript provides no details on the user study's scale, methodology, tasks, or outcome measures. Without participant numbers, quantitative scores, or comparison conditions, it is impossible to determine whether the structured edit layer or other components deliver measurable improvements over existing manual or LLM-only workflows.
Simulated Author's Rebuttal
We thank the referee for the constructive comments on the evaluation and claims. We address each major point below, clarifying the scope of our demonstration paper while agreeing to strengthen the reported evidence where possible.
read point-by-point responses
-
Referee: Abstract: The central claim that the three components together 'close the last mile' by producing top-venue figures that survive layout constraints without multiple rounds of manual revision rests on unverified assertions. The abstract reports only 'early results' on three case studies and a small user study, with no quantitative metrics (e.g., revision counts, success rates, inter-venue generalization, or statistical tests) or baselines provided. This leaves the weakest assumption—that the system will reliably meet publication criteria—untested at the scale needed to substantiate the claim.
Authors: The manuscript is explicitly framed as a demonstration of the integrated approach rather than a large-scale empirical study; the phrase 'early results' signals this scope. The case studies show the components functioning on representative academic chart types (grouped bar, scaling line, paired distributions), and the render loop is designed to iterate until LaTeX constraints are met. We agree, however, that the abstract's phrasing could overstate reliability. In revision we will add concrete metrics drawn from the case studies, such as the number of render-loop iterations required per figure and the fraction of outputs that satisfied venue layout rules without further manual changes. revision: yes
-
Referee: Evaluation section (implied by the reported results): The manuscript provides no details on the user study's scale, methodology, tasks, or outcome measures. Without participant numbers, quantitative scores, or comparison conditions, it is impossible to determine whether the structured edit layer or other components deliver measurable improvements over existing manual or LLM-only workflows.
Authors: We acknowledge that the current description of the user study is too terse. The full manuscript contains a dedicated evaluation subsection, but it does not yet report participant count, exact tasks, or quantitative outcome measures with sufficient clarity. We will revise this section to specify the study scale, the editing tasks performed by participants, the metrics collected (e.g., time to achieve desired edits, number of handle operations required), and any direct comparisons to baseline workflows. This will allow readers to assess the practical benefit of the structured edit layer. revision: yes
Circularity Check
No circularity; system description with case-study support
full rationale
The paper presents chart-plot as an agentic system with three explicitly described components (style-aware generator, deployment-aware render loop, structured edit layer) and supports the claim via early results on three chart types plus a user study. No equations, parameters, predictions, or derivations appear. No self-citations, fitted inputs, or ansatzes are invoked. The central claim is a system proposal whose validity rests on the reported demonstrations rather than any reduction to its own inputs by construction.
Axiom & Free-Parameter Ledger
Forward citations
Cited by 1 Pith paper
-
DataMagic: Transforming Tabular Data into Data Insight Video
DataMagic generates narrative data videos from tabular data and queries via DVSpec declarative bindings and a Generate-then-Orchestrate multi-agent pipeline.
Reference graph
Works this paper leans on
-
[1]
Anthropic. 2025. Claude Skills: Reusable Capability Bundles for AI Agents. https://www.anthropic.com/news/skills. Online. 6
2025
-
[2]
Yiyu Chen, Yifan Wu, Shuyu Shen, Yupeng Xie, Leixian Shen, Hui Xiong, and Yuyu Luo. 2025. ChartMark: A Structured Grammar for Chart Annotation.arXiv preprint arXiv:2507.21810(2025)
arXiv 2025
-
[3]
Victor Dibia. 2023. LIDA: A Tool for Automatic Generation of Grammar-Agnostic Visualizations and Infographics using Large Language Models.arXiv preprint arXiv:2303.02927(2023)
arXiv 2023
-
[4]
Richard Gerum. 2019. Pylustrator: code generation for reproducible figures for publication.arXiv preprint arXiv:1910.00279(2019)
arXiv 2019
-
[5]
Shangding Gu. 2026. From Model Scaling to System Scaling: Scaling the Harness in Agentic AI.arXiv preprint arXiv:2605.26112(2026)
Pith/arXiv arXiv 2026
-
[6]
Yucheng Han, Chi Zhang, Xin Chen, Xu Yang, Zhibin Wang, Gang Yu, Bin Fu, and Hanwang Zhang. 2023. ChartLlama: A Multimodal LLM for Chart Understanding and Generation.arXiv preprint arXiv:2311.16483(2023)
arXiv 2023
-
[7]
Sirui Hong et al. 2024. MetaGPT: Meta Programming for A Multi-Agent Collabo- rative Framework. InInternational Conference on Learning Representations
2024
-
[8]
Qi Jiang, Guodao Sun, Tong Li, Jingwei Tang, Wang Xia, Yunchao Wang, Li Jiang, and Ronghua Liang. 2025. AutoMA: Automated Generation of Multi- level Annotations for Time Series Visualization. InIEEE Pacific Visualization Symposium (PacificVis). 80–90. https://doi.org/10.1109/PACIFICVIS64226.2025. 00014
-
[9]
Jimenez, John Yang, Alexander Wettig, Shunyu Yao, Kexin Pei, Ofir Press, and Karthik Narasimhan
Carlos E. Jimenez, John Yang, Alexander Wettig, Shunyu Yao, Kexin Pei, Ofir Press, and Karthik Narasimhan. 2024. SWE-bench: Can Language Models Resolve Real-World GitHub Issues?. InInternational Conference on Learning Representa- tions
2024
-
[10]
Boyan Li, Yiran Peng, Yupeng Xie, Sirong Lu, Yizhang Zhu, Xing Mu, Xinyu Liu, and Yuyu Luo. 2026. Deepeye: A steerable self-driving data agent system.arXiv preprint arXiv:2603.28889(2026)
arXiv 2026
-
[11]
Junjie Li, Xi Xiao, Yunbei Zhang, Chen Liu, Lin Zhao, Xiaoying Liao, Yingrui Ji, Janet Wang, Jianyang Gu, Yingqiang Ge, Weijie Xu, Xi Fang, Xiang Xu, Tianchen Zhao, Youngeun Kim, Tianyang Wang, Jihun Hamm, Smita Krishnaswamy, Jun Huan, and Chandan K. Reddy. 2026. Agent Harness Engineering: A Survey. https://openreview.net/forum?id=3hXEPbG0dh Under review for TMLR
2026
-
[12]
Ji-Feng Luo, Yuzhen Chen, Kaixun Zhang, Xudong An, Menghan Hu, Guangtao Zhai, and Xiao-Ping Zhang. 2025. Human-Centered Financial Signal Analysis Based on Visual Patterns in Stock Charts.IEEE Transactions on Multimedia27 (2025), 4193–4205. https://doi.org/10.1109/TMM.2025.3535278
-
[13]
Nelson, Halden Lin, Adam M
Dominik Moritz, Chenglong Wang, Greg L. Nelson, Halden Lin, Adam M. Smith, Bill Howe, and Jeffrey Heer. 2018. Formalizing Visualization Design Knowledge as Constraints: Actionable and Extensible Models in Draco.IEEE Transactions on Visualization and Computer Graphics(2018)
2018
-
[14]
Xuying Ning, Katherine Tieu, Dongqi Fu, Tianxin Wei, Zihao Li, et al. 2026. Code as Agent Harness.arXiv preprint arXiv:2605.18747(2026)
Pith/arXiv arXiv 2026
-
[15]
Bo Pan, Yixiao Fu, Ke Wang, Junyu Lu, Lunke Pan, Ziyang Qian, Yuhan Chen, Guoliang Wang, Yitao Zhou, Li Zheng, Yinghao Tang, Zhen Wen, Yuchen Wu, Junhua Lu, Biao Zhu, Minfeng Zhu, Bo Zhang, and Wei Chen. 2025. VIS-Shepherd: Constructing Critic for LLM-based Data Visualization Generation.arXiv preprint arXiv:2506.13326(2025)
arXiv 2025
-
[16]
Timo Schick, Jane Dwivedi-Yu, Roberto Dessì, Roberta Raileanu, Maria Lomeli, Luke Zettlemoyer, Nicola Cancedda, and Thomas Scialom. 2023. Toolformer: Language Models Can Teach Themselves to Use Tools. InAdvances in Neural Information Processing Systems
2023
-
[17]
Wonduk Seo et al . 2025. VisPath: Automated Visualization Code Synthesis via Multi-Path Reasoning and Feedback-Driven Optimization.arXiv preprint arXiv:2502.11140(2025)
arXiv 2025
-
[18]
Yinghao Tang, Tingfeng Lan, Xiuqi Huang, Hui Lu, and Wei Chen. 2025. SCOR- PIO: Serving the Right Requests at the Right Time for Heterogeneous SLOs in LLM Inference.arXiv preprint arXiv:2505.23022(2025)
arXiv 2025
-
[19]
Yinghao Tang, Xueding Liu, Boyuan Zhang, Tingfeng Lan, Yupeng Xie, Jiale Lao, Yiyao Wang, Haoxuan Li, Tingting Gao, Bo Pan, Luoxuan Weng, Xiuqi Huang, Minfeng Zhu, Yingchaojie Feng, Yuyu Luo, and Wei Chen. 2026. IGenBench: Benchmarking the Reliability of Text-to-Infographic Generation.arXiv preprint arXiv:2601.04498(2026)
Pith/arXiv arXiv 2026
-
[20]
Yinghao Tang, Yupeng Xie, Yingchaojie Feng, Tingfeng Lan, and Wei Chen. 2026. Demonstrating ViviDoc: Generating Interactive Documents through Human- Agent Collaboration.arXiv preprint arXiv:2603.01912(2026)
arXiv 2026
-
[21]
Yinghao Tang, Yupeng Xie, Yingchaojie Feng, Tingfeng Lan, Jiale Lao, Yue Cheng, and Wei Chen. 2026. ViviDoc: Generating Interactive Documents through Human-Agent Collaboration.arXiv preprint arXiv:2603.27991(2026)
arXiv 2026
-
[22]
Priyan Vaithilingam, Elena L Glassman, Jeevana Priya Inala, and Chenglong Wang. 2024. Dynavis: Dynamically synthesized ui widgets for visualization editing. InProceedings of the 2024 CHI Conference on Human Factors in Computing Systems. 1–17
2024
-
[23]
Chenglong Wang, Bongshin Lee, Steven M Drucker, Dan Marshall, and Jianfeng Gao. 2025. Data formulator 2: Iterative creation of data visualizations, with ai transforming data along the way. InProceedings of the 2025 CHI Conference on Human Factors in Computing Systems. 1–17
2025
-
[24]
Xingyao Wang et al . 2025. OpenHands: An Open Platform for AI Software Developers as Generalist Agents. InInternational Conference on Learning Repre- sentations
2025
-
[25]
Zelin Wang, Yuanyuan Yin, Jien Wang, Haiyan Yan, Xuan Xie, and Yiqing Zheng
-
[26]
ggplotAgent: a self-debugging multi-modal agent for robust and repro- ducible scientific visualization.Bioinformatics Advances6, 1 (2026), vbaf332
2026
-
[27]
Luoxuan Weng, Yinghao Tang, Yingchaojie Feng, Zhuo Chang, Ruiqin Chen, Haozhe Feng, Chen Hou, Danqing Huang, Yang Li, Huaming Rao, Haonan Wang, Canshi Wei, Xiaofeng Yang, Yuhui Zhang, Yifeng Zheng, Xiuqi Huang, Minfeng Zhu, Yuxin Ma, Bin Cui, Peng Chen, and Wei Chen. 2025. DataLab: A Unified Platform for LLM-Powered Business Intelligence. InIEEE Internati...
-
[28]
White, Doug Burger, and Chi Wang
Qingyun Wu, Gagan Bansal, Jieyu Zhang, Yiran Wu, Beibin Li, Erkang Zhu, Li Jiang, Xiaoyun Zhang, Shaokun Zhang, Jiale Liu, Ahmed Hassan Awadallah, Ryen W. White, Doug Burger, and Chi Wang. 2023. AutoGen: Enabling Next-Gen LLM Applications via Multi-Agent Conversation.arXiv preprint arXiv:2308.08155 (2023)
Pith/arXiv arXiv 2023
-
[29]
Yupeng Xie, Yuyu Luo, Guoliang Li, and Nan Tang. 2024. HAIChart: Human and AI Paired Visualization System.Proceedings of the VLDB Endowment(2024). https://doi.org/10.14778/3681954.3681992
-
[30]
Yupeng Xie, Zhiyang Zhang, Yifan Wu, Sirong Lu, Jiayi Zhang, Zhaoyang Yu, Jinlin Wang, Sirui Hong, Bang Liu, Chenglin Wu, and Yuyu Luo. 2025. VisJudge- Bench: Aesthetics and Quality Assessment of Visualizations.arXiv preprint arXiv:2510.22373(2025)
arXiv 2025
-
[31]
Pengyu Yan et al. 2024. ChartReformer: Natural Language-Driven Chart Image Editing. InICDAR
2024
-
[32]
Jimenez, Alexander Wettig, Kilian Lieret, Shunyu Yao, Karthik Narasimhan, and Ofir Press
John Yang, Carlos E. Jimenez, Alexander Wettig, Kilian Lieret, Shunyu Yao, Karthik Narasimhan, and Ofir Press. 2024. SWE-agent: Agent-Computer Inter- faces Enable Automated Software Engineering. InAdvances in Neural Information Processing Systems
2024
-
[33]
Zhiyu Yang, Zihan Zhou, Shuo Wang, Xin Cong, Xu Han, Yukun Yan, Zhenghao Liu, Zhixing Tan, Pengyuan Liu, Dong Yu, Zhiyuan Liu, Xiaodong Shi, and Maosong Sun. 2024. MatPlotAgent: Method and Evaluation for LLM-based Agentic Scientific Data Visualization.arXiv preprint arXiv:2402.11453(2024)
arXiv 2024
-
[34]
Shunyu Yao, Jeffrey Zhao, Dian Yu, Nan Du, Izhak Shafran, Karthik Narasimhan, and Yuan Cao. 2023. ReAct: Synergizing Reasoning and Acting in Language Models. InInternational Conference on Learning Representations
2023
-
[35]
Fatemeh Pesaran Zadeh, Juyeon Kim, Jin-Hwa Kim, and Gunhee Kim. 2024. Text2Chart31: Instruction tuning for chart generation with automatic feedback. InProceedings of the 2024 Conference on Empirical Methods in Natural Language Processing. 11459–11480
2024
-
[36]
Xuanle Zhao et al. 2025. ChartCoder: Advancing Multimodal Large Language Model for Chart-to-Code Generation.arXiv preprint arXiv:2501.06598(2025)
arXiv 2025
-
[37]
Xu, Hao Zhu, Xuhui Zhou, Robert Lo, Abishek Sridhar, Xianyi Cheng, Tianyue Ou, Yonatan Bisk, Daniel Fried, Uri Alon, and Graham Neubig
Shuyan Zhou, Frank F. Xu, Hao Zhu, Xuhui Zhou, Robert Lo, Abishek Sridhar, Xianyi Cheng, Tianyue Ou, Yonatan Bisk, Daniel Fried, Uri Alon, and Graham Neubig. 2024. WebArena: A Realistic Web Environment for Building Autonomous Agents. InInternational Conference on Learning Representations
2024
-
[38]
Minjun Zhu, Zhen Lin, Yixuan Weng, Panzhong Lu, Qiujie Xie, Yifan Wei, Sifan Liu, Qiyao Sun, and Yue Zhang. 2026. AutoFigure: Generating and Refining Publication-Ready Scientific Illustrations.arXiv preprint arXiv:2602.03828(2026)
arXiv 2026
-
[39]
Jonathan Zong, Dhiraj Barnwal, Rupayan Neogy, and Arvind Satyanarayan. 2020. Lyra 2: Designing interactive visualizations by demonstration.IEEE Transactions on Visualization and Computer Graphics27, 2 (2020), 304–314. 7
2020
discussion (0)
Sign in with ORCID, Apple, or X to comment. Anyone can read and Pith papers without signing in.