Beyond Per-Token Pricing: A Concurrency-Aware Methodology for LLM Infrastructure Cost Estimation
Pith reviewed 2026-06-27 08:43 UTC · model grok-4.3
The pith
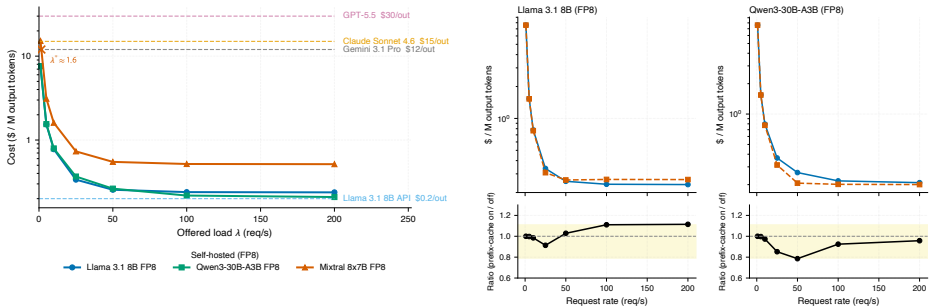
LLM inference cost on the same H100 hardware varies from $0.21 to $15.25 per million output tokens depending on offered request rate.
A machine-rendered reading of the paper's core claim, the machinery that carries it, and where it could break.
Core claim
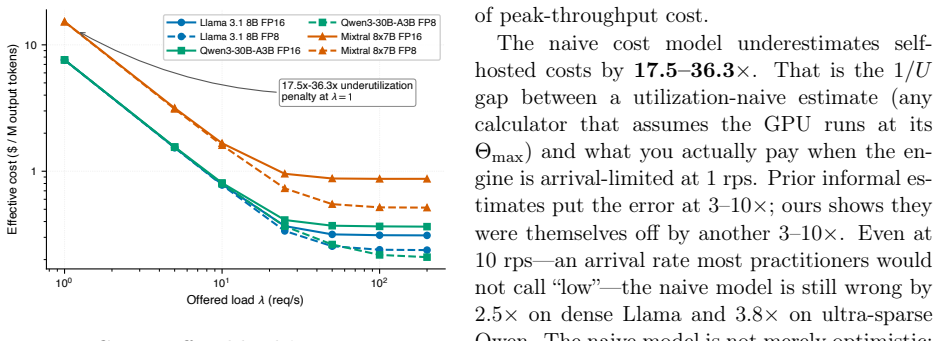
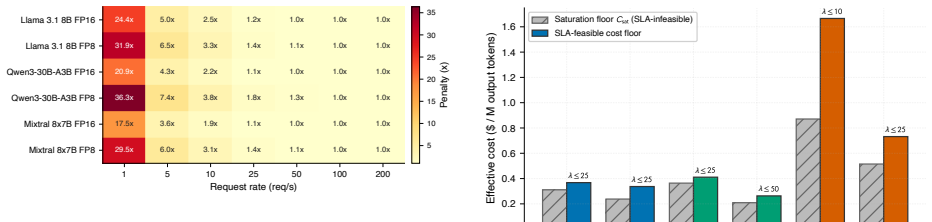
On identical H100 hardware, effective cost per million output tokens ranges from $0.21 to $15.25 as a direct function of offered request rate lambda, which sets in-flight concurrency via Little's Law and produces underutilization penalties of 2.5-24x at 1-10 rps and up to 36.3x near idle; any calculator that takes utilization as a fixed input therefore understates true cost by exactly 1/U, most severely for low-traffic workloads, and the same load-driven spread of 7.0-11.4x reproduces on A100 hardware.
What carries the argument
The parameterized cost function C_eff = f(H, M, Q, lambda, L) that makes offered request rate lambda the explicit driver of concurrency and utilization instead of treating utilization as an independent input.
If this is right
- Utilization-naive calculators understate true cost by exactly 1/U for any given workload.
- Self-hosting estimates are systematically too optimistic, with the largest overstatement at low request rates.
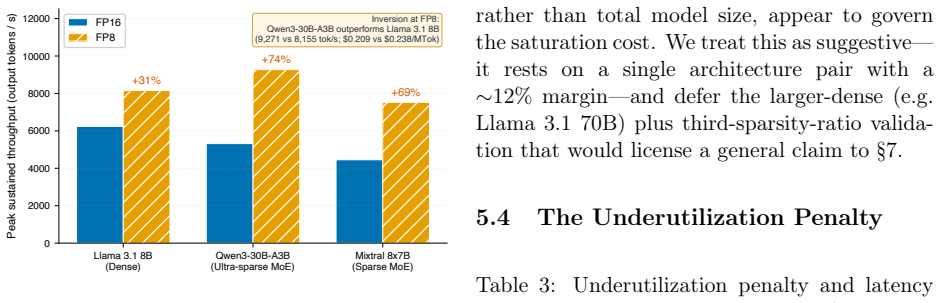
- FP8 quantization improves throughput 2.2-2.4 times more for the tested MoE models than for the dense model.
- Active parameter count, not total model size, is the primary predictor of saturation economics.
- The load-driven cost spread of 7.0-11.4x and the active-parameter ordering both reproduce on A100 hardware.
Where Pith is reading between the lines
- Enterprise operators could attach the released meter to their production traffic to obtain workload-specific cost figures before choosing between self-hosting and cloud.
- Pricing models for inference services could expose lambda or concurrency as a pricing dimension rather than quoting only per-token rates.
- The same measurement approach could be applied to inference engines other than vLLM to test whether the lambda-driven spread is engine-independent.
Load-bearing premise
The 42 benchmarks on dense and MoE models plus 56 A100 runs are representative of general LLM inference workloads and no other unmeasured variables significantly affect the utilization-cost relationship beyond lambda.
What would settle it
A new set of measurements on different hardware or models in which effective cost per token does not vary with lambda over the same range or fails to match the 1/U understatement predicted by the model.
Figures
read the original abstract
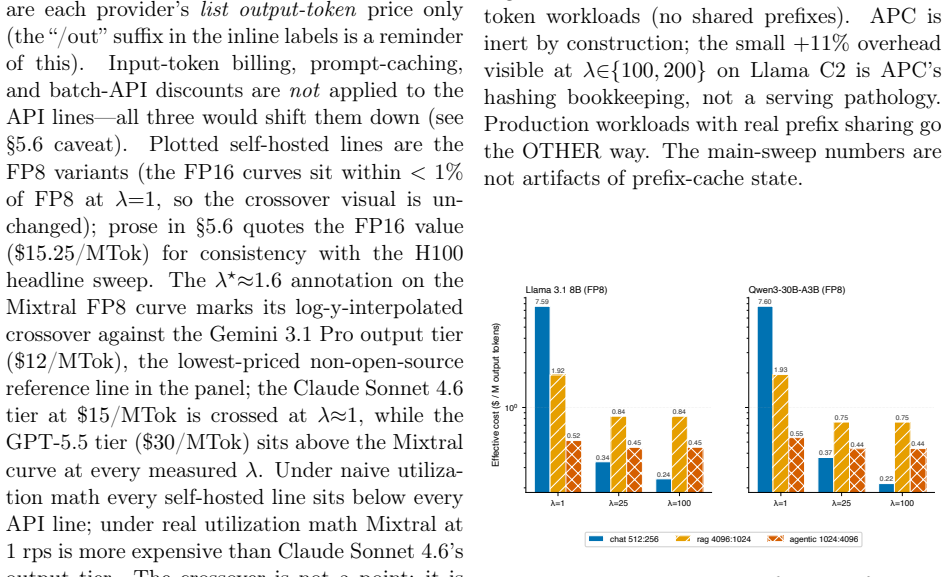
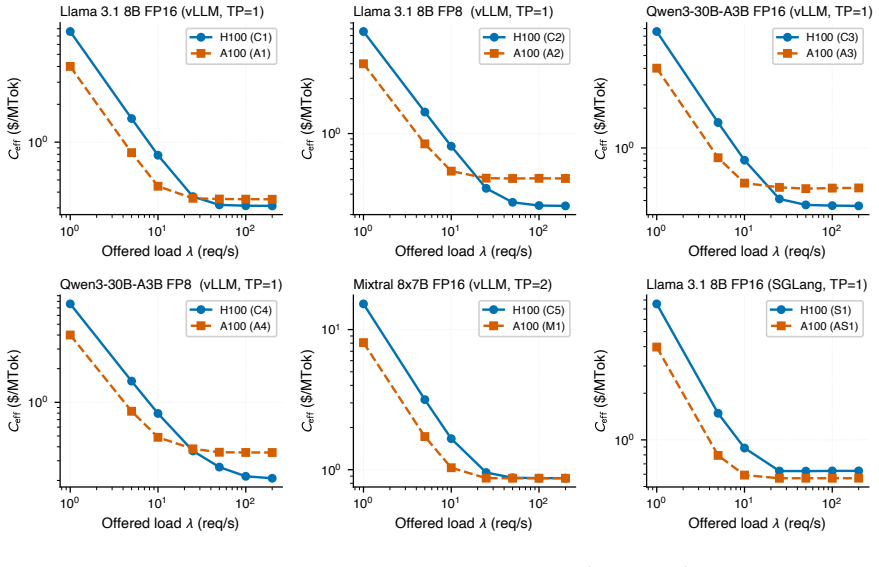
Every public LLM cost calculator we surveyed treats GPU utilization as a fixed input -- entered by the user, baked in as a preset, or silently assumed at 100% -- never measured against the operator's actual load. We show that this assumption is the dominant source of error: on identical H100 hardware, effective cost spans \$0.21 to \$15.25 per million output tokens, an underutilization penalty of 2.5-24x across low-to-moderate enterprise loads (1-10 rps) and up to 36.3x near idle -- driven by one operator-controlled variable, offered request rate lambda, which sets in-flight concurrency via Little's Law and which no open-source calculator exposes. Because calculators take utilization as a user-supplied input, any utilization-naive estimate understates true cost by exactly 1/U, systematically mispricing self-hosting -- most severely over-selling it for low-traffic workloads. We propose a measurement methodology that parameterizes the relationship as C_eff = f(H, M, Q, lambda, L), validate it with 42 benchmarks across dense, ultra-sparse MoE, and sparse MoE models, and release vllm-cost-meter, an open-source cost meter that attaches to a live vLLM server and reports real \$/M-tokens against the operator's own traffic. We further show that FP8 quantization benefits the MoE architectures we tested roughly 2.2-2.4x more than the dense model (+69 to +74% vs. +31% peak throughput; n=3, broader validation needed), and our data are consistent with active parameter count, not total model size, being a primary predictor of saturation economics. To rule out single-hardware confounding we repeat the core sweep on A100 80GB PCIe (56 runs): the load-driven spread reproduces at 7.0-11.4x, the active-parameters ordering survives at FP8, and the dense-FP8 advantage inverts on silicon without native FP8 tensor cores -- a hardware-conditional caveat the framework already accommodates.
Editorial analysis
A structured set of objections, weighed in public.
Referee Report
Summary. The manuscript argues that public LLM cost calculators treat GPU utilization as a fixed or user-supplied input, which is the dominant source of error in cost estimation. On identical H100 hardware, effective cost per million output tokens ranges from $0.21 to $15.25 depending on the operator-controlled offered request rate λ (which sets concurrency via Little's Law), producing underutilization penalties of 2.5–36.3× for low-to-moderate loads. The authors formalize the relationship as C_eff = f(H, M, Q, λ, L), validate the approach empirically across 42 benchmarks on dense, ultra-sparse MoE, and sparse MoE models plus 56 A100 runs, demonstrate hardware-conditional FP8 gains for MoE models, and release the open-source vllm-cost-meter tool that reports live $/M-token costs against real traffic.
Significance. If the measurements and dominance of λ hold, the work identifies a systematic bias in existing calculators that most severely affects low-traffic self-hosting decisions and supplies a practical measurement methodology plus tooling to correct it. Credit is due for the open-source release, the cross-hardware reproduction of the load-driven spread, and the empirical observation that active parameter count (rather than total size) better predicts saturation economics. The FP8 result is noted by the authors as preliminary.
major comments (2)
- [Abstract and empirical validation] Abstract and validation description: the central claim that λ is the dominant operator-controlled variable (and that the reported 2.5–36.3× spread generalizes) requires evidence that query characteristics Q and context L were varied over a representative range; the provided description of the 42 benchmarks supplies no quantitative distribution or sweep over input/output lengths, arrival processes, or context, leaving open whether the cost multipliers would persist under realistic enterprise Q variation.
- [Methodology and results] The assertion that utilization-naive estimates understate true cost by exactly 1/U is load-bearing for the mispricing claim, yet it assumes that the measured utilization is determined solely by λ once H and M are fixed; without explicit controls or ablations showing that other server-internal factors (batching policy, scheduling) do not materially alter the λ–U relationship, the exact 1/U multiplier may not be universal across inference servers.
minor comments (2)
- [Abstract] The abstract states 'n=3' for the FP8 comparison but does not indicate whether these are independent runs or repeated measurements on the same configuration; adding error bars or explicit replication details would strengthen the quantitative claims.
- [Methodology] Notation for the function C_eff = f(H, M, Q, lambda, L) is introduced without an accompanying table or diagram that maps each variable to its measured or controlled status across the benchmark suite.
Simulated Author's Rebuttal
We thank the referee for the constructive comments, which identify areas where additional detail will strengthen the manuscript. We respond to each major comment below and will incorporate revisions to address the concerns on benchmark characterization and methodological robustness.
read point-by-point responses
-
Referee: [Abstract and empirical validation] Abstract and validation description: the central claim that λ is the dominant operator-controlled variable (and that the reported 2.5–36.3× spread generalizes) requires evidence that query characteristics Q and context L were varied over a representative range; the provided description of the 42 benchmarks supplies no quantitative distribution or sweep over input/output lengths, arrival processes, or context, leaving open whether the cost multipliers would persist under realistic enterprise Q variation.
Authors: We agree that the current description of the 42 benchmarks lacks a quantitative summary of Q and L distributions. In the revision we will add a table (new Table 2 or appendix) reporting ranges, means, and distributions for input lengths, output lengths, context lengths, and arrival processes (Poisson) across the benchmarks. These cover standard enterprise-like workloads with variation in Q and L sufficient to support the observed λ-driven spreads. The core claim centers on λ as the operator-controlled variable via Little's Law, with the spread reproduced across model types; the added table will make the representativeness explicit. revision: yes
-
Referee: [Methodology and results] The assertion that utilization-naive estimates understate true cost by exactly 1/U is load-bearing for the mispricing claim, yet it assumes that the measured utilization is determined solely by λ once H and M are fixed; without explicit controls or ablations showing that other server-internal factors (batching policy, scheduling) do not materially alter the λ–U relationship, the exact 1/U multiplier may not be universal across inference servers.
Authors: The 1/U relationship follows from the fixed hardware cost and the empirical observation that token throughput scales linearly with utilization U under the measured λ (via Little's Law). This is specific to the vLLM server used. To address potential effects of batching and scheduling, the revision will include an ablation (new subsection or appendix) varying vLLM parameters such as max_num_seqs and max_batch_size while holding λ fixed, confirming that the λ–U curve and resulting 1/U cost factor remain stable within the tested operating range. The framework itself is parameterized by H and M to accommodate different servers. revision: yes
Circularity Check
No circularity; claims rest on direct empirical measurements
full rationale
The paper's headline cost spans ($0.21–$15.25/M tokens, 2.5–36.3× penalties) are obtained from 42 benchmarks plus 56 A100 runs that directly measure effective cost under varying offered request rates lambda on fixed hardware; Little's Law is invoked solely as the standard queueing relation L = λW to interpret in-flight concurrency, not as a fitted or derived quantity. The parameterization C_eff = f(H, M, Q, lambda, L) is presented as an empirical measurement framework validated against those runs, with no self-citations, no fitted inputs renamed as predictions, and no derivations that reduce by construction to the inputs. The result is therefore independent of the measurement data rather than tautological.
Axiom & Free-Parameter Ledger
axioms (1)
- standard math Little's Law: average concurrency equals arrival rate times average latency
Forward citations
Cited by 1 Pith paper
-
Memory as a Wasting Asset: Pricing Flash Endurance for Embodied Agents, and the Limits of Doing So
Flash endurance is priced via shadow price η making placement cost-optimal for any sign of value-write correlation χ, with χ positive only in recurrent long-horizon manipulation and the budget binding only on low-endu...
Reference graph
Works this paper leans on
-
[1]
G. Pan, V. Chodnekar, A. Roy, and H. Wang. A cost-benefit analysis of on- premise large language model deployment: Breaking even with commercial LLM ser- vices.arXiv preprint arXiv:2509.18101, 2025
arXiv 2025
-
[2]
Irugalbandara, A
C. Irugalbandara, A. Mahendra, R. Liyan- age, et al. Scaling down to scale up: A cost- benefit analysis of replacing OpenAI’s LLM with open source SLMs in production. In IEEE ISPASS, 2024
2024
-
[3]
Agrawal, N
A. Agrawal, N. Kedia, J. Mohan, et al. VIDUR: A large-scale simulation framework for LLM inference. InMLSys, 2024
2024
- [4]
-
[5]
S. Jaiswal et al. SageServe: Optimizing LLM serving on cloud data centers with forecast aware auto-scaling.arXiv preprint arXiv:2502.14617, 2025
arXiv 2025
-
[6]
E. Erdil. Inference economics of language models.arXiv preprint arXiv:2506.04645, 2025
arXiv 2025
- [7]
-
[8]
K. Kim, J. Li, K. Hong, and A. Aila- maki. Faster LLM inference using DBMS- inspired preemption and cache replacement policies (INFERMAX).arXiv preprint arXiv:2411.07447, 2024
arXiv 2024
-
[9]
W. Kwon, Z. Li, S. Zhuang, et al. Ef- ficient memory management for large lan- guage model serving with PagedAttention. InSOSP, 2023
2023
-
[10]
NVIDIA. LLM inference benchmarking: How much does your LLM inference cost? NVIDIA Developer Blog, June 2025.https: //developer.nvidia.com/blog/llm-inf erence-benchmarking-how-much-does-y our-llm-inference-cost/. Accessed 2026- 04-23
2025
-
[11]
Inference unit economics: The true cost per million tokens.Introl Blog, Febru- ary 2026.https://introl.com/blog/infe rence-unit-economics-true-cost-per-m illion-tokens-guide
Introl. Inference unit economics: The true cost per million tokens.Introl Blog, Febru- ary 2026.https://introl.com/blog/infe rence-unit-economics-true-cost-per-m illion-tokens-guide. Accessed 2026-04- 23
2026
-
[12]
LLM Inference TCO Calculator v2.4.https://acnicessc.github.io/ll mcalc/, 2025
acnicessc. LLM Inference TCO Calculator v2.4.https://acnicessc.github.io/ll mcalc/, 2025. Accessed 2026-04-23
2025
-
[13]
llm-optimizer: Benchmark and optimize LLM inference across frameworks
BentoML. llm-optimizer: Benchmark and optimize LLM inference across frameworks. https://github.com/bentoml/llm-optim izer, 2025. Accessed 2026-04-23
2025
-
[14]
InferenceX (formerly Infer- enceMAX): Open-source continuous infer- ence benchmarking.https://github.com /SemiAnalysisAI/InferenceX, 2025
SemiAnalysis. InferenceX (formerly Infer- enceMAX): Open-source continuous infer- ence benchmarking.https://github.com /SemiAnalysisAI/InferenceX, 2025. Ac- cessed 2026-04-23
2025
-
[15]
GuideLLM: Evaluate LLM deployments for real-world inference.http s://github.com/vllm-project/guidellm,
vLLM Project. GuideLLM: Evaluate LLM deployments for real-world inference.http s://github.com/vllm-project/guidellm,
-
[16]
Qwen Team. Qwen3 Technical Report. arXiv preprint arXiv:2505.09388, 2025
Pith/arXiv arXiv 2025
-
[17]
A. Grattafiori, A. Dubey, A. Jauhri, et al. The Llama 3 Herd of Models.arXiv preprint arXiv:2407.21783, 2024
Pith/arXiv arXiv 2024
-
[18]
A. Q. Jiang, A. Sablayrolles, A. Roux, et al. Mixtral of Experts.arXiv preprint arXiv:2401.04088, 2024
Pith/arXiv arXiv 2024
-
[19]
API Pricing.https://develope rs.openai.com/api/docs/pricing, 2026
OpenAI. API Pricing.https://develope rs.openai.com/api/docs/pricing, 2026. Accessed 2026-06-09
2026
-
[20]
Claude API Pricing.https:// claude.com/pricing, 2026
Anthropic. Claude API Pricing.https:// claude.com/pricing, 2026. Accessed 2026- 06-09. 25
2026
-
[21]
Gemini API Pricing.https://ai .google.dev/gemini-api/docs/pricing,
Google. Gemini API Pricing.https://ai .google.dev/gemini-api/docs/pricing,
-
[22]
inference-perf: GenAI inference performance benchmarking tool.https://github.com/kubernetes-s igs/inference-perf, 2025
Kubernetes SIG Serving. inference-perf: GenAI inference performance benchmarking tool.https://github.com/kubernetes-s igs/inference-perf, 2025. Accessed 2026- 04-23
2025
-
[23]
LLMPerf: A tool for benchmark- ing LLMs.https://github.com/ray-pro ject/llmperf, 2024
Anyscale. LLMPerf: A tool for benchmark- ing LLMs.https://github.com/ray-pro ject/llmperf, 2024. Accessed 2026-04-23
2024
-
[24]
GenAI-Perf: Benchmark genera- tive AI models.https://github.com/tri ton-inference-server/perf_analyzer,
NVIDIA. GenAI-Perf: Benchmark genera- tive AI models.https://github.com/tri ton-inference-server/perf_analyzer,
-
[25]
Patel, E
P. Patel, E. Choukse, C. Zhang, et al. Split- wise: Efficient generative LLM inference us- ing phase splitting. InISCA, 2024
2024
-
[26]
Zhong, S
Y. Zhong, S. Liu, J. Chen, et al. Dist- Serve: Disaggregating prefill and decoding for goodput-optimized large language model serving. InOSDI, 2024
2024
-
[27]
Agrawal, N
A. Agrawal, N. Kedia, A. Panwar, et al. Taming Throughput-Latency Tradeoff in LLMInferencewithSarathi-Serve. InOSDI, 2024
2024
-
[28]
Zheng, L
L. Zheng, L. Yin, Z. Xie, et al. SGLang: Efficient execution of structured language model programs. InNeurIPS, 2024
2024
-
[29]
Zheng, W.-L
L. Zheng, W.-L. Chiang, Y. Sheng, et al. LMSYS-Chat-1M: A large-scale real-world LLM conversation dataset. InICLR, 2024
2024
-
[30]
G.-I. Yu, J. S. Jeong, G.-W. Kim, et al. Orca: A distributed serving system for transformer-based generative models. In OSDI, 2022
2022
-
[31]
R. Qin, Z. Li, W. He, et al. Moon- cake: A KVCache-centric disaggregated ar- chitecture for LLM serving.arXiv preprint arXiv:2407.00079, 2024
arXiv 2024
-
[32]
Y. Liu, Y. Cheng, J. Yao, et al. LM- Cache: An efficient KV cache layer for enterprise-scale LLM inference.arXiv preprint arXiv:2510.09665, 2025
arXiv 2025
-
[33]
B. Sun, Z. Huang, H. Zhao, et al. Llum- nix: Dynamic scheduling for large language model serving. InOSDI, 2024
2024
-
[34]
Y. Wang, Y. Chen, Z. Li, et al. Burst- GPT: A real-world workload dataset to op- timize LLM serving systems.arXiv preprint arXiv:2401.17644, 2024
arXiv 2024
-
[35]
Y. Xiang, X. Li, K. Qian, et al. ServeGen: Workloadcharacterizationandgenerationof large language model serving in production. arXiv preprint arXiv:2505.09999, 2025. 26
Pith/arXiv arXiv 2025
discussion (0)
Sign in with ORCID, Apple, or X to comment. Anyone can read and Pith papers without signing in.