Which Portfolios? The Construction Dependence of Factor Model Performance
Pith reviewed 2026-06-26 18:10 UTC · model grok-4.3
The pith
Factor model performance depends on how test portfolios are constructed.
A machine-rendered reading of the paper's core claim, the machinery that carries it, and where it could break.
Core claim
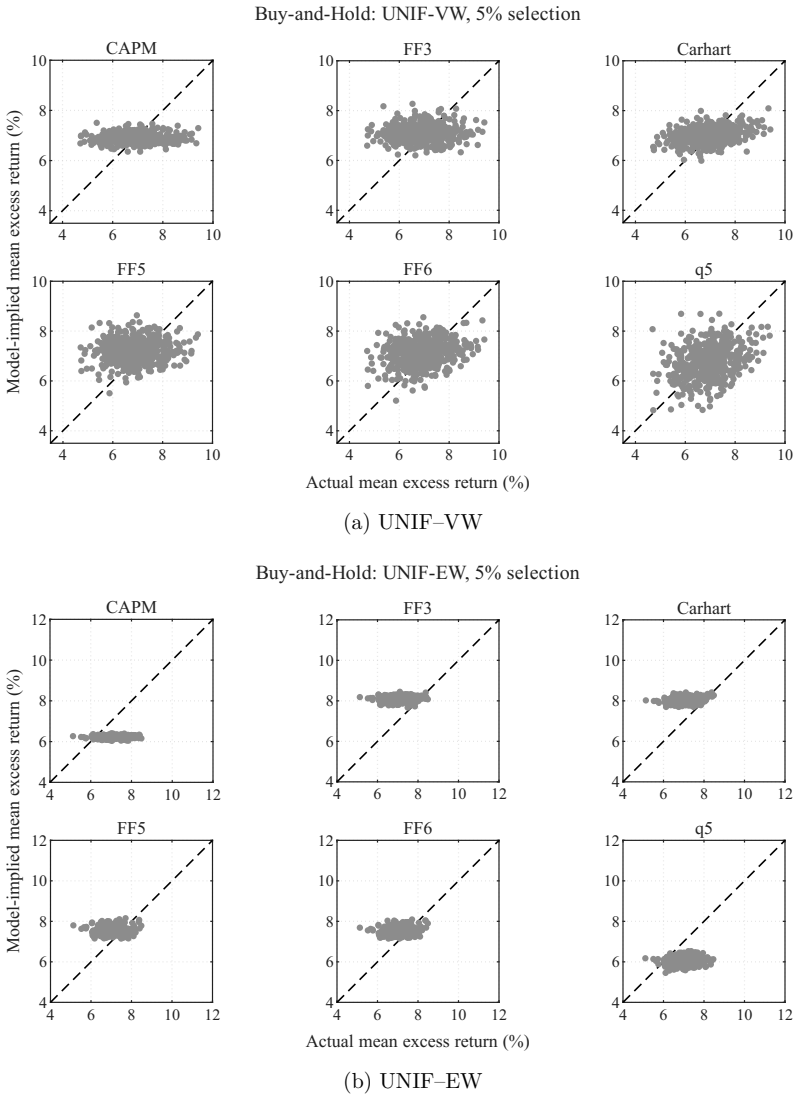
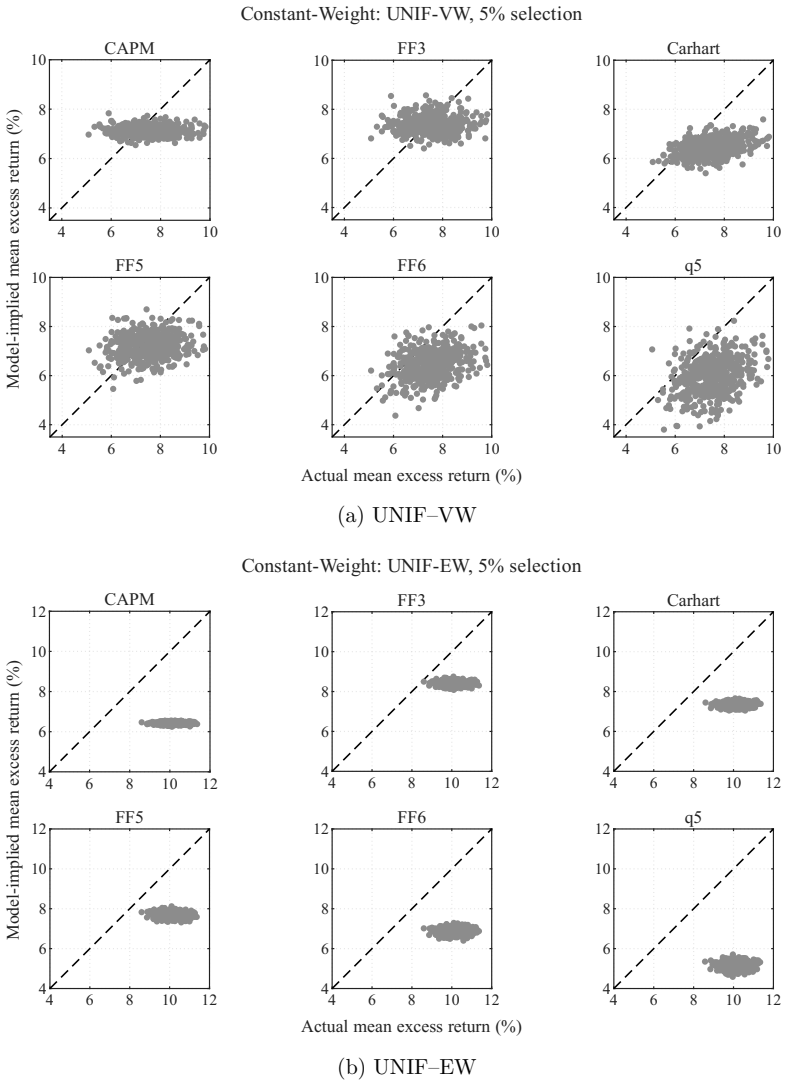
Factor-model performance depends not only on the model but also on how test assets are constructed. We form characteristic-unsorted random portfolios from a broad CRSP universe and vary stock selection, initial weighting, holding, and rebalancing. Rankings shift materially: buy-and-hold favors FF5 and FF6, whereas daily constant-weighting favors FF3, the most stable model across designs. Although q5 attains the highest maximum Sharpe ratio in factor-spanning tests, it leaves comparatively large and construction-sensitive pricing errors on random portfolios. These results reflect construction-specific weighting of each model's pricing-error vector. Test-asset construction, including dynamic w
What carries the argument
Construction-specific weighting of each model's pricing-error vector, which determines how a given portfolio design emphasizes or de-emphasizes different pricing mistakes across models.
If this is right
- Buy-and-hold portfolios favor FF5 and FF6.
- Daily constant-weighting portfolios favor FF3 as the most stable across designs.
- q5 attains the highest maximum Sharpe ratio in factor-spanning tests yet produces comparatively large and construction-sensitive pricing errors.
- Test-asset construction including dynamic weight management functions as a design choice that affects model evaluation conclusions.
Where Pith is reading between the lines
- Standard characteristic-sorted test assets may embed their own construction biases that interact with the same pricing-error weighting mechanism.
- Model comparisons would benefit from systematic robustness checks across multiple portfolio constructions rather than a single default design.
- The interaction between dynamic rebalancing rules and factor exposures could be examined directly by holding construction fixed while varying only rebalancing frequency.
Load-bearing premise
That varying stock selection, initial weighting, holding, and rebalancing on random portfolios from the CRSP universe sufficiently isolates construction dependence without other unmodeled biases or data artifacts affecting the observed ranking shifts.
What would settle it
Finding that model performance rankings remain identical across all tested variations in stock selection, weighting, holding, and rebalancing rules would falsify the claim of construction dependence.
Figures
read the original abstract
Factor-model performance depends not only on the model but also on how test assets are constructed. We form characteristic-unsorted random portfolios from a broad CRSP universe and vary stock selection, initial weighting, holding, and rebalancing. Rankings shift materially: buy-and-hold favors FF5 and FF6, whereas daily constant-weighting favors FF3, the most stable model across designs. Although q5 attains the highest maximum Sharpe ratio in factor-spanning tests, it leaves comparatively large and construction-sensitive pricing errors on random portfolios. These results reflect construction-specific weighting of each model's pricing-error vector. Test-asset construction, including dynamic weight management, is therefore a design choice in model evaluation.
Editorial analysis
A structured set of objections, weighed in public.
Referee Report
Summary. The paper claims that factor-model performance depends on test-asset construction in addition to the model itself. Using characteristic-unsorted random portfolios drawn from the CRSP universe, the authors vary stock selection, initial weighting, holding periods, and rebalancing rules. They report material shifts in model rankings (buy-and-hold favors FF5/FF6 while daily constant-weighting favors FF3) and note that q5 attains the highest maximum Sharpe ratio in factor-spanning tests yet leaves comparatively large and construction-sensitive pricing errors. The results are interpreted as evidence that different constructions apply different weights to each model's pricing-error vector, making construction a design choice in model evaluation.
Significance. If the empirical patterns are robust, the finding would underscore that test-asset construction choices materially affect inferences about relative model performance. This would add a practical caution to the asset-pricing literature on factor-model horse races and pricing-error diagnostics, emphasizing that rankings are not invariant to portfolio-formation mechanics.
major comments (2)
- [Empirical design and results sections] The central empirical claim rests on the assertion that varying stock selection, weighting, holding, and rebalancing on random CRSP portfolios isolates construction dependence. The manuscript must supply explicit robustness checks (alternative exclusion rules, winsorization thresholds, and bootstrap or analytical standard errors on the reported ranking shifts) to rule out data-handling artifacts or unmodeled selection biases; without these, the observed shifts cannot be confidently attributed to construction alone.
- [Factor-spanning and pricing-error results] The abstract states that q5 leaves 'comparatively large and construction-sensitive pricing errors' while attaining the highest maximum Sharpe ratio. The paper should report the precise pricing-error metric (e.g., mean absolute alpha, cross-sectional R², or GRS statistic) and the associated standard errors or p-values for each construction; otherwise the contrast with the Sharpe-ratio result remains unquantified.
minor comments (2)
- [Data section] Clarify the exact CRSP sample period, number of random portfolios drawn, and rebalancing frequency definitions in the main text or a dedicated data appendix.
- [Results] Add a table or figure that directly juxtaposes the model rankings (with confidence intervals) across the main construction variants to make the 'material shifts' visually and quantitatively transparent.
Simulated Author's Rebuttal
We thank the referee for the constructive comments, which highlight important areas for strengthening the empirical evidence. We address each major comment below and outline the revisions we will make.
read point-by-point responses
-
Referee: [Empirical design and results sections] The central empirical claim rests on the assertion that varying stock selection, weighting, holding, and rebalancing on random CRSP portfolios isolates construction dependence. The manuscript must supply explicit robustness checks (alternative exclusion rules, winsorization thresholds, and bootstrap or analytical standard errors on the reported ranking shifts) to rule out data-handling artifacts or unmodeled selection biases; without these, the observed shifts cannot be confidently attributed to construction alone.
Authors: We agree that explicit robustness checks are needed to isolate construction effects from potential data artifacts. In the revised manuscript we will add results using alternative exclusion rules (e.g., different minimum-price and size thresholds), varied winsorization thresholds, and bootstrap standard errors on the reported differences in model rankings across constructions. These additions will directly address concerns about selection biases and data-handling artifacts. revision: yes
-
Referee: [Factor-spanning and pricing-error results] The abstract states that q5 leaves 'comparatively large and construction-sensitive pricing errors' while attaining the highest maximum Sharpe ratio. The paper should report the precise pricing-error metric (e.g., mean absolute alpha, cross-sectional R², or GRS statistic) and the associated standard errors or p-values for each construction; otherwise the contrast with the Sharpe-ratio result remains unquantified.
Authors: We accept that the abstract's reference to pricing errors requires greater precision. The revised manuscript will explicitly identify the pricing-error metric used, report the associated standard errors or p-values for each construction, and thereby quantify the contrast with the maximum Sharpe ratio results. revision: yes
Circularity Check
No significant circularity
full rationale
The paper is a purely empirical study that constructs random characteristic-unsorted portfolios from CRSP, varies stock selection/weighting/holding/rebalancing rules, and directly compares resulting performance rankings across factor models (FF3/FF5/FF6/q5). No equations, derivations, fitted parameters renamed as predictions, or load-bearing self-citations appear in the provided abstract or description. The central claim—that rankings are construction-dependent—is established by the observed shifts themselves rather than by any reduction to prior inputs or definitions. This matches the default expectation of a non-circular empirical paper.
Axiom & Free-Parameter Ledger
Forward citations
Cited by 1 Pith paper
-
Anatomy of the Market: A Body-Tail Test of Factor Models
Body-tail decomposition of the market portfolio shows that q5 alone produces offsetting leg alphas and falls below its market baseline despite strong spanning performance.
Reference graph
Works this paper leans on
-
[1]
Gibbons, M. R., Ross, S. A., & Shanken, J. (1989). A test of the efficiency of a given portfolio. Econometrica, 57(5), 1121--1152. https://www.jstor.org/stable/1913625
arXiv 1989
-
[2]
Lo, A. W., & MacKinlay, A. C. (1990). Data-snooping biases in tests of financial asset pricing models. The Review of Financial Studies, 3(3), 431--467. https://doi.org/10.1093/rfs/3.3.431
-
[3]
The Journal of Finance52(1), 57–82 (1997) https://doi.org/10.1111/j.1540-6261.1997.tb03808.x
Hansen, L. P., & Jagannathan, R. (1997). Assessing specification errors in stochastic discount factor models. The Journal of Finance, 52(2), 557--590. https://doi.org/10.1111/j.1540-6261.1997.tb04813.x
-
[4]
Cochrane, J. H. (2005). Asset Pricing (Revised ed.). Princeton University Press. https://www.johnhcochrane.com/asset-pricing
2005
-
[5]
Lewellen, J., Nagel, S., & Shanken, J. (2010). A skeptical appraisal of asset-pricing tests. Journal of Financial Economics, 96(2), 175--194. https://doi.org/10.1016/j.jfineco.2009.09.001
-
[6]
Barillas, F., & Shanken, J. (2017). Which alpha? The Review of Financial Studies, 30(4), 1316--1338. https://doi.org/10.1093/rfs/hhw101
-
[7]
Barillas, F., & Shanken, J. (2018). Comparing asset pricing models. The Journal of Finance, 73(2), 715--754. https://doi.org/10.1111/jofi.12607
-
[8]
Kozak, S., Nagel, S., & Santosh, S. (2018). Interpreting factor models. The Journal of Finance, 73(3), 1183--1223. https://doi.org/10.1111/jofi.12612
-
[9]
Giglio, S., Xiu, D., & Zhang, D. (2025). Test assets and weak factors. The Journal of Finance, 80(1), 259--319. https://doi.org/10.1111/jofi.13415
-
[10]
Jegadeesh, N., & Titman, S. (1993). Returns to buying winners and selling losers: Implications for stock market efficiency. The Journal of Finance, 48(1), 65--91. https://doi.org/10.1111/j.1540-6261.1993.tb04702.x
-
[11]
Carhart, M. M. (1997). On persistence in mutual fund performance. The Journal of Finance, 52(1), 57--82. https://doi.org/10.1111/j.1540-6261.1997.tb03808.x
-
[12]
The Jour- nal of Finance47(2), 427–465 (1992) https://doi.org/10.1111/j.1540-6261.1992
Fama, E. F., & French, K. R. (1992). The cross-section of expected stock returns. The Journal of Finance, 47(2), 427--465. https://doi.org/10.1111/j.1540-6261.1992.tb04398.x
-
[13]
Fama, E. F., & French, K. R. (1993). Common risk factors in the returns on stocks and bonds. Journal of Financial Economics, 33(1), 3--56. https://doi.org/10.1016/0304-405X(93)90023-5
-
[14]
Fama, E. F., & French, K. R. (2015). A five-factor asset pricing model. Journal of Financial Economics, 116(1), 1--22. https://doi.org/10.1016/j.jfineco.2014.10.010
-
[15]
Fama, E. F., & French, K. R. (2018). Choosing factors. Journal of Financial Economics, 128(2), 234--252. https://doi.org/10.1016/j.jfineco.2018.02.012
-
[16]
Hou, K., Xue, C., & Zhang, L. (2015). Digesting anomalies: An investment approach. The Review of Financial Studies, 28(3), 650--705. https://doi.org/10.1093/rfs/hhu068
-
[17]
Hou, K., Mo, H., Xue, C., & Zhang, L. (2019). Which factors? Review of Finance, 23(1), 1--35. https://doi.org/10.1093/rof/rfy032
-
[18]
Hou, K., Xue, C., & Zhang, L. (2020). Replicating anomalies. The Review of Financial Studies, 33(5), 2019--2133. https://doi.org/10.1093/rfs/hhy131
-
[19]
Hou, K., Mo, H., Xue, C., & Zhang, L. (2021). An augmented q-factor model with expected growth. Review of Finance, 25(1), 1--41. https://doi.org/10.1093/rof/rfaa004
-
[20]
Hou, K., Mo, H., Xue, C., & Zhang, L. (2024). The economics of security analysis. Management Science, 70(1), 164--186. https://doi.org/10.1287/mnsc.2022.4640
-
[21]
French, K. R. (2026). Kenneth R. French Data Library [Data set]. Accessed May 5, 2026. https://mba.tuck.dartmouth.edu/pages/faculty/ken.french/data_library.html
2026
-
[22]
Global-q.org. (2026). Factors and testing portfolios [Data set]. Accessed May 5, 2026. https://global-q.org/factors.html
2026
discussion (0)
Sign in with ORCID, Apple, or X to comment. Anyone can read and Pith papers without signing in.