REVIEW 3 major objections 4 minor 1 cited by
Repeating fast radio bursts more often show falling dispersion measure, consistent with young supernova remnants expanding around them.
Reviewed by Pith at T0; open to challenge. T0 means a machine referee read the full paper against a public rubric. the ladder, T0–T4 →
T0 review · grok-4.5
2026-07-13 07:20 UTC pith:KJNMLMVN
load-bearing objection Clean CHIME-only DM-rate analysis with a transparent golden-sample cut; the headline p=0.033 is real but rests on heterogeneous literature additions and is not yet decisive. the 3 major comments →
Indication for Decreasing Dispersion Measure in the Population of Repeating Fast Radio Bursts and Connection to Young Supernova Remnant Expansion
The pith
A machine-rendered reading of the paper's core claim, the machinery that carries it, and where it could break.
Core claim
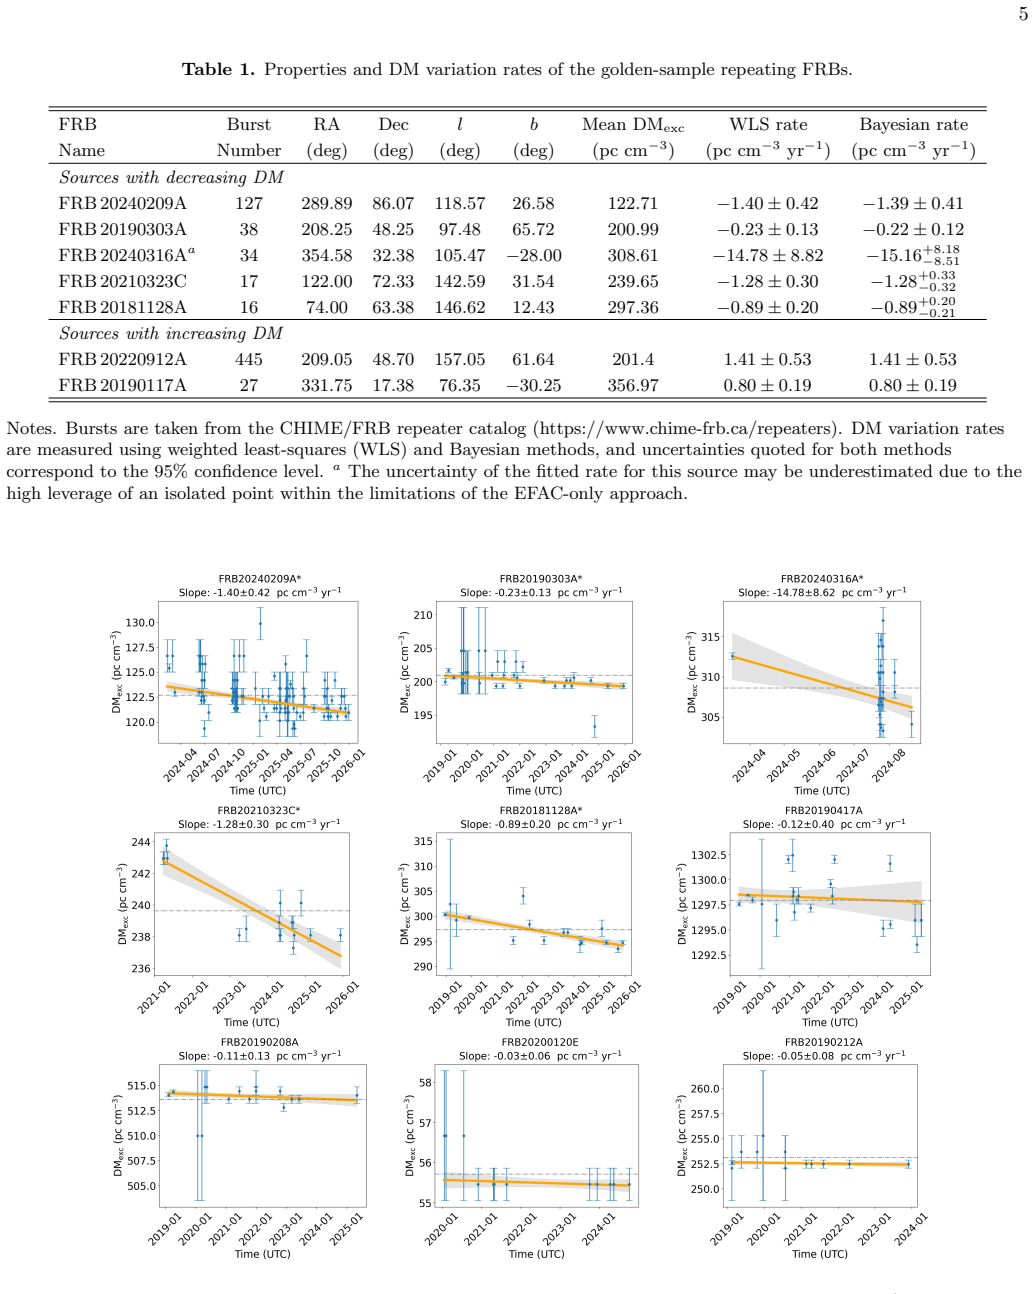
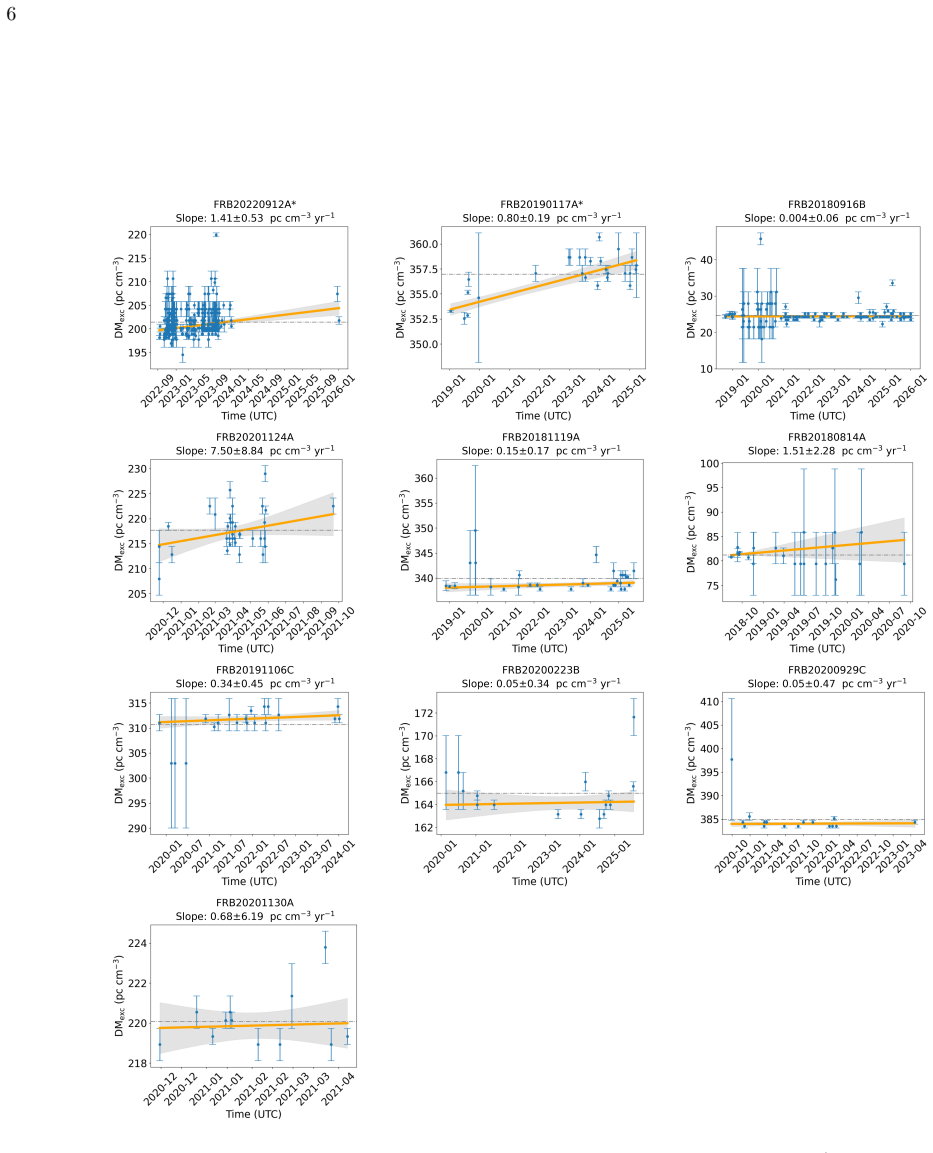
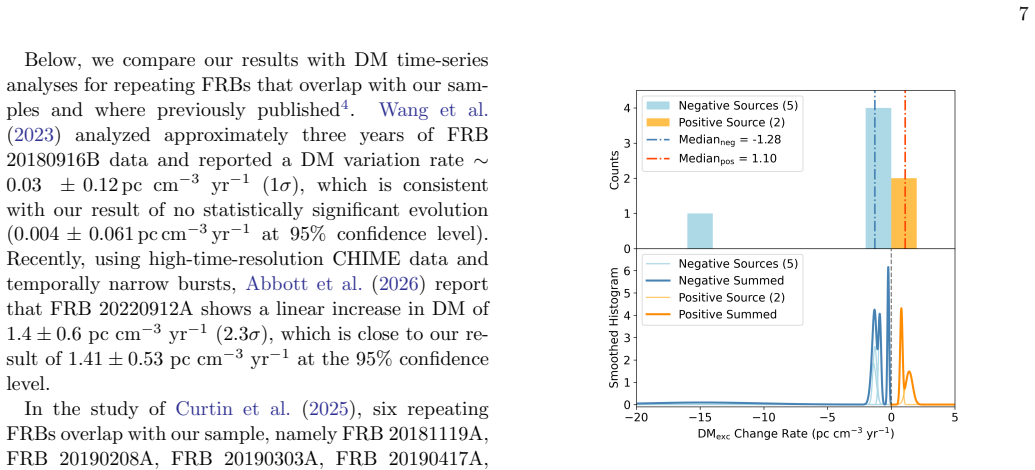
In a carefully selected golden sample of repeating FRBs plus four literature sources with published rates, decreasing long-term dispersion-measure trends outnumber increasing ones (9 to 2). A binomial test under the null of equal probability returns p = 0.033, supporting the claim that decreasing DM is the more common evolutionary path and that the local electron density around most repeaters is generally falling with time.
What carries the argument
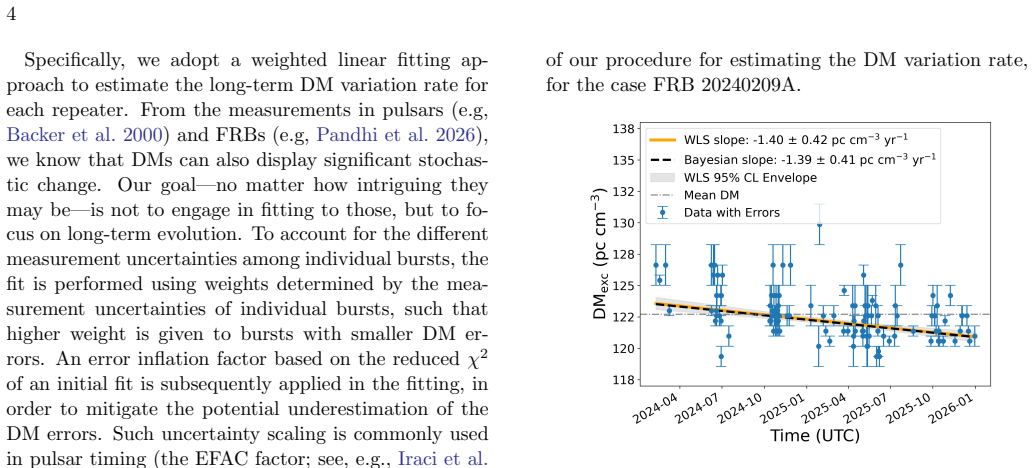
The golden-sample cut (weighted least-squares linear fit of excess DM versus time, cross-checked by a Bayesian linear model, both required to exclude zero slope at 95 percent and to agree on sign) followed by a binomial test of the resulting sign counts against the null that decreasing and increasing trends are equally likely.
Load-bearing premise
That the seven golden-sample sources and the four added literature sources form an unbiased draw from the true repeater population with respect to the sign of long-term DM change, so a simple coin-flip binomial test is valid.
What would settle it
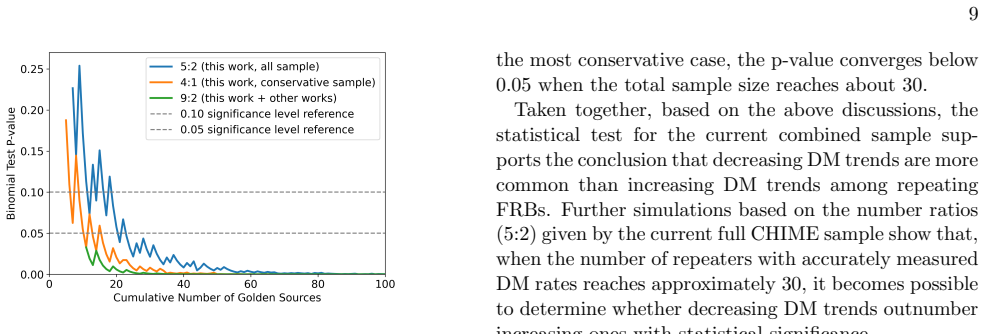
Accumulate roughly thirty additional repeaters that meet the same golden-sample criteria for significant DM rate; if the decreasing-to-increasing ratio remains near 5:2 the p-value will fall well below 0.05, while a ratio near 1:1 will erase the claimed population asymmetry.
If this is right
- Most repeating FRBs are young enough that their local environments still contribute a measurably declining electron column.
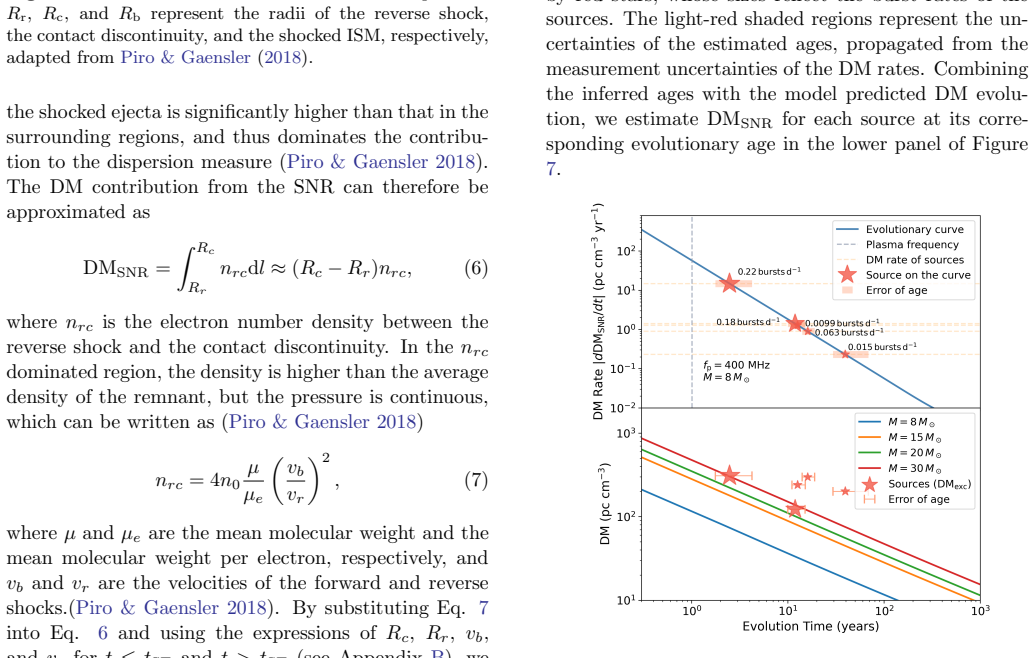
- Measured DM rates can be mapped, inside a standard SNR expansion model, onto remnant ages and the remnant's own DM contribution for different ejecta masses.
- The minority of sources that show rising DM require additional mechanisms (binary orbital modulation or neutron-star kick through the far side of an SNR shell).
- Once ~30 golden-sample rates exist, the population preference for decreasing DM can be confirmed or refuted at high significance.
Where Pith is reading between the lines
- If the SNR picture is correct, the same sources should also show a secular decline in free-free optical depth or scattering measure on comparable timescales.
- A growing golden sample will allow a joint fit of ejecta mass and ambient density distributions rather than the single-mass illustrative tracks shown here.
- Sources that remain DM-stable for many years may simply be older remnants already past the steepest decline phase, providing a natural age sequence within the repeater class.
Editorial analysis
A structured set of objections, weighed in public.
Referee Report
Summary. The paper selects 19 CHIME repeating FRBs with >10 bursts, applies weighted least-squares linear fits (with EFAC inflation) plus a Bayesian robustness check to DM_exc time series, and defines a golden sample of sources whose DM rate excludes zero at 95% CL with consistent sign. It reports five decreasing and two increasing trends in that sample, then combines them with four literature repeaters that have published significant DM rates (all decreasing) to obtain a binomial-test p-value of 0.033 under the null of equal probability for the two signs. The authors interpret the apparent excess of decreasing trends as consistent with a secular decline in local electron density, for example from young SNR expansion, and provide illustrative age and DM_SNR estimates under the Piro & Gaensler (2018) model for different ejecta masses.
Significance. A statistically robust population asymmetry in the sign of long-term DM evolution would be a useful constraint on FRB local environments and would strengthen the young-SNR association already suggested by individual sources (e.g., FRB 20121102A, FRB 20190520B). The analysis pipeline is transparent: selection cuts, EFAC procedure, dual fitting methods, and the pure-CHIME versus combined samples are all stated explicitly, and the SNR calculation is clearly labeled as illustrative rather than a fit. The result is therefore of genuine interest if the selection and small-number issues can be controlled; at present the claim remains provisional because the decisive p-value appears only after heterogeneous literature additions.
major comments (3)
- Section 4.1 (and Abstract/Conclusion): the headline binomial p = 0.033 is obtained only after enlarging the pure-CHIME golden sample (5:2 or the more conservative 4:1) by four literature sources that were themselves selected and published precisely because they exhibited large, significant DM decreases. The pure-CHIME sample alone yields p = 0.23 (or 0.19). Because those literature objects were not drawn by the same burst-count and significance criteria used for the golden sample, and because positive-rate sources of comparable quality may be under-reported, the combined sample is not guaranteed to be an unbiased draw from the underlying population. The simple p = 0.5 null is therefore not automatically valid; a more careful treatment of selection (or a clear statement that the result is only an indication pending a uniformly selected sample of ~30) is required before the claim can be re
- Section 3.2 versus Table 1 / Abstract / Section 4.1: the text first states that “six sources satisfy the requirements of the golden sample \ldots five exhibit decreasing DM trend, and one shows an increasing trend,” yet Table 1, the later binomial counts, the Abstract and the Conclusion all list seven sources (five decreasing, two increasing). This internal inconsistency must be resolved; it affects both the reported medians and the starting ratios used for the Beta-distribution forecasts in Figure 5.
- Section 3.3 and Table 1 note a: FRB 20240316A is retained in the golden sample even though a single early, high-leverage point dominates the slope and the authors themselves caution that the EFAC-only uncertainty may be underestimated. Because this source contributes one of the five decreasing rates that enter the binomial test, a quantitative leave-one-out or re-weighted analysis (or an explicit decision to drop it from the golden sample) is needed to show that the population asymmetry is not driven by that single datum.
minor comments (4)
- Abstract and Section 3.2: grammatical slips (“two shows an increasing trend,” “two source”) should be corrected.
- Figure 1–3 captions and Section 3.1: the Bayesian prior ranges and the precise definition of the 95 % CL used for golden-sample membership should be stated once in a single place so that the reader does not have to reconstruct them from the text.
- Section 4.2.2 / Figure 7: the assumed ambient density n0 = 1 cm^-3 and the illustrative progenitor masses should be flagged more prominently as free parameters; a short sensitivity check would strengthen the “illustrative” claim.
- Appendix A Table A.1 and main Table 1: the mean DM_exc values are quoted to inconsistent precision; a uniform rounding convention would improve readability.
Circularity Check
No circularity: binomial sign test and linear DM-rate fits are data-driven and independent of the post-hoc SNR model used only for illustrative age estimates.
full rationale
The load-bearing claim is the binomial p=0.033 under a p=0.5 null on the signs of measured long-term DM rates (5 decreasing + 2 increasing in the CHIME golden sample, enlarged by four literature sources to 9:2). Rates themselves are obtained by ordinary weighted least-squares and Bayesian linear fits to the observed DM_exc time series of sources that already satisfy an independent burst-count cut (>10) and a two-method significance cut (both exclude zero at 95 % CL and agree in sign). Nothing in those fits or in the binomial test is defined in terms of the later SNR model; the model (taken from Piro & Gaensler 2018 and Yang & Zhang 2017) is introduced only after the statistical result and is used solely for inverse, illustrative age and DM_SNR estimates by matching observed rates to the model dDM/dt curve. No equation equates a fitted quantity to a claimed prediction by construction, no uniqueness theorem is imported from the authors’ prior work, and the few overlapping-author literature rates enter merely as additional data points rather than as load-bearing premises. Selection or publication bias in the combined sample is a possible validity concern, but it is not circularity under the stated criteria. The derivation chain is therefore self-contained against its own inputs.
Axiom & Free-Parameter Ledger
free parameters (4)
- EFAC (error inflation factor)
- Bayesian prior ranges (DM rate [-50,50], intercept [0,3000], EFAC [1,100])
- Ambient ISM density n0 = 1 cm^-3
- Ejecta mass / progenitor mass (illustrative 8 Msun and variants)
axioms (4)
- domain assumption On few-year timescales, observed DM variations are dominated by the local environment (DM_local) rather than MW, halo, IGM or host ISM.
- ad hoc to paper A linear model plus EFAC is an adequate description of the long-term DM trend for the purpose of sign classification.
- domain assumption Under the null, decreasing and increasing DM trends are equally probable (p=0.5) and sources are independent Bernoulli trials.
- domain assumption Standard SNR expansion formulae (Piro & Gaensler 2018) with constant-density ISM correctly describe the electron-column evolution relevant to FRB DM rates.
read the original abstract
Fast Radio Bursts (FRBs) are millisecond-duration, highly energetic radio transients of uncertain origin. Repeating FRBs provide an excellent population for investigating their nature, particularly through studies of parameter evolution. Out of the 63 repeaters monitored by CHIME, we select the 19 sources with more than ten detected bursts, and examine their long-term dispersion measure (DM) evolution. Seven sources show statistically significant DM evolution and are classified as the golden sample. Of these, five exhibit a decreasing DM trend and two shows an increasing trend. We then perform a binomial test under the null hypothesis that decreasing and increasing DM variation trends have equal probabilities. The current combined sample, including our golden sample and additional repeaters with reported DM change rate from the literature, gives a p-value of 0.033, supporting that decreasing DM trends are more common in the repeating FRB population. This statistical result is consistent with scenarios in that the local electron density around repeaters generally decreases with time, for example due to expansion of a young supernova remnant (SNR). Finally, within the SNR expansion model, we provide an illustrative estimate of the SNR contributions to the DM for different ejecta masses.
Figures

Forward citations
Cited by 1 Pith paper
-
Cross-validation of six dispersion measure estimation methods for FRB 20240114A
Cross-validation of six DM methods on 2874 FRB 20240114A bursts shows morphology-driven scatter and residual second-to-minute apparent DM fluctuations that cannot be real line-of-sight plasma changes.
Reference graph
Works this paper leans on
-
[1]
Abbott, T. C., Pearlman, A. B., Kaspi, V. M., et al. 2026, arXiv e-prints, arXiv:2604.09098, doi: 10.48550/arXiv.2604.09098
-
[2]
Backer, D. C., Wong, T., & Valanju, J. 2000, The Astrophysical Journal, 543, 740, doi: 10.1086/317150 14
doi:10.1086/317150 2000
-
[3]
2022, Science, 378, abj3043, doi: 10.1126/science.abj3043
Bailes, M. 2022, Science, 378, abj3043, doi: 10.1126/science.abj3043
-
[4]
V., van Leeuwen, J., Maan, Y., et al
Bilous, A. V., van Leeuwen, J., Maan, Y., et al. 2025, A&A, 696, A194, doi: 10.1051/0004-6361/202451413
-
[5]
Bochenek, C. D., Ravi, V., Belov, K. V., et al. 2020, Nature, 587, 59, doi: 10.1038/s41586-020-2872-x
-
[6]
2024, Nature, 632, 1014, doi: 10.1038/s41586-024-07782-6
Bruni, G., Piro, L., Yang, Y.-P., et al. 2024, Nature, 632, 1014, doi: 10.1038/s41586-024-07782-6
-
[7]
Bruni, G., Piro, L., Yang, Y. P., et al. 2025, A&A, 695, L12, doi: 10.1051/0004-6361/202453233
-
[8]
Chatterjee, S., Law, C. J., Wharton, R. S., et al. 2017, Nature, 541, 58, doi: 10.1038/nature20797 CHIME/FRB Collaboration, Amiri, M., Bandura, K., et al. 2018, ApJ, 863, 48, doi: 10.3847/1538-4357/aad188 CHIME/FRB Collaboration, Andersen, B. C., Bandura, K. M., et al. 2020a, Nature, 587, 54, doi: 10.1038/s41586-020-2863-y CHIME/FRB Collaboration, Amiri, ...
-
[9]
2025, Nature Astronomy, 9, 1226, doi: 10.1038/s41550-025-02566-y
Connor, L., Ravi, V., Sharma, K., et al. 2025, Nature Astronomy, 9, 1226, doi: 10.1038/s41550-025-02566-y
-
[10]
M., Shin, K., Pleunis, Z., et al
Cook, A. M., Shin, K., Pleunis, Z., et al. 2026, arXiv e-prints, arXiv:2605.08410. https://arxiv.org/abs/2605.08410
Pith/arXiv arXiv 2026
-
[11]
Cordes, J. M., & Chatterjee, S. 2019, ARA&A, 57, 417, doi: 10.1146/annurev-astro-091918-104501
-
[12]
Cui, X.-H., James, C. W., Li, D., & Zhang, C.-M. 2025, ApJ, 982, 158, doi: 10.3847/1538-4357/adbbcb
-
[13]
2021, MNRAS, 500, 3275, doi: 10.1093/mnras/staa3351
Cui, X.-H., Zhang, C.-M., Wang, S.-Q., et al. 2021, MNRAS, 500, 3275, doi: 10.1093/mnras/staa3351
-
[14]
2022, Ap&SS, 367, 66, doi: 10.1007/s10509-022-04093-y
Cui, X.-H., Zhang, C.-M., Li, D., et al. 2022, Ap&SS, 367, 66, doi: 10.1007/s10509-022-04093-y
-
[15]
Curtin, A. P., Sand, K. R., Pleunis, Z., et al. 2025, ApJ, 992, 206, doi: 10.3847/1538-4357/adf844
-
[16]
2026, ApJ, 1004, 179, doi: 10.3847/1538-4357/ae731b
Feng, Y., Zhou, D., Zhang, Y., et al. 2026, ApJ, 1004, 179, doi: 10.3847/1538-4357/ae731b
-
[17]
2022, Science, 375, 1266, doi: 10.1126/science.abl7759
Feng, Y., Li, D., Yang, Y.-P., et al. 2022, Science, 375, 1266, doi: 10.1126/science.abl7759
-
[18]
Fonseca, E., Andersen, B. C., Bhardwaj, M., et al. 2020, ApJL, 891, L6, doi: 10.3847/2041-8213/ab7208
-
[19]
Frail, D. A., Goss, W. M., & Whiteoak, J. B. Z. 1994, ApJ, 437, 781, doi: 10.1086/175038
doi:10.1086/175038 1994
-
[20]
Frank, J., King, A., & Raine, D. J. 2002, Accretion Power in Astrophysics: Third Edition FRB Collaboration, Abbott, T., Andersen, B. C., et al. 2026, arXiv e-prints, arXiv:2601.09399, doi: 10.48550/arXiv.2601.09399
-
[21]
W., Connor, L., van Leeuwen, J., Oostrum, L
Gardenier, D. W., Connor, L., van Leeuwen, J., Oostrum, L. C., & Petroff, E. 2021, A&A, 647, A30, doi: 10.1051/0004-6361/202039626
-
[22]
2024, A&A, 692, A170, doi: 10.1051/0004-6361/202450740
Iraci, F., Chalumeau, A., Tiburzi, C., et al. 2024, A&A, 692, A170, doi: 10.1051/0004-6361/202450740
-
[23]
James, C. W., Prochaska, J. X., Macquart, J. P., et al. 2022, MNRAS, 509, 4775, doi: 10.1093/mnras/stab3051
-
[24]
2017, ApJ, 837, 84, doi: 10.3847/1538-4357/aa618e
Janka, H.-T. 2017, ApJ, 837, 84, doi: 10.3847/1538-4357/aa618e
-
[25]
Kumar, P., Luo, R., Price, D. C., et al. 2023, MNRAS, 526, 3652, doi: 10.1093/mnras/stad2969
-
[26]
Kuzmin, A., Losovsky, B. Y., Jordan, C. A., & Smith, F. G. 2008, A&A, 483, 13, doi: 10.1051/0004-6361:20079211
-
[27]
2024, ApJL, 967, L44, doi: 10.3847/2041-8213/ad4ae8
Lan, H.-T., Zhao, Z.-Y., Wei, Y.-J., & Wang, F.-Y. 2024, ApJL, 967, L44, doi: 10.3847/2041-8213/ad4ae8
-
[28]
2018, IEEE Microwave Magazine, 19, 112, doi: 10.1109/MMM.2018.2802178
Li, D., Wang, P., Qian, L., et al. 2018, IEEE Microwave Magazine, 19, 112, doi: 10.1109/MMM.2018.2802178
-
[29]
Li, D., Wang, P., Zhu, W. W., et al. 2021, Nature, 598, 267, doi: 10.1038/s41586-021-03878-5
-
[30]
Li, Y., Zhang, S. B., Yang, Y. P., et al. 2026, Science, 391, 280, doi: 10.1126/science.adq3225
-
[31]
2024, ApJ, 975, 75, doi: 10.3847/1538-4357/ad779d
Lin, H.-H., Scholz, P., Ng, C., et al. 2024, ApJ, 975, 75, doi: 10.3847/1538-4357/ad779d
-
[32]
2012, Handbook of Pulsar Astronomy
Lorimer, D., & Kramer, M. 2012, Handbook of Pulsar Astronomy
2012
-
[33]
Lorimer, D. R., Bailes, M., McLaughlin, M. A., Narkevic, D. J., & Crawford, F. 2007, Science, 318, 777, doi: 10.1126/science.1147532
-
[34]
Luo, R., Lee, K., Lorimer, D. R., & Zhang, B. 2018, MNRAS, 481, 2320, doi: 10.1093/mnras/sty2364
-
[35]
Macquart, J. P., & Ekers, R. 2018, MNRAS, 480, 4211, doi: 10.1093/mnras/sty2083
-
[36]
Macquart, J. P., Prochaska, J. X., McQuinn, M., et al. 2020, Nature, 581, 391, doi: 10.1038/s41586-020-2300-2
-
[37]
McKee, C. F., & Truelove, J. K. 1995, PhR, 256, 157, doi: 10.1016/0370-1573(94)00106-D
-
[38]
McKee, J. W., Lyne, A. G., Stappers, B. W., Bassa, C. G., & Jordan, C. A. 2018, MNRAS, 479, 4216, doi: 10.1093/mnras/sty1727
-
[39]
Michilli, D., Seymour, A., Hessels, J. W. T., et al. 2018, Nature, 553, 182, doi: 10.1038/nature25149
-
[40]
Moroianu, A. M., Bhandari, S., Drout, M. R., et al. 2025, arXiv e-prints, arXiv:2509.05174, doi: 10.48550/arXiv.2509.05174
-
[41]
2011, International Journal of Modern Physics D, 20, 989, doi: 10.1142/S0218271811019335
Nan, R., Li, D., Jin, C., et al. 2011, International Journal of Modern Physics D, 20, 989, doi: 10.1142/S0218271811019335
-
[42]
H., Aggarwal, K., Li, D., et al
Niu, C. H., Aggarwal, K., Li, D., et al. 2022, Nature, 606, 873, doi: 10.1038/s41586-022-04755-5 15
-
[43]
2025, Science Bulletin, doi: https://doi.org/10.1016/j.scib.2025.11.023
Niu, C.-H., Li, D., Yang, Y.-P., et al. 2025, Science Bulletin, doi: https://doi.org/10.1016/j.scib.2025.11.023
-
[44]
C., Maan, Y., van Leeuwen, J., et al
Oostrum, L. C., Maan, Y., van Leeuwen, J., et al. 2020, A&A, 635, A61, doi: 10.1051/0004-6361/201937422
-
[45]
2026, ApJL, 1000, L53, doi: 10.3847/2041-8213/ae52f8
Pandhi, A., Nimmo, K., Andrew, S., et al. 2026, ApJL, 1000, L53, doi: 10.3847/2041-8213/ae52f8
-
[46]
Petroff, E., Hessels, J. W. T., & Lorimer, D. R. 2022, A&A Rv, 30, 2, doi: 10.1007/s00159-022-00139-w
-
[47]
Shannon, R. M. 2013, MNRAS, 435, 1610, doi: 10.1093/mnras/stt1401
-
[48]
Piro, A. L., & Gaensler, B. M. 2018, ApJ, 861, 150, doi: 10.3847/1538-4357/aac9bc
-
[49]
Rajwade, K. M., Mickaliger, M. B., Stappers, B. W., et al. 2020, MNRAS, 495, 3551, doi: 10.1093/mnras/staa1237
-
[50]
Ravi, V., Law, C. J., Li, D., et al. 2022, MNRAS, 513, 982, doi: 10.1093/mnras/stac465
-
[51]
Sedov, L. I. 1946, Journal of Applied Mathematics and Mechanics, 10, 241
1946
-
[52]
2017, ApJ, 849, 87, doi: 10.3847/1538-4357/aa932c
Shang, L.-H., Zhang, C.-M., Li, D., et al. 2017, ApJ, 849, 87, doi: 10.3847/1538-4357/aa932c
-
[53]
Snelders, M. P., Hessels, J. W. T., Huang, J., et al. 2025, arXiv e-prints, arXiv:2510.11352, doi: 10.48550/arXiv.2510.11352
-
[54]
M., Connor, L., & van Leeuwen, J
Straal, S. M., Connor, L., & van Leeuwen, J. 2020, A&A, 634, A105, doi: 10.1051/0004-6361/201833376
-
[55]
1950, Proceedings of the Royal Society of London Series A, 201, 159, doi: 10.1098/rspa.1950.0049
Taylor, G. 1950, Proceedings of the Royal Society of London Series A, 201, 159, doi: 10.1098/rspa.1950.0049
-
[56]
Uttarkar, P. A., Shannon, R. M., Gourdji, K., et al. 2026, MNRAS, 545, staf1997, doi: 10.1093/mnras/staf1997
-
[57]
Wang, F. Y., Zhang, G. Q., Dai, Z. G., & Cheng, K. S. 2022, Nature Communications, 13, 4382, doi: 10.1038/s41467-022-31923-y
-
[58]
Wang, P., Zhang, J. S., Yang, Y. P., et al. 2025, arXiv e-prints, arXiv:2507.15790, doi: 10.48550/arXiv.2507.15790
-
[59]
2024, A&A, 690, A377, doi: 10.1051/0004-6361/202450673
Wang, Y., & van Leeuwen, J. 2024, A&A, 690, A377, doi: 10.1051/0004-6361/202450673
-
[60]
2023, MNRAS, 524, 569, doi: 10.1093/mnras/stad1922
Wang, Y.-B., Kurban, A., Zhou, X., Yu, Y.-W., & Wang, N. 2023, MNRAS, 524, 569, doi: 10.1093/mnras/stad1922
-
[61]
Xu, H., Niu, J. R., Chen, P., et al. 2022, Nature, 609, 685, doi: 10.1038/s41586-022-05071-8
-
[62]
2017, ApJ, 847, 22, doi: 10.3847/1538-4357/aa8721
Yang, Y.-P., & Zhang, B. 2017, ApJ, 847, 22, doi: 10.3847/1538-4357/aa8721
-
[63]
Yao, J. M., Manchester, R. N., & Wang, N. 2017, ApJ, 835, 29, doi: 10.3847/1538-4357/835/1/29
-
[64]
2023, Reviews of Modern Physics, 95, 035005, doi: 10.1103/RevModPhys.95.035005
Zhang, B. 2023, Reviews of Modern Physics, 95, 035005, doi: 10.1103/RevModPhys.95.035005
-
[65]
2026, ApJ, 996, 4, doi: 10.3847/1538-4357/ae20f6
Zhang, J.-h., Niu, C.-H., Zhu, Y.-h., et al. 2026, ApJ, 996, 4, doi: 10.3847/1538-4357/ae20f6
-
[66]
2025, arXiv e-prints, arXiv:2507.14707, doi: 10.48550/arXiv.2507.14707
Zhang, J.-S., Wang, T.-C., Wang, P., et al. 2025, arXiv e-prints, arXiv:2507.14707, doi: 10.48550/arXiv.2507.14707
-
[67]
2022, Research in Astronomy and Astrophysics, 22, 124002, doi: 10.1088/1674-4527/ac98f7
Zhang, Y.-K., Wang, P., Feng, Y., et al. 2022, Research in Astronomy and Astrophysics, 22, 124002, doi: 10.1088/1674-4527/ac98f7
-
[68]
2023, ApJ, 955, 142, doi: 10.3847/1538-4357/aced0b
Zhang, Y.-K., Li, D., Zhang, B., et al. 2023, ApJ, 955, 142, doi: 10.3847/1538-4357/aced0b
discussion (0)
Sign in with ORCID, Apple, or X to comment. Anyone can read and Pith papers without signing in.