On the Importance of demand Consolidation in Mobility on Demand
Pith reviewed 2026-05-25 01:41 UTC · model grok-4.3
The pith
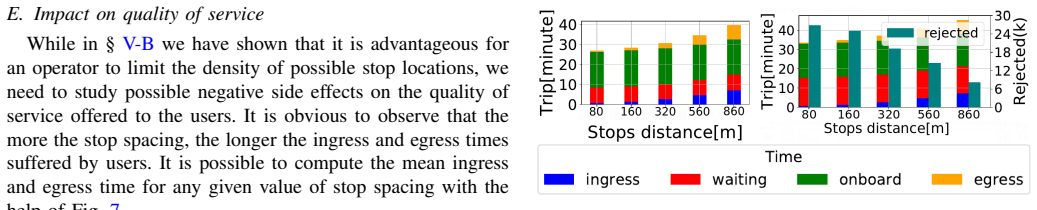
Lower stop density in Mobility on Demand systems increases the number of passengers served while reducing quality of service.
A machine-rendered reading of the paper's core claim, the machinery that carries it, and where it could break.
Core claim
By treating the density of admitted stop locations as a system parameter, the model shows that lower density consolidates demand and thereby increases the number of passengers the fleet can serve, whereas higher density improves quality-of-service metrics such as reduced walking distance and waiting time.
What carries the argument
The density of admitted stop locations, which controls the degree of demand consolidation at pick-up and drop-off points.
If this is right
- The same fleet can handle a larger passenger volume when stops are fewer.
- Quality-of-service metrics improve monotonically as stop density rises.
- The service can reconfigure its stop set on the fly to favor capacity during peak demand or quality of service during low demand.
Where Pith is reading between the lines
- Network planners could pre-compute stop-density schedules for different times of day to match expected demand.
- User acceptance of walking distance would need measurement across city types before scaling the approach.
Load-bearing premise
Users will walk to and from the limited stops and continue using the service rather than reject rides or switch modes.
What would settle it
A field trial or simulation run that records the fraction of trip requests rejected when stop density falls below a threshold, checking whether capacity gains are offset by lost demand.
Figures




read the original abstract
Mobility on Demand (MoD) services, like Uber and Lyft, are revolutionizing the way people move in cities around the world and are often considered a convenient alternative to public transit, since they offer higher Quality of Service (QoS - less waiting time, door-to-door service) at a cheap price. In the next decades, these advantages are expected to be further amplified by Automated MoD (AMoD), in which drivers will be replaced by automated vehicles, with a big gain in terms of cost-efficiency. MoD is usually intended as a door-to-door service. However, there has been recent interest toward consolidating, e.g., aggregating, the travel demand by limiting the number of admitted stop locations. This implies users have to walk from/to their intended origin/destination. The contribution of this paper is a systematic study the impact of consolidation on the operator cost and on user QoS. We introduce a MoD system where pick-ups and drop-offs can only occur in a limited subset of admitted stop locations. The density of such locations is a system parameter: the less the density, the more the user demand is consolidated. We show that, by decreasing stop density, we can increase system capacity (number of passengers we are able to serve). On the contrary, increasing it, we can improve QoS. The system is tested in AMoDSim, an open-source simulator. The code to reproduce the results presented here is available on-line. This work is a first step toward flexible mobility services that are able to autonomously re-configure themselves, favoring capacity or QoS, depending on the amount of travel demand coming from users. In other words, the services we envisage in this work shift their operational mode to any intermediate point in the range from a taxi-like door-to-door service to a bus-like service, with few served stops and more passengers on-board.
Editorial analysis
A structured set of objections, weighed in public.
Referee Report
Summary. The paper claims that in automated Mobility on Demand (AMoD) systems, decreasing the density of admitted stop locations consolidates demand and increases system capacity (number of passengers served), while increasing stop density improves user Quality of Service (QoS). This trade-off is demonstrated via simulations in the open-source AMoDSim simulator, with code provided for reproducibility; the work frames the approach as enabling flexible services that can reconfigure between taxi-like door-to-door and bus-like operations.
Significance. If the reported trade-off holds, the work would be significant for designing adaptive MoD systems that balance capacity and QoS based on demand levels. A clear strength is the open-source release of the simulator and reproduction code, which supports verification and extension by the community.
major comments (1)
- [System model and contribution] System model paragraph (abstract and contribution section): the simulation generates the capacity-vs-density curves under the assumption that every request is served after walking to the nearest admitted stop, with demand treated as fully inelastic to walking distance and no rejection or mode-shift mechanism present. This assumption is load-bearing for the headline result that lower stop density raises served passengers, as even modest user rejection when walking exceeds a few hundred meters would reduce effective arrival rates at stops and eliminate the reported capacity gains.
minor comments (1)
- The abstract and results sections would benefit from explicit definitions of the capacity and QoS metrics (e.g., exact formulas or thresholds for served passengers and waiting time) to allow direct comparison with other MoD studies.
Simulated Author's Rebuttal
We thank the referee for the thoughtful review and for identifying a key modeling assumption in our work. We address the comment below.
read point-by-point responses
-
Referee: [System model and contribution] System model paragraph (abstract and contribution section): the simulation generates the capacity-vs-density curves under the assumption that every request is served after walking to the nearest admitted stop, with demand treated as fully inelastic to walking distance and no rejection or mode-shift mechanism present. This assumption is load-bearing for the headline result that lower stop density raises served passengers, as even modest user rejection when walking exceeds a few hundred meters would reduce effective arrival rates at stops and eliminate the reported capacity gains.
Authors: We agree that the inelastic-demand assumption is central to the reported capacity increases. The model deliberately isolates the operator-side effect of consolidation by assuming all users walk to the nearest admitted stop, allowing us to quantify the potential capacity-QoS trade-off under full compliance. This framing is consistent with the paper's goal of exploring tunable operation between taxi-like and bus-like regimes. However, we recognize that real-world user rejection or mode shift for longer walks could attenuate or eliminate the capacity gains. In the revised version we will add an explicit limitations paragraph (in Section 5 or a new subsection) that states this assumption, notes its load-bearing role, and identifies incorporation of elastic demand and rejection thresholds as an important direction for future work. revision: yes
Circularity Check
No circularity: results are direct simulation outputs with stop density as explicit input
full rationale
The paper reports simulation experiments in AMoDSim where stop density is an independent input parameter and capacity/QoS metrics are measured outputs. No equations, fitted parameters, or self-citations reduce the reported trade-off to the inputs by construction. The analysis is empirical within the model and self-contained against external benchmarks.
Axiom & Free-Parameter Ledger
free parameters (1)
- stop density
axioms (1)
- domain assumption Users will walk to and from admitted stops without rejecting the service
Reference graph
Works this paper leans on
-
[1]
The Perfect uberPOOL: A Case Study on Trade-Offs,
J. Lo and S. Morseman, “The Perfect uberPOOL: A Case Study on Trade-Offs,” in Ethnographic Praxis in Industry Conf. , 2018
work page 2018
-
[2]
Uber Express Pool Offers the Cheapest Fares Yet in Exchange for a Little Walking,
A. J. Hawkins, “Uber Express Pool Offers the Cheapest Fares Yet in Exchange for a Little Walking,” 2018
work page 2018
-
[3]
L. Quadrifoglio and X. Li, “A methodology to derive the critical demand density for designing and operating feeder transit services,” Transportation Research Part B, vol. 43, no. 10, pp. 922–935, 2009
work page 2009
-
[4]
Stochastic dynamic switching in fixed and flexible transit services as market entry-exit real options,
Q. W. Guo, J. Y . Chow, and P. Schonfeld, “Stochastic dynamic switching in fixed and flexible transit services as market entry-exit real options,” Transportation Research Part C, vol. 94, pp. 288–306, 2018
work page 2018
-
[5]
K. Koh, C. Ng, and D. Pan, “Dynamic Bus Routing : A study on the viability of on-demand high-capacity ridesharing as an alternative to fixed-route buses in Singapore,” IEEE ITSC, 2018
work page 2018
-
[6]
A model for estimating the optimal cy- cle length of demand responsive feeder transit services,
S. Chandra and L. Quadrifoglio, “A model for estimating the optimal cy- cle length of demand responsive feeder transit services,” Transportation Research Part B: Methodological , vol. 51, pp. 1–16, 2013
work page 2013
-
[7]
AMoDSim: An Efficient and Modular Simulation Framework for Autonomous Mobility on Demand,
A. Di Maria, A. Araldo, G. Morana, and A. Di Stefano, “AMoDSim: An Efficient and Modular Simulation Framework for Autonomous Mobility on Demand,” in Internet of Vehicles Conference , 2018
work page 2018
-
[8]
R. Basu, A. Araldo, and et Al., Automated Mobility-on-Demand vs. Mass Transit: A Multi-Modal Activity-Driven Agent-Based Simulation Approach, 2018
work page 2018
-
[9]
A Hybrid Tabu Search and Constraint Programming Algorithm for the Dynamic Dial-a-Ride Problem,
G. Berbeglia, J.-F. Cordeau, and G. Laporte, “A Hybrid Tabu Search and Constraint Programming Algorithm for the Dynamic Dial-a-Ride Problem,” INFORMS Journal on Computing , vol. 24, no. 3, pp. 343– 355, 2012
work page 2012
-
[10]
A. A. N ´u˜nez, D. A. S ´aez, and C. E. Cort ´es, Hybrid Predictive Control for Dynamic Transport Problems , 2013
work page 2013
-
[11]
K. Winter, O. Cats, G. H. d. A. Correia, and B. van Arem, “Designing an Automated Demand-Responsive Transport System: Fleet Size and Per- formance Analysis for a CampusTrain Station Service,” Transportation Research Record, vol. 2542, no. 1, pp. 75–83, 2016
work page 2016
-
[12]
On-demand high-capacity ride-sharing via dynamic trip-vehicle assign- ment,
J. Alonso-mora, S. Samaranayake, A. Wallar, E. Frazzoli, and D. Rus, “On-demand high-capacity ride-sharing via dynamic trip-vehicle assign- ment,” Proceedings of the National Academy of Sciences of the United States of America , vol. 114, no. 3, pp. 462–467, 2017
work page 2017
-
[13]
D. Watel and A. Faye, “Taxi-sharing: Parameterized complexity and approximability of the dial-a-ride problem with money as an incentive,” Theoretical Computer Science , vol. 745, pp. 202–223, 2018
work page 2018
-
[14]
Cost- based analysis of autonomous mobility services,
P. M. B ¨osch, F. Becker, H. Becker, and K. W. Axhausen, “Cost- based analysis of autonomous mobility services,” Transportation Policy, vol. 64, pp. 76–91, 2018
work page 2018
-
[15]
Scheduling Dial-a-Ride Transportation Systems,
D. M. Stein, “Scheduling Dial-a-Ride Transportation Systems,” Trans- portation Science, vol. 12, no. 3, pp. 232–249, 1978
work page 1978
-
[16]
The benefits of meeting points in ride-sharing systems,
M. Stiglic, N. Agatz, M. Savelsbergh, and M. Gradisar, “The benefits of meeting points in ride-sharing systems,” Trans. Res. Part B , 2015
work page 2015
-
[17]
Dynamic pickup and delivery problems,
G. Berbeglia, J. F. Cordeau, and G. Laporte, “Dynamic pickup and delivery problems,” European Journal of Operational Research , vol. 202, no. 1, pp. 8–15, 2010
work page 2010
-
[18]
Effects of Bus Stop Consolidation on Passenger Activity and Transit Operations,
A. EI-Geneidy, J. Strathman, T. Kimpel, and D. Crout, “Effects of Bus Stop Consolidation on Passenger Activity and Transit Operations,” in Transportation Research Board, 2005
work page 2005
-
[19]
CityLines: Designing Hybrid Hub-and-Spoke Transit System with Urban Big Data,
Y . Li, G. Liu, Z.-L. Zhang, J. Luo, and F. Zhang, “CityLines: Designing Hybrid Hub-and-Spoke Transit System with Urban Big Data,” IEEE Transactions on Big Data , pp. 1–1, 2018
work page 2018
-
[20]
M. Hyland and H. Mahmassani, “Dynamic Autonomous Vehicle Fleet Operations: Optimization-Based Strategies to Assign A Vs to Immediate Traveler Demand Requests,” Trans. Res. Part C , vol. 92, 2018
work page 2018
-
[21]
Design and Modeling of Real- time Shared-Taxi Dispatch Algorithms,
J. Jung, R. Jayakrishnan, and J. Y . Park, “Design and Modeling of Real- time Shared-Taxi Dispatch Algorithms,” in TRB Annual Meeting , 2013
work page 2013
-
[22]
Transportation Terms: Dwell Time,
J. Elpern-Waxman, “Transportation Terms: Dwell Time,” 2017
work page 2017
discussion (0)
Sign in with ORCID, Apple, or X to comment. Anyone can read and Pith papers without signing in.