REVIEW 6 major objections 4 minor 30 references
Cooperative Causal GraphSAGE
T0 review · 6 major / 4 minor · reviewed 2026-08-07 · deepseek-v4-flash
Pith's one-line read A graph sampling scheme that combines causal effects with Shapley values to weight neighbor coalitions, improving robustness of GraphSAGE under feature perturbation.
desk verdict New combination of Shapley values and causal sampling for GraphSAGE, with promising robustness results, but the core sampling weight is not actually defined in the paper. read the letter →
The pith
A machine-rendered reading of the paper's core claim, the machinery that carries it, and where it could break.
The reading
Extended reading notes
Core claim
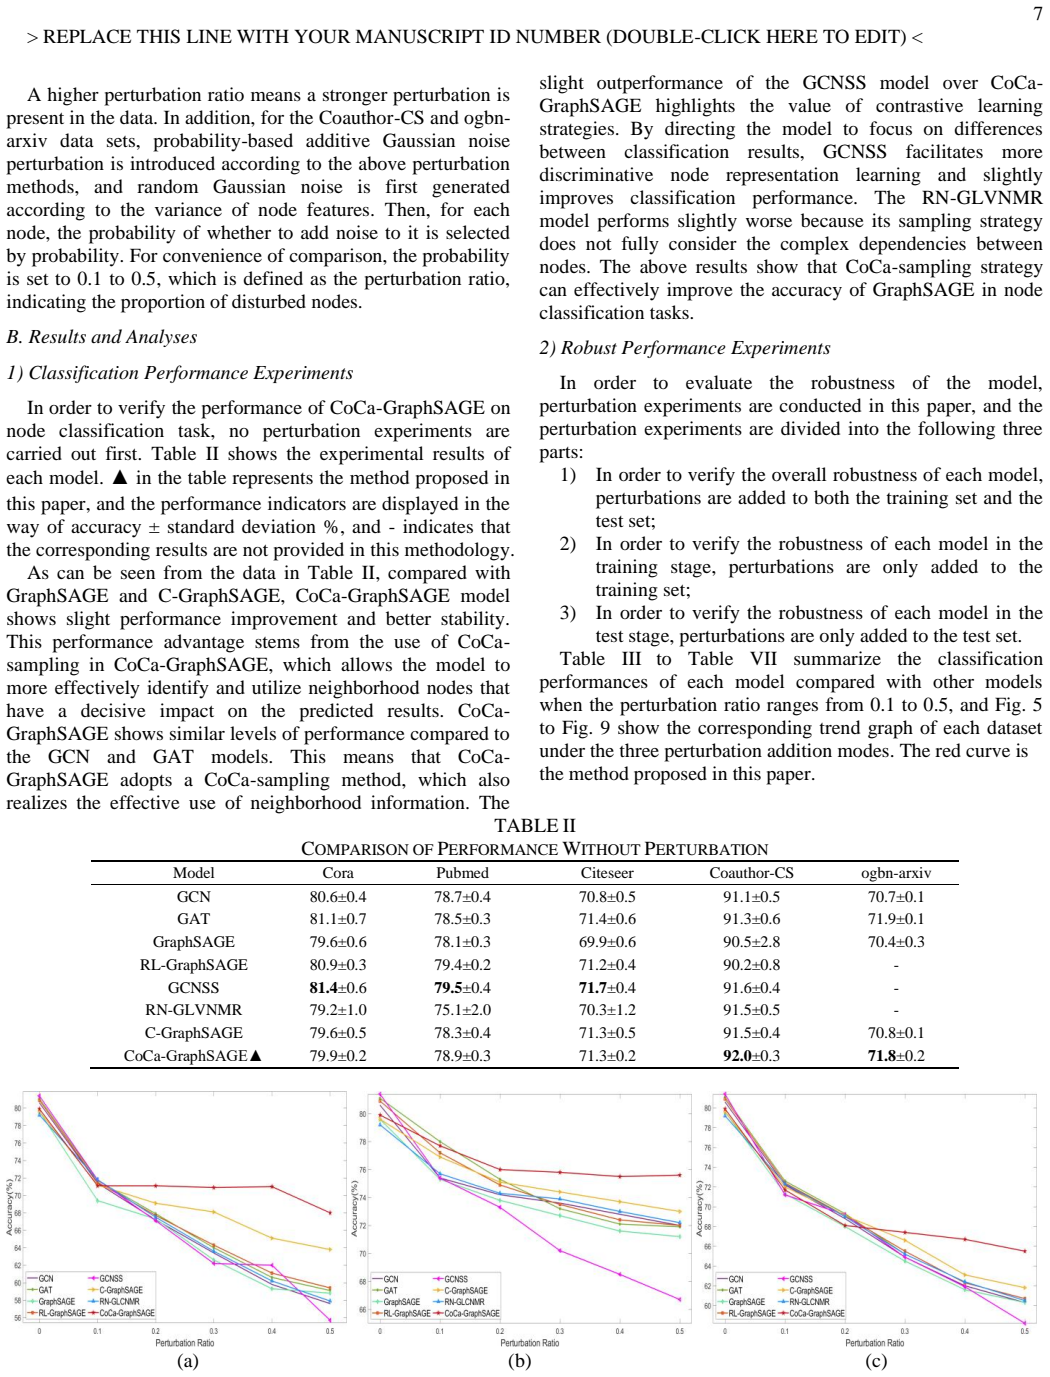
The CoCa-sampling algorithm, which uses Shapley values over cooperative coalitions of neighborhood nodes to weight causal sampling, improves the robustness of GraphSAGE under feature perturbation while maintaining comparable clean accuracy. This is stated in the abstract: 'Experiments on publicly available datasets show that the proposed method has comparable classification performance to the compared methods and outperforms under perturbations, demonstrating the robustness improvement by CoCa-sampling.'
Load-bearing premise
The cooperative causal structure model assumes that the causal path from a neighbor node v_t to the central label y_r is confounded only by the coalition set S_r, so that conditioning on S_r satisfies the backdoor criterion and p̂(y_r | do(v_t)) is identified by p̂(y_r | v_t, S_r). This is asserted in Section III-C where they write 'this path meets the backdoor criterion.' If unobserved confounders exist, the computed cooperative causal weights are biased and the sampling is not genuinely causal.
Signed reviews
Editorial analysis
A structured set of objections, weighed in public.
Referee Report
Summary. The paper proposes Cooperative Causal GraphSAGE (CoCa-GraphSAGE), which combines cooperative game theory (Shapley values) with Causal GraphSAGE to define a new neighborhood sampling rule, CoCa-sampling. The authors construct a cooperative causal structure model, compute cooperative causal weights for candidate neighbors via a Shapley-like formula, and use these weights to sample neighbors before mean aggregation. Experiments on five node classification datasets report accuracy comparable to baselines without perturbation and improved accuracy under feature perturbation, which is attributed to the robustness of CoCa-sampling.
Significance. If the method were precisely specified and reproducible, the idea of accounting for cooperative interactions among neighborhood nodes during causal sampling would be a plausible and interesting extension of Causal GraphSAGE. The reported robustness gains, e.g., roughly 5–10 percentage points over C-GraphSAGE at high perturbation ratios, are substantial and would be of practical value. However, the current manuscript does not define the core sampling algorithm in an implementable way: key quantities are undefined, the equations are internally inconsistent, and the empirical comparisons are not fully controlled. The contribution is therefore conditional on a substantial rewrite of Sections III-C and IV, plus release of code or an unambiguous algorithmic specification.
major comments (6)
- [Section III-C, Eqs. (5)–(8)] The quantity T appears in the factorial coefficient ((M-1)!(T-M)! / T!) in Eq. (5) and in Q_T^M in Eq. (8), but T is never defined anywhere in the manuscript. If T is intended to be the neighborhood size |N(v_r)| or the total number of players in the cooperative game, this must be stated explicitly and used consistently; otherwise Eq. (5) is not an implementable algorithm.
- [Section III-C, Eq. (6)] The unexplained multiplicative factor M in the second term of Eq. (6) (and later absorbed into Q_T^M in Eq. (8)) does not follow from the standard Shapley value formula, whose weights are |S|!(n-|S|-1)!/n! for a coalition of size |S|. The authors should justify why only coalitions of size M-1 are considered and why the weight includes an extra factor of M; as written, the formula is not derived from Eq. (2) or Eq. (4).
- [Section III-C, Eq. (7) and Algorithm 1] The object summed in Eq. (7), p̂(y_r | v_t, S_r) - p̂(y_r | S_r), does not match the marginal contribution φ(S_r) defined in Eq. (4), which is the difference between causal weights with and without v_t in the coalition. Consequently, the cooperative causal weight E(v_t) computed in Algorithm 1, line 6, is ill-defined, and the reported sampling rule cannot be reproduced from the equations given.
- [Section III-C, Eq. (3) and text after Eq. (3)] The paper states that p̂ denotes a kernel density estimate, but no kernel, bandwidth, or estimation procedure is provided. Since all cooperative causal weights in Eqs. (5)–(7) depend on p̂(y_r | v_t, S_r), the method cannot be implemented or evaluated by others without this information; please specify the estimator and any hyperparameters (e.g., bandwidth selection) used in the experiments.
- [Section III-C, backdoor criterion] The assertion that the path v_t ← S_r → y_r 'meets the backdoor criterion' presupposes that the coalition set S_r contains all confounders of v_t and y_r. This is a strong structural assumption that is not justified by the graph in Fig. 3. If unobserved confounders exist, the quantity estimated by Eq. (3) is a conditional association, not a causal effect, and the claim that the sampling is 'genuinely causal' would not hold. The authors should state this assumption explicitly and discuss its plausibility for the datasets used.
- [Section IV-A and Tables III–VII] The empirical comparison is not fully controlled: C-GraphSAGE is run with sampling numbers (25, 10) for its two layers, whereas CoCa-GraphSAGE uses (10, 10), so the robustness differences could partly reflect the number of samples rather than the sampling rule. Moreover, no code or data splits are provided, and no statistical significance tests are reported. Given that the central claim is empirical robustness improvement, the paper should include these details or release code to allow verification.
minor comments (4)
- [Section IV-A, Table I] The statistics of the Coauthor-CS and ogbn-arxiv datasets are missing from Table I; the table only lists Cora, Citeseer, and Pubmed, even though five datasets are used.
- [Section IV-A, Tables VI and VII] The results for RL-GraphSAGE, GCNSS, and RN-GLVNMR are omitted for Coauthor-CS and ogbn-arxiv, so the comparison on those datasets is incomplete relative to the other three datasets.
- [Section III-C] There are typos and garbled equations throughout the section (e.g., 'Shapely' instead of 'Shapley', and the OCR of Eqs. (3)–(7) appears corrupted); the authors should carefully proofread the manuscript and ensure all equations are typeset correctly.
- [Section IV-A, perturbation description] The description of Bernoulli-matrix XOR perturbation for the citation datasets is too brief; please specify how the perturbation matrix is generated, how it interacts with the features, and what fraction of the feature entries are modified.
Circularity Check
No significant circularity: the robustness claim is an empirical result, and the cited Causal GraphSAGE formula is independently benchmarked here.
full rationale
The claimed derivation chain is: construct a cooperative causal graph (Section III-B); compute coalition causal weights with Eq. (3); form Shapley-style marginal contributions via Eqs. (4)-(8); sample neighborhoods in Algorithm 1; aggregate with Eq. (9); train with Eq. (11). The final claim is an experimental one: CoCa-GraphSAGE 'outperforms under perturbations,' and it is supported by reported test accuracies in Tables II-VII against GCN, GAT, GraphSAGE, C-GraphSAGE, and others. No equation in this chain defines the predicted accuracy to be equal to the fitted p-hat or to a cooperative causal weight; the weights are intermediate quantities used for sampling, and accuracy is an independent evaluation metric. The only self-citation is reference [13] (Causal GraphSAGE), co-authored by T. Zhang, which supplies Eq. (1) as the base causal weight; however, C-GraphSAGE is also re-run as a baseline in the present experiments, so the citation is not the sole evidence for the method's behavior. The paper's real weaknesses are non-circular: T is never defined in Eqs. (5)-(8), the factor M and the set S_r^- are unexplained, the kernel density estimator for p-hat is unspecified, and the assertion that the path 'meets the backdoor criterion' is an unproven modeling assumption. These are correctness and reproducibility risks, not a reduction of the output to the input by construction.
Assumptions & free parameters
free parameters (2)
- M (sampling number per layer) =
10, 10 (first and second layer)
- Kernel density estimate bandwidth
assumptions (3)
- domain assumption Backdoor criterion holds for the cooperative causal graph in Fig. 3.
- ad hoc to paper Fixed-size Shapley value over coalitions of size M-1 is a valid measure of cooperative contribution.
- domain assumption Kernel density estimates p̂ are unbiased estimates of the causal conditional probabilities.
invented entities (1)
-
Cooperative causal weight E(v_t)
Cite this review
Pith. "Pith review of Cooperative Causal GraphSAGE." pith.science (2026). https://pith.science/paper/BJWCXAQK
@misc{pith2026250514748,
  author       = {Pith},
  title        = {Pith review of: Cooperative Causal GraphSAGE},
  year         = {2026},
  howpublished = {\url{https://pith.science/paper/BJWCXAQK}},
  note         = {Machine review of arXiv:2505.14748}
}
read the original abstract
GraphSAGE is a widely used graph neural network. The introduction of causal inference has improved its robust performance and named as Causal GraphSAGE. However, Causal GraphSAGE focuses on measuring causal weighting among individual nodes, but neglecting the cooperative relationships among sampling nodes as a whole. To address this issue, this paper proposes Cooperative Causal GraphSAGE (CoCa-GraphSAGE), which combines cooperative game theory with Causal GraphSAGE. Initially, a cooperative causal structure model is constructed in the case of cooperation based on the graph structure. Subsequently, Cooperative Causal sampling (CoCa-sampling) algorithm is proposed, employing the Shapley values to calculate the cooperative contribution based on causal weights of the nodes sets. CoCa-sampling guides the selection of nodes with significant cooperative causal effects during the neighborhood sampling process, thus integrating the selected neighborhood features under cooperative relationships, which takes the sampled nodes as a whole and generates more stable target node embeddings. Experiments on publicly available datasets show that the proposed method has comparable classification performance to the compared methods and outperforms under perturbations, demonstrating the robustness improvement by CoCa-sampling.
Figures


Figures from the paper (3 more)


Reference graph
Works this paper leans on
-
[1]
Deep graph learning for anomalous citation detection,
J. Liu, F. Xia, X. Feng, J. Ren, and H. Liu, “Deep graph learning for anomalous citation detection,” IEEE Trans. Neural Netw. Learn. Syst. , vol. 33, no. 6, pp. 2543–2557, Jun. 2022
work page 2022
-
[2]
Harnessing the Power of Ego Network Layers for Link Prediction in Online Social Networks,
M. Toprak, C. Boldrini, A. Passarella, and M. Conti, “Harnessing the Power of Ego Network Layers for Link Prediction in Online Social Networks,” IEEE Trans . Comput. Soc. Syst. , vol. 10, no. 1, pp. 48 –60, Feb. 2023
work page 2023
-
[3]
Attribute graph neural networks for strict cold start recommendation,
T. Qian, Y. Liang, Q. Li, and H. Xiong, “Attribute graph neural networks for strict cold start recommendation,” IEEE Trans. Knowl. Data Eng., vol. 34, no. 8, pp. 3597–3610, Aug. 2022
work page 2022
-
[4]
FP -GNN: A versatile deep learning architecture for enhanced molecular property prediction,
H. Cai, H. Zhang, D. Zhao, J. Wu, and L. Wang, “FP -GNN: A versatile deep learning architecture for enhanced molecular property prediction,” Brief. Bioinform., vol. 23, no. 6, Nov. 2022, doi: 10.1093/bib/bbac408
-
[5]
Inductive representation learning on large graphs,
W. L. Hamilton, Z. Ying, and J. Leskovec, “Inductive representation learning on large graphs,” in Proc. 31th Conf. Neural Inf. Process. Syst. , Long Beach, CA, USA, Dec. 2017, pp. 1025–1035
work page 2017
-
[6]
FastGCN: Fast learning with graph convolutional networks via importance sampling,
J. Chen, T. Ma, and C. Xiao, “FastGCN: Fast learning with graph convolutional networks via importance sampling,” in Proc. 6th Int. Conf. Learn. Represent., Vancouver, BC, Canada, Feb. 2018, pp. 1–15
work page 2018
-
[7]
P. Veličković, G. Cucurull, A. Casanova, A. Romero, P. Lio, and Y. Bengio, “Graph attention networks,” in Proc. 6th Int. Conf. Learn. Represent., Vancouver, BC, Canada, Apr. 2018, pp. 1–12
work page 2018
-
[8]
Advancing GraphSAGE with a data -driven node sampling,
J. Oh, K. Cho, and J. Bruna, “Advancing GraphSAGE with a data -driven node sampling,” in Proc. 7th Int. Conf. Learn. Represent. , New Orleans, LA, USA, May. 2019, pp. 1–6
work page 2019
Show all 30 references
-
[9]
A learnable sampling method for scalable graph neural networks,
W. Zhao, T. Guo, X. Yu, and C. Han. “A learnable sampling method for scalable graph neural networks,” Neural Netw. , vol. 162, pp. 412 –424, 2023
2023
-
[10]
Graph neural network with curriculum learning for imbalanced node classification,
X. Li, Z. Fan, F. Huang, X. Hu, Y. Deng, L. Wang, and X. Zhao. “Graph neural network with curriculum learning for imbalanced node classification,” Neurocomputing, vol. 574, Mar. 2024, Art. no. 127229
2024
-
[11]
A graph neural network node classification application model with enhanced node association,
Y. Zhang, Y. Xu, and Y. Zhang. “A graph neural network node classification application model with enhanced node association,” Appl. Sci., vol. 13, no. 12, pp. 7150, 2023
2023
-
[12]
A unified deep semi -supervised graph learning scheme based on nodes re -weighting and manifold regularization,
F. Dornaika, J. Bi, and C. Zhang. “A unified deep semi -supervised graph learning scheme based on nodes re -weighting and manifold regularization,” Neural Netw., vol. 158, pp. 188–196, 2023
2023
-
[13]
Causal GraphSAGE: A robust graph method for classification based on causal sampling,
T. Zhang, H. Shan, and M.A. Little. “Causal GraphSAGE: A robust graph method for classification based on causal sampling,” Pattern Recognit., vol. 128, Aug. 2022, Art. no. 108696
2022
-
[14]
CAGCN: Causal attention graph convolutional network against adversarial attacks,
Y. Lee, and S. Han. “CAGCN: Causal attention graph convolutional network against adversarial attacks,” Neurocomputing, vol. 538, Jun. 2023, Art. no. 126187
2023
-
[15]
CiGNN: A causality - informed and graph neural network based framework for cuffless continuous blood pressure estimation,
L. Liu, H. Lu, M. Whelan, Y. Chen, and X. Ding. “CiGNN: A causality - informed and graph neural network based framework for cuffless continuous blood pressure estimation,” IEEE J. of Biomed. Health Inform., vol. 28, no. 5, pp. 2674–2686, May 2024
2024
-
[16]
Causality -based CTR prediction using graph neural networks,
P. Zhai, Y. Yang, and C. Zhang. “Causality -based CTR prediction using graph neural networks,” Inf. Process. Manage., vol. 60, no. 1, Jan. 2023, Art. no. 103137
2023
-
[17]
Learning and evaluating graph neural network explanations based on counterfactual and factual reasoning,
J. Tan, S. Geng, Z. Fu, Y. Ge, S. Xu, Y. Li, and Y. Zhang. “Learning and evaluating graph neural network explanations based on counterfactual and factual reasoning,” in Proc. ACM Web Conf. 2022, New York, NY, USA, Apr. 2022, pp. 1018–1027
2022
-
[18]
A collaborative filtering recommendation algorithm based on community detection and graph neural network,
J. Sheng, Q. Liu, Z. Hou, and B. Wang. “A collaborative filtering recommendation algorithm based on community detection and graph neural network,” Neural Process. Lett. , vol. 55, pp. 7095 –7112, Apr. 13 > REPLACE THIS LINE WITH YOUR MANUSCRIPT ID NUMBER (DOUBLE -CLICK HERE TO...
2023
-
[19]
Flowx: Towards explainable graph neural networks via message flows,
S. Gui, H. Yuan, J. Wang, Q. Lao, K. Li, and S. Ji. “Flowx: Towards explainable graph neural networks via message flows,” IEEE Trans. Pattern Anal. Mach. Intell., vol.46, no. 7, pp. 4567–4578, Jul. 2024
2024
-
[20]
Core, Shapley value, nucleolus and nash bargaining solution: A Survey of recent developments and applications in operations management,
C. Luo, X. Zhou, and B. Lev. “Core, Shapley value, nucleolus and nash bargaining solution: A Survey of recent developments and applications in operations management,” Omega, vol. 110, Jul. 2022, Art. no. 102638
2022
-
[21]
Decomposition procedures for distributional analysis: a unified framework based on the Shapley value,
A.F. Shorrocks. “Decomposition procedures for distributional analysis: a unified framework based on the Shapley value,” J. Econ. Inequal., vol. 11, no. 1, pp. 99–126, 2013
2013
-
[22]
Collective explainable AI: Explaining cooperative strategies and agent contribution in multiagent reinforcement learning with Shapley values,
A. Heuillet, F. Couthouis, and N. Dí az -Rodríguez. “Collective explainable AI: Explaining cooperative strategies and agent contribution in multiagent reinforcement learning with Shapley values,” IEEE Comput. Intell. Mag., vol. 17, no. 1, pp. 59–71, Feb. 2022
2022
-
[23]
Random Shapley forests: Cooperative game -based random forests with consistency,
J. Sun, H. Yu, G. Zhong, J. Dong, S. Zhang, and H. Yu. “Random Shapley forests: Cooperative game -based random forests with consistency,” IEEE T. Cybern., vol. 52, no. 1, pp. 205–214, Jan. 2022
2022
-
[24]
Quantitatively interpreting residents happiness prediction by considering factor –factor interactions,
L. Li, X. Wu, M. Kong, J. Liu, and J. Zhang. “Quantitatively interpreting residents happiness prediction by considering factor –factor interactions,” IEEE Trans. Comput. Soc. Syst., vol. 11, no. 1, pp. 1402–1414, Feb. 2024
2024
-
[25]
A Shapley value -based approach to discover influential nodes in social networks,
R. Narayanam, and Y. Narahari. “A Shapley value -based approach to discover influential nodes in social networks,” IEEE Trans. Autom. Sci. Eng., vol. 8, no. 1, pp. 130–147, Jan. 2011
2011
-
[26]
Shapley explainer –An interpretation method for GNNs used in SDN,
C. Li, J. Lou, S. Liu, Z. Chen, and X. Yuan. “Shapley explainer –An interpretation method for GNNs used in SDN,” in GLOBECOM 2022 – 2022 IEEE Global Commun. Conf., 2022, pp. 5534–5540
2022
-
[27]
EdgeSHAPer: Bond -centric Shapley value -based explanation method for graph neural networks,
A. Mastropietro, G. Pasculli, C. Feldmann, R. Rodrí guez -Pé rez, and J. Bajorath. “EdgeSHAPer: Bond -centric Shapley value -based explanation method for graph neural networks,” iScience, vol. 25, no. 10, Oct. 2022, doi: 10.1016/j.isci.2022.105043
2022
-
[28]
Semi -supervised classification with graph convolutional networks,
T.N. Kipf and M. Welling, “Semi -supervised classification with graph convolutional networks,” in Proc. 5th Int. Conf. Learn. Represent. , Toulon, France, Apr. 2017, pp. 1–14
2017
-
[29]
Negative samples selecting strategy for graph contrastive learning,
R. Miao, Y. Yang, Y. Ma, X. Juan, H. Xue, J. Tang, Y. Wang, and X. Wang. “Negative samples selecting strategy for graph contrastive learning,” Inform. Sciences, vol. 613, pp. 667–681, Oct. 2022
2022
-
[30]
A unified deep semi -supervised graph learning scheme based on nodes re -weighting and manifold regularization,
F. Dornaika, J. Bi, and C. Zhang. “A unified deep semi -supervised graph learning scheme based on nodes re -weighting and manifold regularization,” Neural Netw., vol. 158, pp. 188–196, Jan. 2023
2023
Reviewed August 7, 2026 · model on record in the stance chip above.
Discussion (0). Continue with ORCID to comment.