REVIEW 5 major objections 7 minor 4 references
Quantifying the Social Costs of Power Outages and Restoration Disparities Across Four U.S. Hurricanes
T0 review · 5 major / 7 minor · reviewed 2026-08-05 · deepseek-v4-flash
Pith's one-line read Converting outage-days into dollar losses shows hurricane blackouts cost up to $1.5 billion per event and weigh most heavily on low-income communities.
desk verdict Useful cross-event outage-cost comparison, but the dollar figures rest on an unvalidated deprivation-cost function and underreported thresholds; worth refereeing with revisions. read the letter →
The pith
A machine-rendered reading of the paper's core claim, the machinery that carries it, and where it could break.
The reading
What carries the argument
The load-bearing object is the deprivation cost function (DCF), an empirically estimated convex mapping from outage duration to monetary welfare loss, originally estimated in a stated-preference study. It is what turns engineering outage counts into additive, comparable dollar losses. Around it are three recovery metrics: customer-weighted average outage-days (the exposure variable), restore duration (the active recovery phase), and relative restoration rate (restoration speed divided by outage accumulation speed). SHAP analysis on a Random Forest model attributes cost drivers, and K-means clustering groups ZIP codes into recovery typologies; both are secondary tools that translate the dolla
What would settle it
Re-estimate the deprivation cost curve from willingness-to-pay data collected specifically in Hurricane Ida-affected parishes and compare it to the fixed curve; or test the framework by predicting total outage losses for one of the four events and comparing against observed insurance claims, business-interruption losses, or utility compensation payouts. A systematic gap between predicted and observed dollar losses would falsify the transferability of Eq. 1.
Extended reading notes
Core claim
The central claim is that a single quadratic function, DC = 35.95·t² + 107.84·t + 71.89 with t in average outage-days per customer, converts outage exposure into a monetary deprivation cost, and that total cost equals this per-customer cost times affected customers. Combining customer-weighted outage-days computed from sequential high-frequency outage observations with ZCTA-level census demographics, the paper produces the first cross-event, fine-scale accounting of outage costs. Its central empirical results are: Ida imposed about $1.50B in total deprivation costs with $1,757 per capita; Milton $1.26B ($387 per capita); Beryl $629M ($674 per capita); and Helene $411M ($285 per capita). Acro
Load-bearing premise
The dollar numbers stand on one cost curve—DC = 35.95t² + 107.84t + 71.89—estimated in a separate survey and applied unchanged to every ZIP code in four storms; if that curve misprices a day without power for a particular population, the totals and income comparisons change, though the qualitative regressive pattern could remain.
Editorial extensions
If this is right
- Utilities can compute the social loss avoided by cutting restoration duration in a given area, turning restoration speed into a dollar-denominated investment criterion.
- Regulators can supplement SAIDI/CAIDI with a welfare-based, distribution-sensitive metric, creating a basis for equity-informed performance targets.
- Because total costs are additive dollars, event-to-event comparisons become benefit-cost inputs for resilience spending across different storms and regions.
- The consistent regressive pattern implies restoration plans that ignore income will systematically undervalue losses in low-income communities.
- Recovery typologies from clustering can direct targeted aid to high-burden, slow-recovery communities even when their aggregate outage statistics resemble better-off areas.
Reading between the lines
- The paper does not test whether the same quadratic cost curve transfers across states and income groups; re-estimating the curve on independent data for one of these events would confirm or break the dollar scale, even if the qualitative regressive pattern survives.
- Because the cost function is convex in duration, shortening the longest outages saves more social loss per day than shortening shorter ones; this suggests the equity and efficiency arguments for prioritizing the longest, low-income outages align.
- The dollar-additive design invites a natural extension to compound events: summing deprivation costs from consecutive storms (e.g., Helene followed by Milton) would quantify cumulative seasonal burden, which the paper notes but does not measure.
- The same normalization logic—restoration rate over outage rate—could be applied to water, communications, or transit interruptions if separate willingness-to-pay functions were estimated, producing comparable deprivation ledgers across infrastructure sectors.
Editorial analysis
A structured set of objections, weighed in public.
Referee Report
Summary. The paper proposes a standardized, cross-event framework for monetizing the social cost of hurricane-induced power outages. It combines EAGLE-I outage traces with ACS ZCTA demographics to compute customer-weighted average outage-days, restoration duration, and relative restoration rate for Hurricanes Beryl, Helene, Milton, and Ida. These metrics are converted into dollar 'deprivation costs' using a quadratic function DC = 35.95 t^2 + 107.84 t + 71.89 (Eq. 1), imported from the authors' companion stated-preference study (ref. [32]). The analysis reports total deprivation costs of $1.50B (Ida), $1.26B (Milton), $629M (Beryl), and $411M (Helene), with per-capita costs of $1,757, $387, $674, and $285. It then examines regressivity by income, fits DC-versus-restoration curves, runs SHAP-based random forest models, and applies K-means clustering to define recovery typologies. The paper claims these are the first cross-event, fine-scale welfare-based outage cost estimates, with restoration duration as the dominant driver and consistently regressive burdens.
Significance. If the quantitative claims are reliable, the framework would be a useful decision-support tool for equity-informed restoration prioritization and resilience investment, going beyond SAIDI/CAIDI by monetizing welfare losses at ZCTA scale. The strengths are the uniform pipeline across four events, the explicit welfare-economics framing, the use of high-frequency observational data, and the combination of explanatory modeling with unsupervised clustering. However, nearly every headline dollar figure and cross-event comparison flows through Eq. 1, a fixed-coefficient function transferred from a companion preprint without uncertainty propagation or transfer validation. The paper's own Discussion concedes that the function 'may not fully reflect variations in willingness-to-pay.' The qualitative regressive pattern may well survive even if the dollar values are treated as illustrative, but the current manuscript does not establish the quantitative transferability it claims. The contribution is potentially significant but is presently conditional on external parameter validity and on a few non-standard methodological choices.
major comments (5)
- [Methods, 'Deprivation cost function' (Eq. 1); Discussion] The monetized outputs in Table 2 are all computed through DC = 35.95 t^2 + 107.84 t + 71.89, with coefficients taken from the authors' companion preprint (ref. [32]). No uncertainty intervals are attached to these coefficients, no transfer validation is provided for applying a single stated-preference function to four different states, income strata, and storm contexts, and the Discussion explicitly concedes the function may not reflect WTP variation across cultural, health, and social contexts. Because the total costs, per-capita burdens, cross-event rankings, and the regressivity measures all scale with Eq. 1, this is a load-bearing unsupported transfer. The authors should either demonstrate transfer validity (e.g., sensitivity to plausible coefficient ranges, calibration to observed outage outcomes, or evidence that WTP is stable across regions) or reframe the dollar figures as scenar
- [Methods, 'Average power outage duration (days) per customer' and 'Deprivation cost function'] The average outage-days metric is computed by dividing total customer-days by the maximum daily customer count, and the total deprivation cost is then computed as 'average DC times total affected customers.' Since Eq. 1 is convex in t (t^2 term), DC(E[t]) * N is not equal to the sum of individual deprivation costs; the aggregation is biased and its direction depends on the outage-duration distribution. The manuscript does not define 'total affected customers' unambiguously in the total-cost formula. This affects every total in Table 2. The authors should either compute the sum of per-customer DCs using the full distribution of outage durations, or provide bounds and state clearly that the reported total is an approximation based on the mean duration.
- [Methods, 'Affected Area Identification'] The affected-area classification is not fully specified. For Helene and Milton, the text says a ZCTA is affected if its impact median 'exceeded the threshold,' but no threshold value is reported. For Ida, the baseline is taken from a post-event recovery window (September 18–24, 2021) and the affected-area rule is '80% of the baseline,' which is qualitatively different from the rule for the Florida events. These choices determine which ZCTAs enter the analysis and therefore drive the totals and per-capita values in Table 2. The authors should report the exact threshold(s), justify the event-specific differences, and provide a robustness check (e.g., varying the threshold) to show that the cross-event comparisons are not artifacts of the inclusion rule.
- [Results, Figures 7–8; Methods, 'Random Forest and SHAP'] The claim that restoration duration is the 'dominant driver' of deprivation cost and that the DC–duration relationship is 'mechanistic' is overstated. Restoration duration and relative restoration rate are computed from the same outage accumulation/restoration curves that produce average outage-days, which is the direct input to Eq. 1. The positive association between DC and restoration duration and the negative association with relative restoration rate are therefore partly mechanical. The SHAP analysis does not control for average outage-days or for the functional form of Eq. 1, so the dominance of restoration duration may reflect collinearity rather than an independent causal mechanism. The authors should control for average outage-days (e.g., partial dependence or SHAP with t included) and soften the causal language, presenting the SHAP results as explanatory associations within the
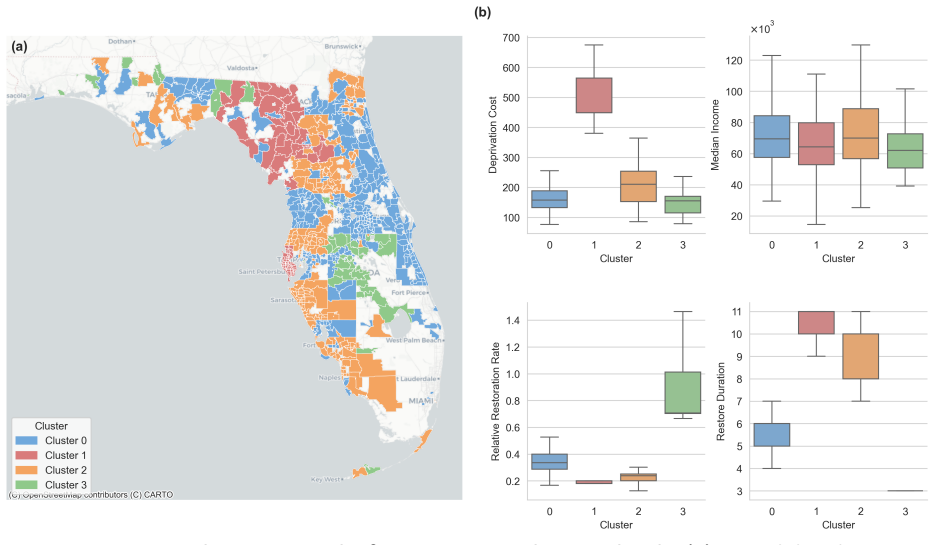
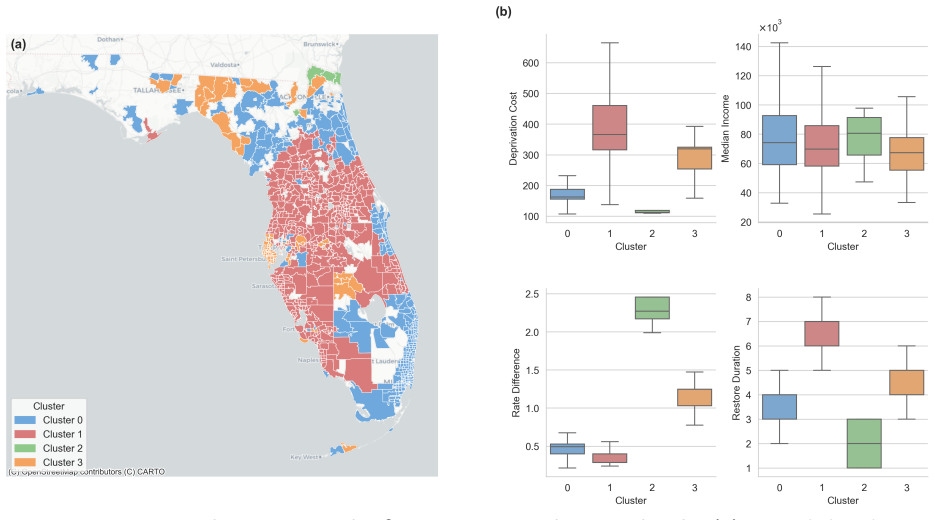
- [Methods, 'Curve fitting' and 'K-means Cluster'; Figures 6–8, 11–14] Several quantitative claims rest on curve fits and clusters whose quality is not reported. The curve fitting selects functional forms by AIC but no R^2, residual diagnostics, or confidence bands are given for the DC-versus-income, DC-versus-restoration-rate, or DC-versus-duration fits. The K-means analyses report k=4 without any model-selection criterion (e.g., elbow or silhouette) or validation. In addition, the text and Figure 11 caption contradict each other on whether Cluster 3 is 'lowest income' or 'high income.' These issues do not necessarily invalidate the qualitative findings, but they prevent the reader from assessing the strength of the reported regressive patterns and typology claims.
minor comments (7)
- [Abstract and text] 'per capital' should be 'per capita'; the terms 'restore duration' and 'restoration duration' are used inconsistently throughout.
- [Results, Table 2] The text refers to the deprivation cost table as 'Table 1' while the table is labeled 'Table 2'; Table 1 is the data sources list. Please renumber or fix the in-text reference.
- [Methods, Eq. 2] Equation 2 is rendered with garbled symbols; the definitions of outage rate and restoration rate should be written out explicitly so the ratio is unambiguous.
- [Data and Acknowledgment] The data section attributes outage data to EAGLE-I at Oak Ridge National Laboratory, while the Acknowledgment mentions the I-EAGLE dataset from NREL; please clarify the exact data source and access terms.
- [Methods, 'Random Forest and SHAP'] The random forest implementation lacks key reproducibility details: number of trees, hyperparameters, train/test split, cross-validation, and whether the target DC was transformed. Please report these.
- [Figures 6–8] The curve fits in Figures 6–8 would be much more informative with fit statistics and shaded confidence intervals; as shown, the fitted lines are not accompanied by any measure of scatter around the trend.
- [General] No code or data availability statement is provided. Given the reproducibility-oriented claims of a 'standardized pipeline,' the authors should make the processing scripts and derived data available.
Circularity Check
No significant circularity; deprivation-cost function is an external transfer with acknowledged limitations, and downstream analyses are empirical rather than definitional.
full rationale
The paper's derivation chain is not circular. The load-bearing element, the deprivation cost function DC = 35.95 t^2 + 107.84 t + 71.89 (Eq. 1), is imported from a separate stated-preference study (ref [32]) rather than fitted to the outage data in this paper. Although the authors overlap, this is a standard model transfer, not a self-fit-to-the-same-data reduction; the coefficients are not estimated from the four hurricanes analyzed here. The paper explicitly acknowledges the transfer limitation in the Discussion: 'The deprivation cost function, though empirically derived, represents a standardized approach that may not fully reflect variations in willingness-to-pay across diverse cultural, health, and social contexts.' This is a validity caveat, not a circularity. The claims that deprivation costs increase with restoration duration and decrease with relative restoration rate are empirical correlations based on separately defined recovery metrics, not mathematical consequences of Eq. 1. No equation in the paper reduces DC to restoration duration or relative restoration rate by construction, and the SHAP and clustering analyses use the computed DC values as outputs without feeding them back into the DC formula. Therefore, no fitted input is renamed as a prediction, and no self-citation replaces an independent derivation. The central quantitative results depend on the external validity of the DC coefficients, but that is a generalizability concern rather than a circular derivation.
Assumptions & free parameters
free parameters (4)
- DCF coefficients (35.95, 107.84, 71.89) =
35.95, 107.84, 71.89 (Eq. 1)
- Affected area threshold (per event) =
Not reported for Beryl/Helene/Milton; 0.80x baseline for Ida
- Baseline windows =
Sep 19-25 2024 (Helene/Milton); Sep 18-24 2021 (Ida)
- Number of clusters k in K-means =
4 for all events
assumptions (4)
- domain assumption EAGLE-I outage counts accurately reflect customer-level outages at 15-min/hourly resolution
- ad hoc to paper The deprivation cost function estimated in a separate stated-preference study (ref [32]) transfers across regions, storms, and time periods without adjustment
- domain assumption ZCTA-level ACS 5-year estimates (2018-2022) represent the population at each event time
- ad hoc to paper Average outage-days per customer can be computed by dividing total customer-days by the maximum daily customer count during the event
Cite this review
Pith. "Pith review of Quantifying the Social Costs of Power Outages and Restoration Disparities Across Four U.S. Hurricanes." pith.science (2026). https://pith.science/paper/BOGRDQBF
@misc{pith2026250902653,
  author       = {Pith},
  title        = {Pith review of: Quantifying the Social Costs of Power Outages and Restoration Disparities Across Four U.S. Hurricanes},
  year         = {2026},
  howpublished = {\url{https://pith.science/paper/BOGRDQBF}},
  note         = {Machine review of arXiv:2509.02653}
}
read the original abstract
The multifaceted nature of disaster impact shows that densely populated areas contribute more to aggregate burden, while sparsely populated but heavily affected regions suffer disproportionately at the individual level. This study introduces a framework for quantifying the societal impacts of power outages by translating customer weighted outage exposure into deprivation measures, integrating welfare metrics with three recovery indicators, average outage days per customer, restoration duration, and relative restoration rate, computed from sequential EAGLE I observations and linked to Zip Code Tabulation Area demographics. Applied to four United States hurricanes, Beryl 2024 Texas, Helene 2024 Florida, Milton 2024 Florida, and Ida 2021 Louisiana, this standardized pipeline provides the first cross event, fine scale evaluation of outage impacts and their drivers. Results demonstrate regressive patterns with greater burdens in lower income areas, mechanistic analysis shows deprivation increases with longer restoration durations and decreases with faster restoration rates, explainable modeling identifies restoration duration as the dominant driver, and clustering reveals distinct recovery typologies not captured by conventional reliability metrics. This framework delivers a transferable method for assessing outage impacts and equity, comparative cross event evidence linking restoration dynamics to social outcomes, and actionable spatial analyses that support equity informed restoration planning and resilience investment.
Figures


Figures from the paper (11 more)



Reference graph
Works this paper leans on
-
[9]
Mitsova, D., Esnard, A.-M., Sapat, A. & Lai, B. S. Socioeconomic vulnerability and electric power restoration timelines in Florida: the case of Hurricane Irma. Nat. Hazards 94, 689–709 (2018). 10. Dugan, J., Byles, D. & Mohagheghi, S. Social vulnerability to long-duration power outages. Int. J. Disaster Risk Reduct. 85, 103501 (2023). 11. Shao, J., Wang, ...
work page 2018
-
[18]
Xie, D., Cai, S. & Gui, X. Reclaiming justice for energy-vulnerable populations: Evidence from the city of los angeles. Energy Strategy Rev. 51, 101317 (2024). 19. Ferrall, I., Callaway, D. & Kammen, D. M. Measuring the reliability of SDG 7: the reasons, timing, and fairness of outage distribution for household electricity access solutions. Environ. Res. ...
work page Pith review arXiv doi:10.48550/arxiv.2501.10835 2024
-
[28]
Cantillo, V., Serrano, I., Macea, L. F. & Holguín-Veras, J. Discrete choice approach for assessing deprivation cost in humanitarian relief operations. Socioecon. Plann. Sci. 63, 33–46 (2018). 29. Holguín-Veras, J. et al. Econometric estimation of deprivation cost functions: A contingent valuation experiment. J. Oper. Manag. 45, 44–56 (2016). 30. Macea, L....
work page Pith review arXiv doi:10.48550/arxiv.2506.16993 2018
-
[36]
Hamilton, R. I. & Papadopoulos, P. N. Using SHAP Values and Machine Learning to Understand Trends in the Transient Stability Limit. Preprint at https://doi.org/10.48550/ARXIV.2302.06274 (2023). 37. Toubiana, D. & Maruenda, H. Guidelines for correlation coefficient threshold settings in metabolite correlation networks exemplified on a potato association pa...
work page Pith review arXiv doi:10.48550/arxiv.2302.06274 2023
Reviewed August 5, 2026 · model on record in the stance chip above.
Discussion (0). Continue with ORCID to comment.